

 Average IQ in India: 76.24
10,237 completed today
Average IQ in India: 76.24
10,237 completed today
Online IQ Test —
Get Your IQ Score
Instantly.
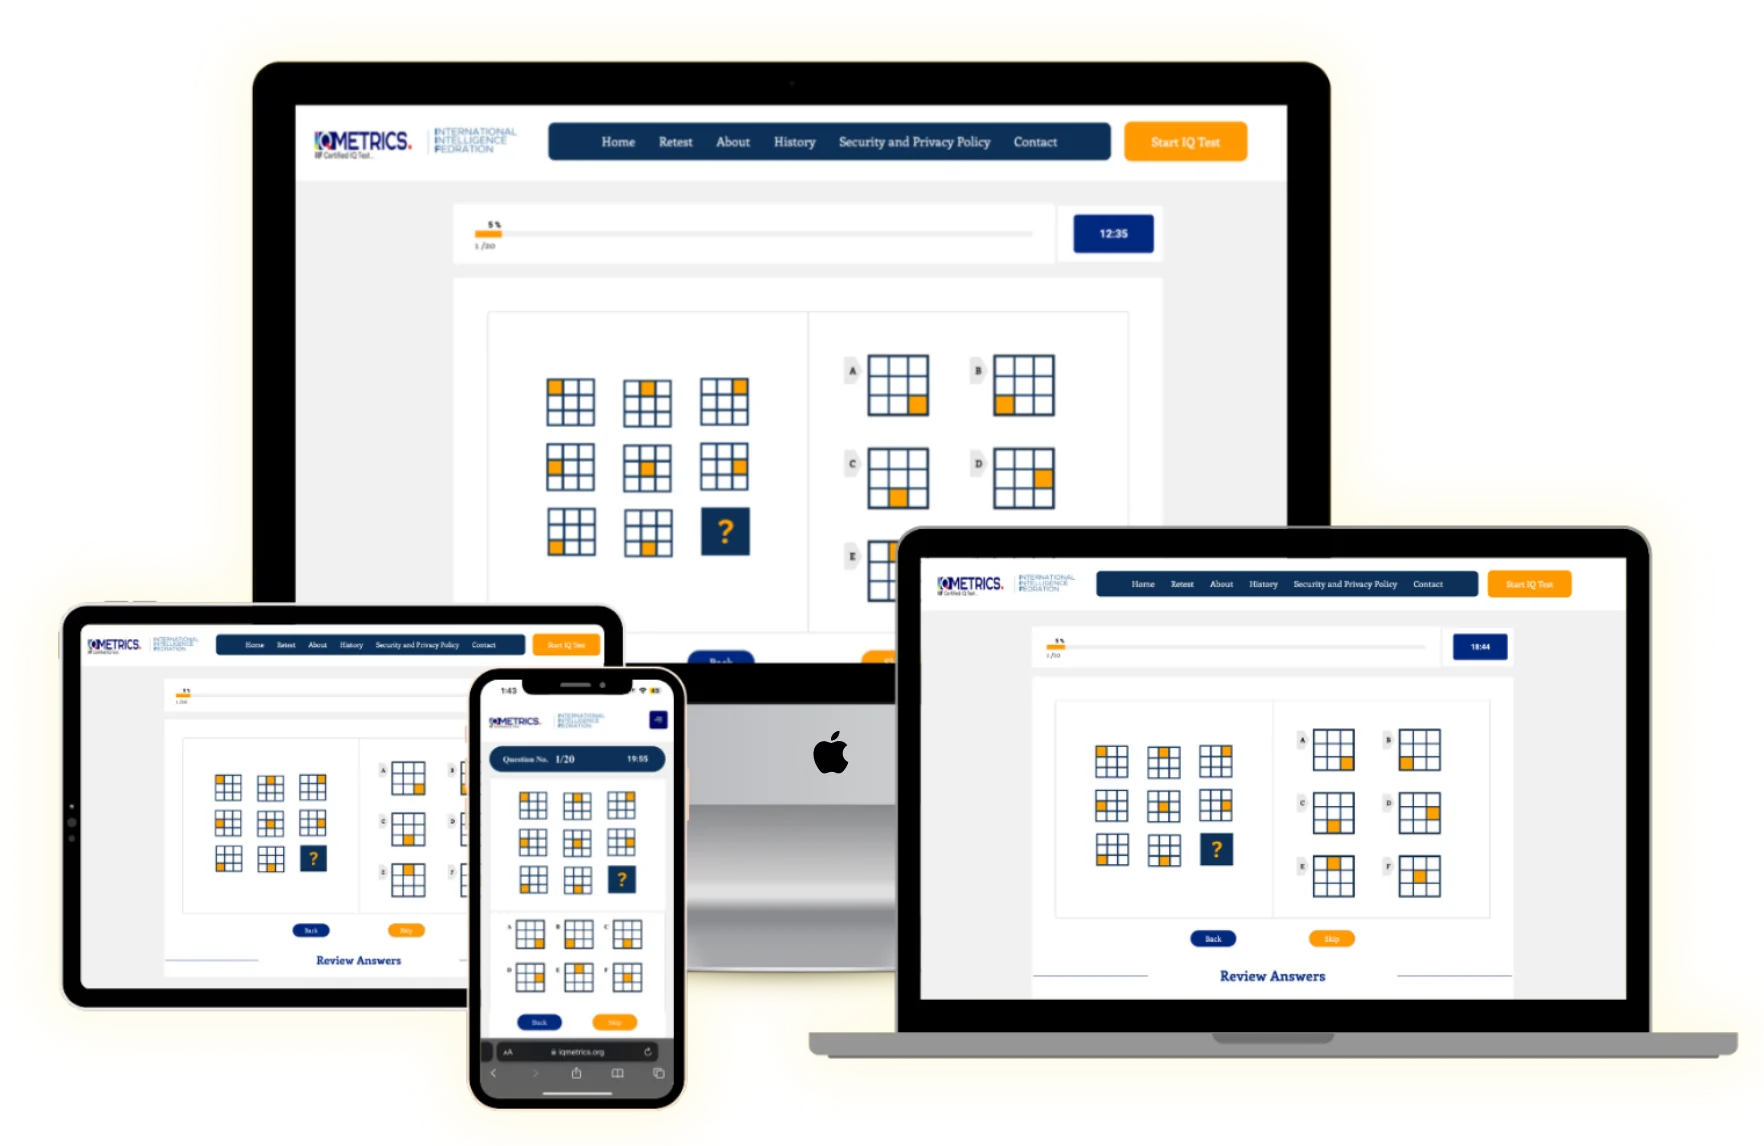
Take an online IQ test and measure your cognitive skills, logic, and problem-solving abilities. Get your score, percentile and insights instantly.
 Excellent 4.8/5
1 million+ test takers
IIF certified
Excellent 4.8/5
1 million+ test takers
IIF certified
Understand exactly how your mind measures up
Most people have a rough sense of what they are good at and a much vaguer sense of how that compares with anyone else. An IQ test replaces the vague part with something specific: a normed, comparable estimate of how you reason against people your own age, reported with the honesty a number like that deserves.
Our assessment covers logical and abstract reasoning, verbal reasoning, numerical reasoning, spatial ability and working memory under time pressure. You get a composite score, a percentile, a confidence range and a breakdown by domain — because the shape of a result is usually more useful than its total.
See where you sit on the distribution, not just what you scored — the comparison, not the figure, is the better reason to take a test.
Find the domains you are strongest and weakest in, and what a wide gap between two of them means.
Get an IIF certificate recording the scale, percentile and date — three of the things any score report should state.
Interrogate the result afterwards with our IQ tools.
The IQ distribution — where will you land?
Live normsWhat Is an IQ Test? Understanding Intelligence Quotient
An IQ test (intelligence quotient test) is a standardised set of reasoning problems that places your performance against other people your age. It measures logical, verbal, numerical and spatial reasoning and working memory, and reports a position on a distribution: a useful estimate, with known error, of a narrow band of cognitive skill.
A Short History: From the 1905 Binet–Simon Scale to Modern Psychometrics
In 1904 the French Ministry of Public Instruction wanted to identify pupils needing extra teaching support. Alfred Binet and Théodore Simon answered in 1905 with a graded scale of about thirty short tasks: naming objects, defining abstract words, repeating digits. Binet denied that it measured a fixed quantity.
The arithmetic came later. In 1912 William Stern proposed dividing mental age by chronological age — the ratio behind the phrase intelligence quotient — and Lewis Terman renormed the scale as the Stanford–Binet in 1916. Our history of IQ testing traces how quickly it was pressed into service for schooling, immigration and army selection.
David Wechsler and Why 100 Became the Average Score
The ratio formula breaks on adults: mental age stops climbing in step with chronological age in adolescence, so a 40-year-old and a 20-year-old of identical ability produce different quotients. David Wechsler abandoned it — his Wechsler–Bellevue scale of 1939, ancestor of today's WAIS, replaced the quotient with a deviation score, which asks how far you sit from the average of your own age group and rescales that answer so the mean is 100. The 100 is a definition, not a discovery: see the bell curve and what an average score means.
What “Intelligence Quotient” Actually Means
Your score is a rank, not an amount, and it carries measurement error: it reports where you fell among same-age peers who sat the same items, as our percentile calculator shows. What these tests capture is a cluster of reasoning abilities that psychometricians since Charles Spearman have called g. Creativity, drive and character are not measured here, as we discuss at length. See also how IQ tests work and what your score really means.
IQ score ranges and what each level means
The IQ test range on the standard IQ scale runs from below 70 to above 130, and each IQ level below is a band on that scale. Classification labels are conventions, not diagnoses. They describe a position on the curve and nothing more — two people in the same band can have very different profiles underneath. The percentages below are the share of the general population expected in each band on a scale with a mean of 100 and a standard deviation of 15; some tests norm to 16 instead, which changes every percentage below.
130+Very superior
The top 2% of the population, and the conventional threshold used by Mensa. Roughly 1 person in 44. At this level the composite is best read alongside its confidence interval, because individual items start to run out of ceiling.
120–129Superior
About 7% of people, sitting between the 91st and 97th percentile. Typically comfortable with abstraction and multi-step reasoning, and well represented in graduate study and analytically demanding work.
110–119High average
Around 16% of people. Above the middle of the distribution without being unusual. Small differences inside this band are often smaller than the measurement error attached to them.
90–109Average
Half the population sits here, spanning the 25th to the 75th percentile. A score of exactly 100 is the definitional midpoint, so it is the single most common result on any properly normed test.
80–89Low average
Roughly 16% of people. Often reflects a particular profile rather than a general limit — a slow processing speed or a weak verbal domain can pull a composite down while other domains sit near the mean.
Below 80Borderline and below
About 9% of the population falls below 80. An online screening result in this range is not a clinical finding and should never be treated as one. A supervised assessment is the only appropriate next step if the question matters.
Use the percentile calculator to convert any score into its population rank, or the score converter to move a figure between scales. Further reading: ranges of IQ level, the IQ level chart and what counts as a genius score.
IQs of famous personalities
These are the figures that circulate, not measurements taken by IQ Metrics. Almost none of these people sat a modern, supervised test; where a number has a traceable origin we say so on the profile, and where it does not, we say that too. A separate piece on where celebrity IQ numbers come from follows several of the best-known figures back towards their source. Treat the wall below as a map of what gets claimed, and follow a card for the evidence behind it.

Albert Einstein
Reported160
Isaac Newton
Reported190
Magnus Carlsen
Reported190
Donald Trump
Reported156
Elon Musk
Reported155
Nikola Tesla
Reported160
Stephen Hawking
Reported160
Rowan Atkinson
Reported178Every figure above links to a profile that separates the reported claim from the documented record. Start at the Celebrity IQ database, or compare yourself against the pattern with the comparison tool once you have taken the test.
Celebrity IQ Database
Every profile we hold, with the claimed figure, its earliest traceable source and what the record actually supports.
IQ by Country
National average estimates, what the underlying studies actually sampled, and why cross-country comparison is harder than the league tables suggest.
Historical Geniuses
Where historiometric estimates come from, what Catharine Cox's 1926 method can and cannot tell us, and why the famous numbers are so wide apart.
IQ in Pop Culture
The actors, musicians and athletes whose scores get quoted most, and how the claims travelled from a single listicle to common knowledge.
Your own numbers
Convert a score between scales, place it on the curve, project it across age bands, or see how far a repeat result should regress towards the mean.
Reading and research
Longer explainers on how the tests are built, what the evidence supports, and where the popular account of IQ goes wrong.
How IQ Scores Are Calculated: Bell Curves and Percentiles
IQ test scoring is not a count of correct answers. An IQ score is a position: where your performance sits relative to a norming sample of people your own age. Understanding that conversion is the difference between reading your IQ test results and misreading them; the percentile calculator lets you run the conversion for any score.
The Gaussian Distribution (μ = 100, σ = 15)
Modern IQ scales are deviation scores, fixed by definition: the mean (μ) is 100 and the standard deviation (σ) 15. Scores are fitted to a normal distribution — the familiar bell curve, symmetrical about its centre and thin at both tails.
Because the shape is fixed, the 68–95–99.7 rule applies directly: roughly 68% of people score between 85 and 115, about 95% between 70 and 130, and around 99.7% between 55 and 145 — properties of the model, not tallies of real people.
Converting Raw Correct Answers into a Normed IQ Score
A raw total carries no meaning on its own: twenty-eight out of forty tells you nothing until you know how others fared — and when those others were measured. The conversion runs in three stages.
Rank against the norming sample
Your raw total is placed within those of a reference sample, stratified by age and, where possible, education and region.
Express it as a z-score
That position becomes a z-score: how many standard deviations above or below the sample mean you sit.
Rescale to the IQ metric
The z-score is transformed by z × 15 + 100. A z of +1.00 yields 115; a z of −1.33 yields roughly 80.
This is why a 25-item and a 60-item test can return the same estimate: both report a rank, not a workload, and why how the norming was done matters more than how long you sat. See also our accuracy notes and regression to the mean.
Percentile Breakdown: Where You Rank in the General Population
A percentile rank states the share of the population scoring at or below your result. The values below are rounded model estimates, not headcounts. The rarity column expresses each score's tail as a frequency — how uncommon a score of 130 really is.
| IQ score | Approx. percentile | Approx. tail rarity |
|---|---|---|
| 70 | 2nd | About 1 in 44 |
| 85 | 16th | About 1 in 6 |
| 100 | 50th | 1 in 2 |
| 115 | 84th | About 1 in 6 |
| 130 | 98th | About 1 in 44 |
| 145 | 99.9th | About 1 in 740 |
Figures at 145 and beyond are the least trustworthy: few norming samples reach that far out. Explore any value with the percentile calculator, compare bands on the level chart, or take the test.
Average IQ by Age: How Cognitive Ability Changes Across a Lifetime
People search for average IQ by age expecting a table that rises and falls. Because modern tests are age-normed, the average at every age is 100 by construction. What changes across a lifetime is raw cognitive performance, not the normed number.
Each age group is compared only against its own peers. A 25-year-old and a 70-year-old who both score 100 are not performing identically on the raw items; each sits at the midpoint of their own reference group, as our page on IQ and age explains.
IQ in Childhood and Adolescence (Ages 5–17)
Before roughly age 10 a child's score is comparatively unstable: early assessments correlate only modestly with adult results, and extreme early scores drift back towards the average on retesting — see regression to the mean. Treat a young child's figure as provisional; our kids IQ test is written with that caution in mind.
Peak Cognitive Performance: The 20s and 30s
Raw processing speed and working memory are usually reported to peak between the late teens and late twenties, while vocabulary, general knowledge and judgement keep climbing for decades after. The “peak age” question therefore has no single answer, and a composite smooths the divergence out of view.
How Fluid Intelligence and Crystallised Intelligence Diverge With Age
Raymond Cattell and John Horn drew the distinction that makes the age pattern intelligible, and John Carroll's 1993 survey folded it into the three-stratum hierarchy now called the Cattell–Horn–Carroll model.
GfFluid intelligence
Reasoning with novel material: matrix problems, unfamiliar sequences, on-the-spot inference. Raw Gf is generally reported to decline gradually from the twenties or thirties onwards.
GcCrystallised intelligence
Accumulated knowledge and verbal skill: vocabulary, factual recall, learned procedure. Gc typically rises into the sixties and then holds.
Because most full-scale tests blend both, the composite hides the divergence, so tracking IQ scores over time is more informative when the subtests are read separately.
IQ Testing After 60: What Changes and What Doesn’t
Slower processing speed is a normal feature of ageing, not by itself a sign of dementia.
Strictly timed formats penalise that slowing and can understate reasoning ability.
Well-practised knowledge and verbal ability are typically well preserved into later life.
If you are over 60, favour an untimed format and read the result alongside your own earlier scores rather than against a younger cohort. Our assessment reports a range, not a single figure, for exactly this reason.
What IQ Score Do You Need to Qualify for Mensa?
Mensa does not publish a single magic number. Its admission rule is a percentile: you must score at or above the 98th percentile of the general population on an approved, supervised test. The number attached to that percentile changes with the scale the test uses.
Mensa International
Founded in Oxford in 1946. The rule is a percentile, not a number: the top two per cent.
Approx. 130 on SD 15 · 132 on SD 16Intertel
One step further out on the tail: half as many clear it as clear Mensa's.
Approx. 135 on SD 15Triple Nine Society
One person in a thousand. Here the tests start to run out of ceiling.
Approx. 146 on SD 15Mensa was founded in Oxford in 1946 by Roland Berrill and Lancelot Ware on a deliberately narrow idea: a society whose only entry criterion was measured cognitive performance, with no bar based on profession, politics or background. That criterion still governs admission, which is why Mensa requirements are stated as a percentile rather than a score.
How Mensa’s Required Percentile Compares to This Test’s Scoring
The top 2% means roughly one person in fifty. On a modern SD-15 scale — the convention used by the Wechsler scales and by this test — the 98th percentile sits at approximately 130; on the SD-16 scale historically used by the Stanford-Binet, the same cut-off is approximately 132. One level of performance, two numbers: the difference is arithmetic, not ability.
Our score converter translates between the two scales, the bell curve explainer shows why the tail thins so sharply above 130, and the level chart sets the bands out side by side. Read your own result as a rank rather than a trophy: the percentile calculator estimates your population rank, and our accuracy notes explain why it should carry a margin of error.
Other High-IQ Societies and Their Score Thresholds (Triple Nine, Intertel)
Intertel was founded in 1966 and the Triple Nine Society in 1978, the latter named for its threshold of one person in a thousand. Each keeps its own list of accepted instruments, so check the rules of the chapter you are applying to.
| Society | Percentile | Approx. SD-15 score |
|---|---|---|
| Mensa | 98th | ~130 |
| Intertel | 99th | ~135 |
| Triple Nine Society | 99.9th | ~146 |
Can You Use an Online IQ Test Score to Apply to Mensa?
No. No online result, including this one, is accepted as qualifying evidence. Admission comes through Mensa’s own supervised test, or through approved prior evidence from a supervised administration by a qualified examiner. Unsupervised conditions cannot rule out interruptions, retakes or assistance, so no online instrument can meet that standard.
How this IQ test works
Three steps, about twenty minutes, and a result you can actually reason with. No sign-up is needed to begin, and nothing is scored until you finish. Whether you searched for an IQ checker, an IQ tester or an IQ quiz, this is the same instrument: an IQ test for adults with 30 calibrated items on one standard scale.
Answer 30 calibrated questions
Items are drawn across logical, verbal, numerical and spatial reasoning, ordered so difficulty rises as you go. Every test-taker sees the same standardised items under the same timing, which is what makes the comparison meaningful.
Your raw answers are normed
Correct answers are weighted by item difficulty, ranked against the norming sample for your age band, and converted into a deviation score on the standard scale — mean 100, standard deviation 15.
You get a score, a rank and a range
The result reports your composite, your percentile, the confidence interval around it and a breakdown by cognitive domain, together with an IIF certificate recording the scale and the date.
Are Online IQ Tests Accurate? What the Research Says
A real IQ test online is a good indicator and a poor substitute. A well-constructed, standardised online test can measure the same reasoning abilities a clinician would probe, but it cannot verify who is at the keyboard, control your surroundings, or watch how you reached an answer. What separates an accurate online IQ test from a quiz is norming on a real sample, calibrated items, a percentile and a stated confidence range.
That distinction explains most of the disagreement about online testing. The instrument and the setting are different things, and only one is under our control: we build the items, the timing and the norms; you supply the room, the device and the state of mind. More detail sits in how accurate IQ tests are.
Reliability and Validity in Self-Administered Testing
Reliability means consistency: would this assessment give a similar result under similar conditions? Validity asks something else: does it measure the construct it claims to? A test can be highly reliable and still measure the wrong thing, which is why what makes an IQ test reliable is never a fact about the questions alone.
Internal consistency asks whether items within one test agree; coefficients for well-normed batteries sit near 0.85–0.95.
Test-retest reliability asks whether the same person scores similarly weeks later.
Construct validity is assessed against established batteries — though whether those capture intelligence at all is a further question.
How Standardised Scoring Reduces Bias Between Test-Takers
Every test-taker meets identical items, time limits and scoring rules, which removes examiner variance in rapport, pacing and prompting. Non-verbal formats, in the tradition of Raven's matrices and Cattell's Culture Fair scales, reduce the advantage conferred by language fluency without removing it. Self-administration adds noise of its own, though: interruptions, an unfamiliar device or a noisy room all depress performance in ways a supervised setting would catch, and our approach is set out in why us.
Margin of Error: Why One Score Is a Snapshot, Not a Verdict
Every score carries a confidence interval. A result of 118 is better read as roughly 113–123: the point estimate is convenient, the band is truthful, so quote both together.
Two further effects distort repeat testing: practice effects can lift a second attempt by a few points with no change in ability, and an unusually high or low first result tends to drift back towards your own average, an artefact explained in regression to the mean.
How Online Tests Compare to Clinical, Supervised Testing
A supervised assessment adds what an online test structurally cannot: identity verification, controlled conditions, observation of effort, and interpretation set against your history. It also carries diagnostic and legal standing a self-administered result does not.
A number is easy. Context is the work.
Anyone can print a figure. What makes a result worth having is knowing what was measured, against whom, and how certain it is.
The last of those is the one a single number cannot carry: every composite sits inside a range, and how wide that range should be is part of the result rather than a footnote to it.
Scientifically developed
Built by specialists in psychology, psychometrics and educational assessment, drawing on the traditions behind Raven's matrices, the ICAR open item bank and the CHC model of cognitive ability. Every item is normed before it counts.
Experienced by 1 million+
More than a million completed assessments across more than 150 countries. A large, live sample is what keeps the norms current, and current norms are what stop a score drifting out of date.
Learn your strengths and weaknesses
You receive a domain-by-domain profile, not a lone composite. Two people with an identical total can have opposite shapes, and the shape is usually the part you can act on.
Precision you cannot support is not a service, it is a decoration. Every score we publish arrives with the confidence range that belongs to it.
The IQ Metrics assessment standardThe Science Behind Modern Psychometric Testing
Every reputable cognitive assessment rests on published research rather than private opinion. Three traditions matter most: Raven’s matrices, the open ICAR item bank, and the Cattell-Horn-Carroll model. Our assessment draws on all three.
Raven’s Progressive Matrices & Non-Verbal Testing
John C. Raven introduced the Progressive Matrices in 1936: a grid of abstract shapes with one cell missing, and candidate completions from which you select the one that fits the rule. No prose instructions, no vocabulary, no arithmetic. That austerity is not an aesthetic preference — carrying no verbal or curricular content, matrix items reduce, without eliminating, the cultural and educational loading that burdens vocabulary questions. Factor-analytic studies consistently report that they load strongly on g, the general factor Charles Spearman described in 1904, which is why the format anchors so many culture-fair assessments.
The ICAR (International Cognitive Ability Resource) Open Standard
ICAR is a public-domain item bank for cognitive ability, described by David Condon and William Revelle in a 2014 paper in the journal Intelligence. Its governing idea is transparency: where most commercial instruments keep their items proprietary, ICAR publishes them openly, so anyone can check the psychometrics independently. The trade-off is that what is public can be practised — a cost worth paying, and one that shapes who we are as a publisher.
Matrix reasoning: Raven-style abstract completion items.
Verbal reasoning: inference and relational questions in language.
Letter and number series: rule induction over ordered sequences.
Three-dimensional rotation: mental manipulation of solid forms — with consequences for retesting set out in our accuracy notes.
The CHC (Cattell-Horn-Carroll) Theory of Human Cognitive Abilities
CHC theory synthesises two lines of work. Raymond Cattell and John Horn separated fluid reasoning (Gf) from crystallised knowledge (Gc) between the 1940s and the 1960s; John Carroll then re-analysed more than 400 datasets in his 1993 survey Human Cognitive Abilities and proposed a three-stratum structure. The merged framework now shapes how batteries such as the Woodcock-Johnson are built, as how IQ tests work explains.
| Stratum | What it contains |
|---|---|
| III (general) | A single general factor, g. |
| II (broad) | Gf, Gc, visual processing (Gv), short-term memory (Gsm), processing speed (Gs) and others. |
| I (narrow) | Dozens of specific abilities, each measured by particular task types. |
The number of broad abilities at stratum II is still debated, but the shape is settled: specific skills nest inside broader domains, which correlate with a general factor. That nesting is the argument for reading a domain profile alongside the single figure, which is what our classical battery returns.
Does IQ Predict Job Performance and Career Success?
Cognitive test scores do carry information about how people fare at work and in education. That information is real, but it is statistical and partial — and what an aptitude score cannot forecast matters more than the headline correlation.
How Strong Is the Link Between IQ and Job Performance?
General mental ability, or GMA, is among the most heavily studied predictors in personnel selection: quick, standardised and applicable across many roles. The evidence is strongest for training performance — how rapidly someone acquires new job knowledge — and it strengthens as job complexity rises, so GMA carries more weight for a research scientist than for routine work. Our page on the importance of IQ tests in education and employment sets out where that leaves employers.
IQ, Income, and Academic Achievement: What the Research Shows
Associations between test scores and later educational attainment are consistently reported, and are typically stronger than the equivalent associations with income. Both are real, and both are modest for any individual person.
SCHOOLEducational attainment
Childhood scores are associated with years of schooling and examination results. School quality, family resources and continuity of attendance account for much of that association.
PAYEarnings
Correlations between adult IQ and income vary by study and country, and are weaker than the schooling association. Occupation, credentials, geography and inherited advantage all intervene.
GROUPAggregate versus individual
A correlation across thousands of people tells you very little about one person. Two people with identical scores routinely end up in very different circumstances.
The Limits of IQ as a Success Predictor
The variance cognitive scores fail to explain is the clear majority of it.
Restriction of range weakens prediction inside already-selected populations, such as graduate intakes.
Conscientiousness, health, opportunity and timing all contribute independently — and personality measures something ability tests do not.
Teams benefit from varied thinking styles, as explored in cognitive diversity at work.
Prediction here is probabilistic, never destiny. For the balanced case see the pros and cons of IQ testing and what your score really means, then take the test and treat the number as information.
How Cognitive Aptitude Impacts Career & Professional Growth
Cognitive ability is one of the more consistently studied predictors of training success, particularly in complex roles. It is not destiny — but understanding your own profile helps you choose work that plays to how you actually think.
Why Modern Employers Use Pre-Employment Aptitude Screening (CCAT, Wonderlic)
A pre-employment aptitude test is short, strictly timed and deliberately mixed: verbal, numerical and logical items in one sitting. The two best-known are the Criteria Cognitive Aptitude Test (CCAT), with 50 items in 15 minutes, and the Wonderlic Cognitive Ability Test, with 50 items in 12 minutes. Very few candidates finish either, and that is by design: these are speeded screens measuring how much correct work you produce under pressure, not clinical assessments.
High-Complexity Careers That Match Specific Cognitive Profiles
Two people can reach the same composite score by entirely different routes, and the shape of the profile is usually the more useful career signal — which is why what your score really means depends on the breakdown.
SPATIALBuild and visualise
Mental rotation and abstract reasoning suit engineering, architecture, surgery and industrial design: roles that reward holding a structure in mind. Our spatial reasoning test isolates it.
VERBALArgue and explain
High verbal comprehension suits law, editorial work, policy analysis and teaching: roles where meaning must be extracted precisely, then rebuilt. A verbal reasoning test reads cleaner than a composite.
NUMERICALModel and quantify
Numerical fluency suits actuarial science, quantitative finance and empirical research. Comfort with proportion matters more than speed. Try the numerical test, then your subtest comparison.
Leveraging Strengths in Non-Quantitative and Creative Roles
Abstract reasoning is not numeracy, and conflating the two costs people opportunities. Pattern-finding, analogical thinking and verbal fluency are what drive strategy, design, research direction and most genuinely creative work. A lopsided profile is an asset when matched to the right role. Test the components separately across the full assessment hub, beginning with the standard assessment to establish a baseline.
What test-takers say
Excellent 4.8 / 5
from over 1 million completed assessments
The confidence range changed how I read it
I had taken two other online tests and got two very different numbers with no explanation. This was the first one that told me the scale it used and how much error to expect. That single detail made the result feel like information rather than a verdict.
The domain breakdown was the useful part
My composite was around what I expected, but the spatial and verbal scores were much further apart than I would have guessed. It explained something about the kind of work I find easy that I had never been able to put into words.
Straightforward, and no hard sell
Started it on my phone during a commute and finished in about twenty minutes. No account needed before I began, no pressure at the end, and the certificate arrived with the date and scale on it, which is what I actually wanted.
Honest about what it is not
I appreciated being told plainly that an online result is an indicator and not a clinical assessment. I have seen sites imply the opposite. That candour is the reason I trusted the rest of the numbers.
Retested a year later and it held
Second result was four points off the first, comfortably inside the range they had given me the first time. Seeing the prediction actually hold did more for my confidence in the test than any marketing copy would have.
IQ test — frequently asked questions
The questions we are asked most, answered plainly. If yours is not here, the full FAQ goes further, and contact us if you would rather ask directly.
Taking the testHow do I find out my IQ?
Take a normed test and read the percentile, not just the number. Our online IQ test for adults has 30 questions, takes about twenty minutes and needs no signup to begin; at the end you unlock your IQ score, your percentile and a certificate, and a copy is emailed to you. For a score that counts for Mensa or a clinical decision, sit a supervised test administered by a psychologist, such as the WAIS.
How long does the IQ test take?
About twenty minutes for most people. There are 30 questions, and while individual items are timed, you are not racing a single global clock. Finish it in one sitting if you can: interruptions add noise to a measurement already sensitive to fatigue and attention.
Do I need to sign up before taking the test?
No. There is no signup and no email address required to begin — you can start immediately and work through all 30 questions. At the end you unlock your official score, your printable IIF certificate and the full performance report, and a copy of the result is sent to your email.
Do I need to prepare for an IQ test?
No, and cramming does not help — the items test reasoning rather than recall. What genuinely helps is the boring advice: a full night's sleep, a quiet room, a device you are comfortable with, and taking it when you are alert. Our guide on how to prepare for an IQ test covers this in more detail, and whether the underlying ability itself can be changed is a separate question.
Can I retake the test?
Yes. Bear in mind the practice effect: familiarity with the item formats tends to lift a second score modestly even when nothing about your reasoning has changed, and a very high or very low first result will tend to move back towards the average. Our page on regression to the mean explains why, and IQ over time shows what genuine change looks like.
Is this test suitable for children?
No: this is an IQ test for adults, normed on adult samples. A child's score is only meaningful when compared with same-age peers on age-appropriate items, so use the kids' IQ test instead, which has its own norms and shorter blocks. Where a formal question about a child's development is at stake, a supervised assessment is the right instrument.
What do my IQ test results include?
Your IQ test results include your IQ score, your percentile ranking against the general population, a printable IQ certificate issued in your name by the International Intelligence Federation (IIF), and a detailed performance report: a summary of your strengths and weaknesses across each cognitive category.
What is a good IQ score?
100 is the definitional average, and roughly two-thirds of people score between 85 and 115. Above 115 places you in the top 16%, and 130 or above in the top 2%. “Good” depends entirely on what you want the number for, which is why we report a percentile and a confidence range alongside the composite. See what an average IQ score means.
What is the average IQ test score?
100, by definition, on every modern scale: tests are normed so that the average is 100 and about two thirds of people score between 85 and 115. What changes between people and ages is where they sit on that curve. Our page on the average IQ score explains how the norming works.
Is a higher IQ score always better?
Not in any straightforward sense. A higher score means you ranked higher on a specific set of reasoning tasks under test conditions — nothing more. It does not predict happiness, judgement, creativity or decency; on judgement in particular, see why clever people still make bad decisions. Beyond about 130, differences between scores are frequently smaller than the measurement error attached to them, so treating 137 as meaningfully better than 133 misreads the instrument.
How is my percentile calculated from my raw score?
Your raw correct answers are weighted by item difficulty and ranked against the norming sample for your age band. That rank becomes a z-score — how many standard deviations you sit from the sample mean — which is rescaled to the familiar 100/15 scale. An IQ of 115 sits one standard deviation above the mean, or about the 84th percentile. You can run the conversion yourself in the percentile calculator.
Can two people with the same IQ score have different strengths?
Yes, and it is one of the most useful things a domain breakdown tells you. A composite is an average across several abilities, so one person can reach 120 through strong spatial and abstract reasoning with weaker verbal scores, while another reaches the same 120 from the opposite direction. That is why we report the domains rather than only the sum.
Does age affect how my IQ score is calculated?
It affects the comparison, not the arithmetic. Because scores are normed within age bands, the average is 100 at every age by construction — a 60-year-old scoring 110 is compared with other 60-year-olds, not with 25-year-olds. What does change with age is raw performance: processing speed and fluid reasoning decline gradually, while accumulated verbal knowledge holds up. See IQ and age.
How long is an IQ score valid?
For adults, cognitive ability is reasonably stable, so a score from a well-normed test remains a fair guide for years. Two caveats: norms are periodically re-standardised, so an old figure may not be directly comparable to a current one; and childhood scores are considerably less stable. More on how long an IQ test stays valid.
How accurate is an online IQ test?
A well-constructed online test is a good indicator and a poor substitute for a supervised clinical assessment. Standardised items and scoring remove examiner variance, but self-administration adds noise a clinic controls for: interruptions, device differences, fatigue, and no verification of who is answering. Read the result as a band rather than a point, and see IQ test accuracy.
Which online IQ test is the most accurate?
The most accurate online IQ test is the one that is normed on a real sample, calibrates every item, reports a percentile with a confidence range, and says plainly what it cannot measure. Ours does those four things. No online test can verify who is answering or control the room, which is why even a good online result is a band, not a clinical score. See how IQ test accuracy is measured.
Can I use this score to apply to Mensa?
No. Mensa requires either its own supervised admission test or approved prior evidence from a supervised, proctored administration, and no online result qualifies — including ours. What a well-calibrated online score does tell you is whether sitting the supervised test is likely to be worth your time. The Mensa section above sets out the thresholds.
How does IQ Metrics protect my data and privacy?
Your responses and your score are yours. We do not sell personal data, and a result is never published or attached to your name anywhere public unless you choose to share it. You can begin without creating an account, and you can request deletion of your data at any time. The full detail is in our security and privacy policy.
Is the result a clinical or diagnostic assessment?
No. This is an educational and self-insight instrument. It is not a diagnosis, it is not a medical or psychological evaluation, and it should not be used for clinical, educational-placement or employment decisions. If a formal assessment is needed, a qualified psychologist administering a supervised battery is the appropriate route.
Content reviewed by the IQ Metrics editorial team. Last reviewed November 2026.
Ready to find out where you stand?
Thirty questions. About twenty minutes. A score reported with its scale, its percentile and its confidence range — plus an IIF certificate recording all three.
Start the IQ Test →