





IQ Ranges: Every IQ Level, Its Percentile and How Rare It Is
IQ ranges are bands of scores on a scale where 100 is average and one standard deviation is 15 points. See every range from below 70 to 145 and above, the percentile each score reaches, how rare it is and why the same number changes between tests.


IQ ranges are bands of scores on a scale where 100 is the average and one standard deviation is 15 points. About half of all people score 90 to 109, about 68% score 85 to 115 and about 95% score 70 to 130. A score of 130 or higher is the top 2.3% (about 1 in 44), 145 or higher is about 1 in 741, and 160 or higher is about 1 in 31,600. The figures below use the Wechsler scale (standard deviation 15) unless a section says otherwise.
| Score range | Share of people | What the band means |
|---|---|---|
| Below 70 | ~2.3% | Intellectual disability range; usually assessed with adaptive functioning, not the score alone. |
| 70 – 85 | ~13.6% | Borderline to low average. |
| 85 – 115 | ~68% | The average range — 85–99 low average, 100–115 high average. |
| 115 – 130 | ~14% | Above average (bright). |
| 130 – 144 | ~2% | Moderately gifted — the cutoff used by high-IQ societies such as Mensa. |
| 145 – 159 | ~0.13% | Highly gifted; about 1 in 760 people. |
| 160+ | ~0.003% | Profoundly gifted; about 1 in 31,600, and hard to measure reliably at this extreme. |
When people talk about Intelligence Quotient (IQ), they often throw around numbers like 100, 130, or 160. But without context, these numbers are just arbitrary figures. To truly understand an IQ score, you have to understand the IQ Bell Curve.
The Bell Curve (or Normal Distribution) is the statistical foundation of almost all modern IQ tests. It explains why most people are “average,” why “geniuses” are rare, and how we compare cognitive ability across the population.
In this guide, we’ll visualize the curve and break down the specific score ranges used by psychometricians today.
How rare is each IQ level?
The percentile is the share of people who score at or below a given IQ. The figures below come from the normal curve with a mean of 100 and a standard deviation of 15, the same arithmetic behind our IQ percentile calculator. Wechsler norm samples hold about 2,200 people, so the rows above about 145 are the curve extended past what was observed, a limit explained in why test scores stop near 160.
| IQ score | Percentile | Share scoring higher | How rare |
|---|---|---|---|
| 105 | 63.1st | 36.9% | 1 in 2.7 |
| 110 | 74.8th | 25.2% | 1 in 4.0 |
| 115 | 84.1st | 15.9% | 1 in 6.3 |
| 120 | 90.9th | 9.1% | 1 in 11 |
| 125 | 95.2nd | 4.8% | 1 in 21 |
| 130 | 97.7th | 2.3% | 1 in 44 |
| 135 | 99.0th | 0.98% | 1 in 102 |
| 140 | 99.6th | 0.38% | 1 in 261 |
| 144 | 99.83rd | 0.17% | 1 in 596 |
| 145 | 99.87th | 0.13% | 1 in 741 |
| 150 | 99.96th | 0.043% | 1 in 2,330 |
| 155 | 99.99th | 0.012% | 1 in 8,140 |
| 160 | 99.997th | 0.0032% | 1 in 31,600 |
Each five-point step above 140 makes a score about three to four times rarer, which is why the bands in the summary table above shrink so quickly. For one score at a time, follow the links in the first column.
Do IQ ranges change from test to test?
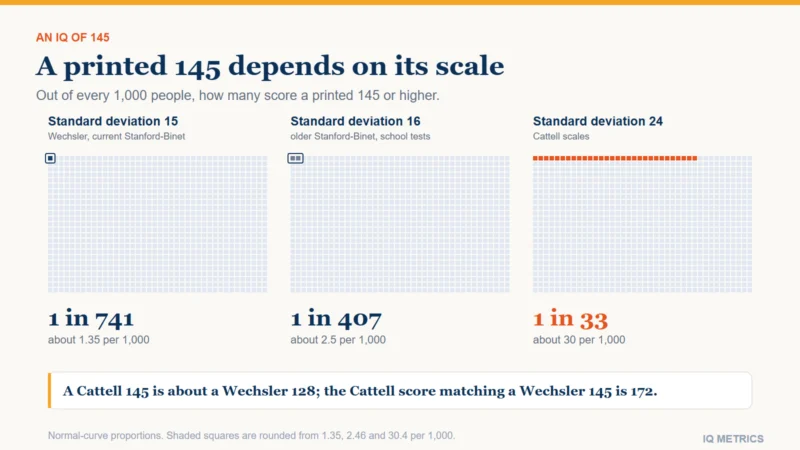
Yes, because the standard deviation is a publishing choice. The same standing prints as a different number on each scale: Wechsler tests use 15, older Stanford-Binet forms and several school ability tests use 16, and the Cattell scales use 24.
| Standing | Percentile | SD 15 (Wechsler) | SD 16 (older Stanford-Binet) | SD 24 (Cattell) |
|---|---|---|---|---|
| One SD above average | 84.1st | 115 | 116 | 124 |
| Two SD above average (top 2.3%) | 97.7th | 130 | 132 | 148 |
| Three SD above average (1 in 741) | 99.87th | 145 | 148 | 172 |
| Two SD below average (bottom 2.3%) | 2.3rd | 70 | 68 | 52 |
That is why the Mensa line reads 130 on one scale, 132 on another and 148 on a third, and why a printed 140 can mean very different things. Convert before you compare, using the IQ score converter. The standard deviation 15 vs 16 explainer works through the arithmetic, and the Mensa guide applies it to a well-known cut-off.
Where does the IQ score come from?
One way to evaluate a person’s cognitive capacity is by calculating their intelligence quotient (IQ). It includes things like working memory, processing speed, verbal comprehension, and perceptual reasoning.
Common methods for assessing IQ often involve administering standardized tests that measure different cognitive abilities. The goal of these tests is to provide a numerical score that represents a student’s level of intelligence relative to their peers. The most widely used and comprehensive IQ test is the Wechsler Adult Intelligence Scale (WAIS).
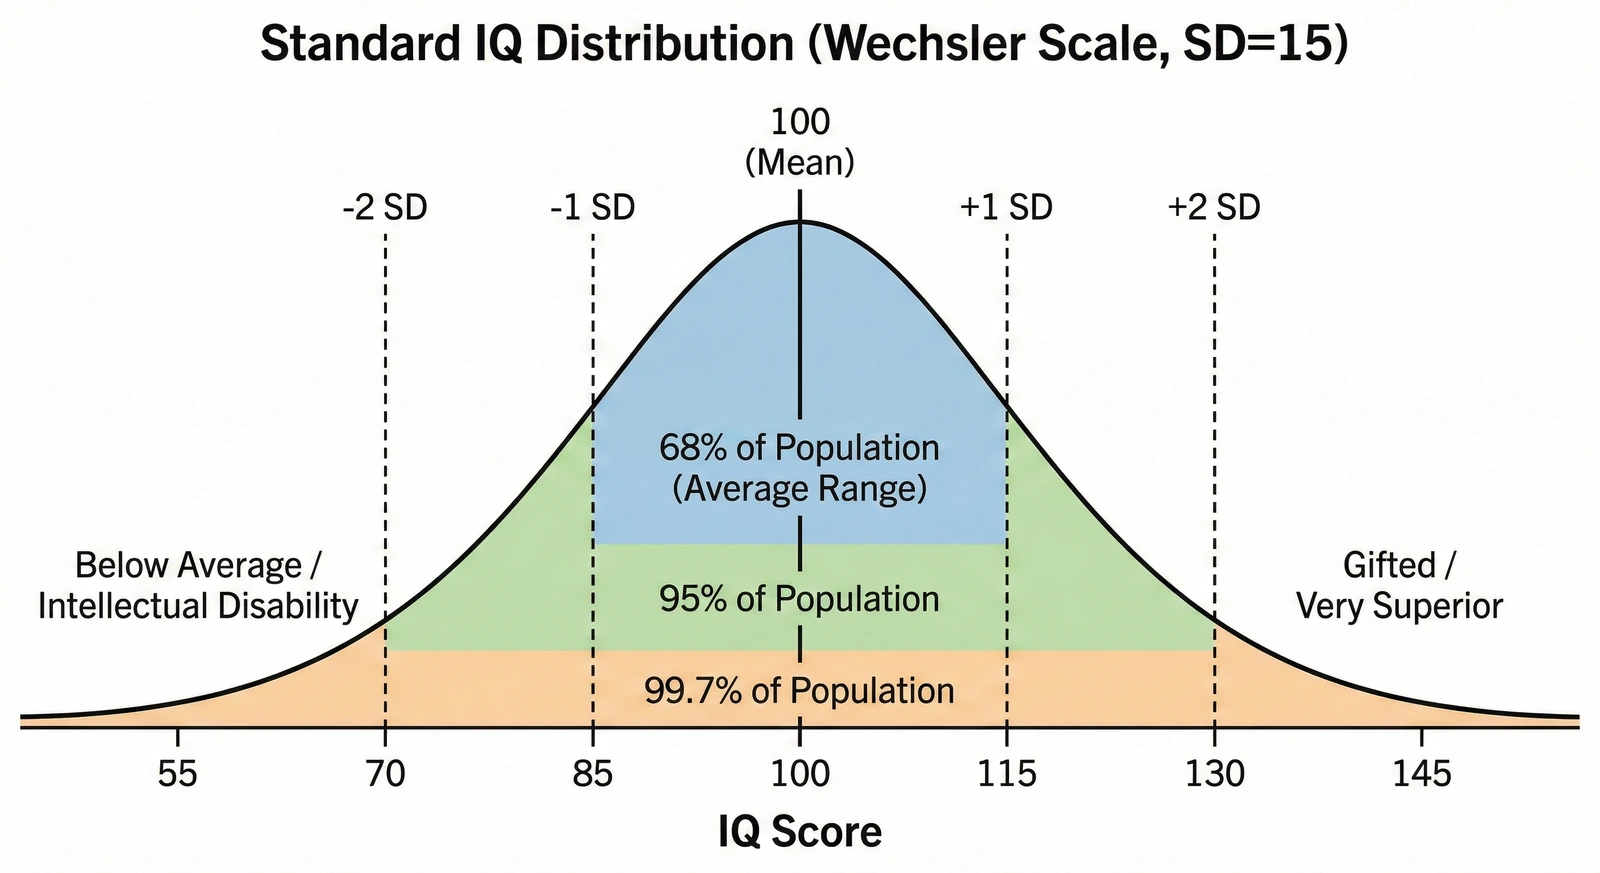
Understanding Standard Deviation
To understand the “ranges,” you need to understand Standard Deviation (SD). In most modern tests, such as the Wechsler Adult Intelligence Scale (WAIS) , the standard deviation is 15 points.
Think of the SD as a “step” away from the average.
- 68% of people fall within one step of the average (between 85 and 115).
- 95% of people fall within two steps (between 70 and 130).
- 99.7% of people fall within three steps (between 55 and 145).
If you score 130, you aren’t just “smart”—you are statistically two full deviations above the norm, placing you in the top 2% of the population.
IQ Score Ranges Breakdown
While different tests (like Stanford-Binet vs. Wechsler) use slightly different classifications, here is the generally accepted breakdown of IQ ranges.
85 – 115: The Average Range
- Population Share: ~68%
- Description: This is where the vast majority of humanity sits. People in this range can perform most jobs, complete high school and college, and function effectively in society.
- 85–99: Low Average
- 100–115: High Average
115 – 130: Above Average (Bright)
- Population Share: ~14%
- Description: Individuals in this range often grasp complex concepts faster than their peers. They tend to perform well in universities and professional fields such as engineering, law, and medicine.
130 – 144: Moderately Gifted
- Population Share: ~2%
- Description: This is the cutoff for high-IQ societies like Mensa. People in this range often exhibit early reading abilities and strong pattern recognition. They represent 1 in 50 people.
145 – 159: Highly Gifted
- Population Share: ~0.13%
- Description: This is a rare level of cognitive ability (about 1 in 760 people). Individuals here often have radically different learning needs and may accelerate through standard education systems rapidly.
160+: Profoundly Gifted
- Population Share: ~0.003% (about 1 in 31,600)
- Description: This is the “tail” of the curve. These scores are difficult to measure accurately because the sample size of people at this level is so small. This range is often associated with child prodigies and revolutionary thinkers, though high IQ does not guarantee high achievement.
Below 70: Intellectual Disability
- Population Share: ~2.3%
- Description: Scores below 70 may indicate cognitive challenges. This range often requires support systems for daily living or specialized education plans.
Where would your own score land?
Take the IIF-certified assessment and get your score with the scale it was measured on, the percentile it corresponds to and the confidence range around it — the three figures most online tests leave out.
Find your IQ score now! →What does a 144 IQ mean?
A score of 144 is the top of the moderately gifted band in the table above (130 to 144). It sits at about the 99.83rd percentile, roughly 1 person in 596. One point higher, 145, is where the Stanford-Binet 5 labels, as commonly published, change from “gifted or very advanced” to “very gifted or highly advanced”, and about 1 person in 741 scores at least that high. A single test cannot separate 144 from 145: a reported IQ carries a margin of roughly 5 points either side at 95% confidence, so the two are the same result for every practical purpose. For the band above, read what an IQ of 145 means; for the step before it, what an IQ of 140 means.
How accurate is an IQ range?
Every IQ score is an estimate with a margin of error. For a full-scale score on a well-built adult battery the standard error is commonly 2 to 3 points, which gives a 95% interval of roughly 5 points either side. A reported 112 therefore fits a true standing anywhere from about 107 to 117, a span that straddles the 110 line between the average and high-average labels. Read the band, not the point: an IQ score is a range, not a number, and how to read an IQ test report shows where a real report prints the interval.
Does High IQ Equal Success?
It is important to remember that the Bell Curve measures cognitive processing speed and pattern recognition —not worth, creativity, or potential for happiness.
While a high score correlates with academic success and income, it does not measure:
- Emotional Intelligence (EQ)
- Grit and determination
- Creativity and divergent thinking
A person with an IQ of 105 who works incredibly hard will often outperform a person with an IQ of 135 who lacks discipline.
Key Takeaways
- The average IQ is 100, and about half of people score 90 to 109.
- Most people (68%) score between 85 and 115; about 95% score between 70 and 130.
- A score of 130+ is the top 2.3% (about 1 in 44); 145+ is about 1 in 741.
- Ranges depend on the scale: the same top-2% line is 130, 132 or 148 depending on the test.
- A reported score carries a margin of about 5 points either side, so read the band, not the point.
- IQ is a comparative metric, not an absolute measure of human value.
How these ranges were calculated
Percentile and rarity figures are normal-curve arithmetic (mean 100, standard deviation 15). Band labels follow the Wechsler and Stanford-Binet 5 descriptor tables summarised in our guides to WAIS-IV and WAIS-5 scores, WISC-V scores and Stanford-Binet 5 scores. Each guide below takes one question further:
- IQ classification: the named categories (Average, Superior, Very Superior and the rest) and how each test labels them.
- IQ test range: the lowest and highest scores a test can report, and the percentile of every score from 85 to 145.
- IQ scale by age: which test fits each age, and why the average stays 100 at every age.
- IQ level chart: the same bands on a single chart.
Ready to test your own cognitive skills? Take yourIQ Test here
Keep reading
All articles → Scores & Scales
IQ Classifications
IQ classification sorts scores into named bands, and the names depend on the test: Average is 90 to 109 on the Wechsler scales, but 130 and above is Very Superior on one test and Extremely High on another. See the labels side by side, where they came from and what they do not mean.
 Scores & Scales
IQ Score Ranges Explained: What Your IQ Number Really Means
The range of an IQ test is the span of scores it can report: about 40 to 160 for the major individually given tests. See the range by test, the percentile and band for every score from 85 to 145, why online tests report numbers outside the range and how far a score can move between sittings.
 Scores & Scales
What Does an IQ of 145 Mean?
An IQ of 145 is three standard deviations above average: the 99.87th percentile, roughly 1 person in 741. It is where the Stanford-Binet 5 changes its label to very gifted, but on the Cattell scale the same printed number is only the 97th percentile. See what 145 means, how rare it is and how far to trust one score.