IQ Metrics
IIF Certified Assessment Start IQ Test
IIF Certified Assessment

Gifted Cutoff Scores

Scores & Scales

Gifted Cutoff Scores: Why a Single Number Misses Children

Most gifted programmes draw their line at an IQ of 130. The number is a statistical convention rather than a boundary in nature, and three well-documented features of how the score is produced and used mean a strict cutoff reliably excludes children who belong on the other side of it.
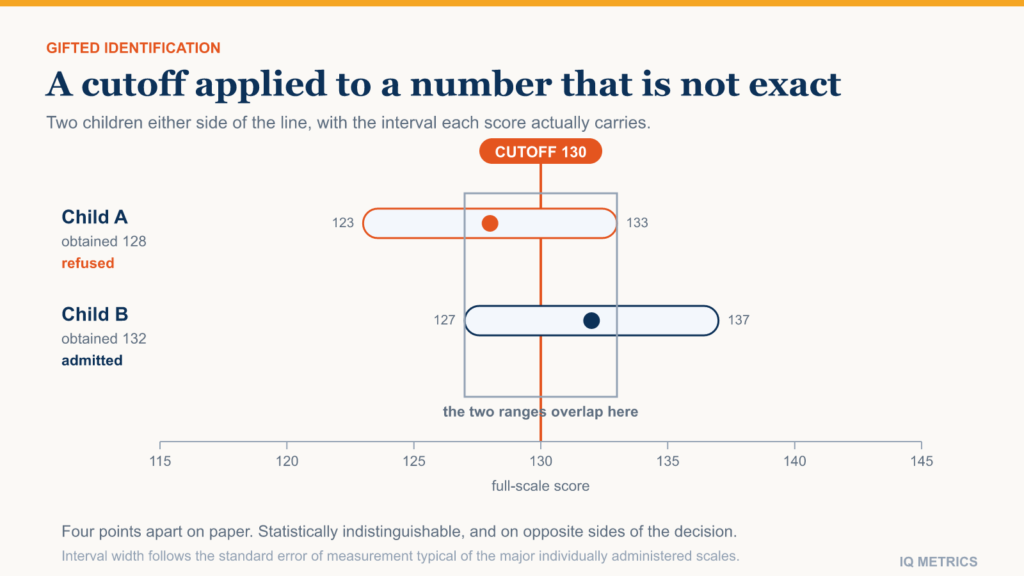
Diagram showing a confidence interval straddling the gifted cutoff of 130, illustrating how two children with different obtained scores can have overlapping true-score ranges

An IQ of 130 is the usual entry requirement for a gifted programme, and it is a convention, not a discovery. It marks two standard deviations above the mean on the scales most tests use, which places it at roughly the 98th percentile. Nothing changes at that point in the distribution. There is no cognitive category boundary there; there is a round number chosen because it is convenient.

That would matter less if the number the cutoff is applied to were exact. It is not, and the gap between an obtained score and the quantity it estimates is large enough to change the answer for a great many children. Three separate features of the process compound: measurement error, the choice of comparison group, and who gets tested in the first place.

Where 130 comes from

Modern tests are scored so that the population mean is 100 and the standard deviation is 15. Two standard deviations up is 130, which leaves about 2.3 per cent of the population above it. That is the entire derivation. The choice of two standard deviations mirrors the convention on the other side of the distribution, where a similar cutoff has historically been used in defining intellectual disability.

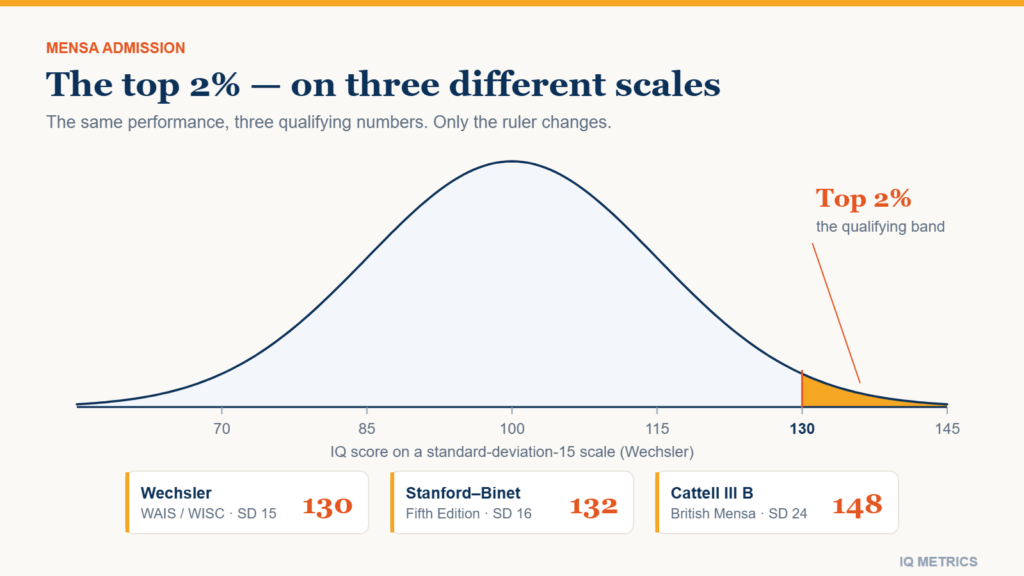
Because it is a percentile in disguise, the same label means different things on different instruments. A test standardised with a standard deviation of 16 rather than 15 puts the same percentile at a different number, and older scales computed scores in ways that do not map cleanly onto percentiles at all. Comparing a reported 132 from one instrument with a 129 from another is not a meaningful comparison — the underlying scales differ, as IQ classifications sets out.

The measurement error nobody applies

Every well-constructed test reports a standard error of measurement, and every properly written report expresses the result as an interval rather than a point. On the major individually administered scales, the ninety-five per cent interval around a full-scale score is usually about five points either side.

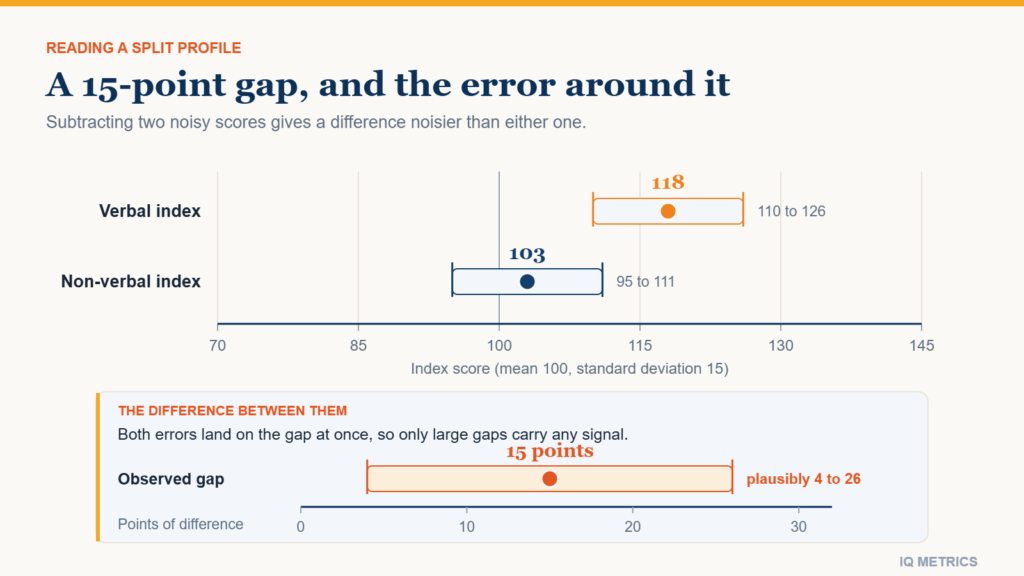
Work through what that does to a cutoff. A child who obtains 128 has a plausible range running from roughly 123 to 133. A child who obtains 132 has a range from roughly 127 to 137. Those ranges overlap across most of their width. The two children are not meaningfully different on the thing the test estimates, and yet a strict cutoff admits one and refuses the other.

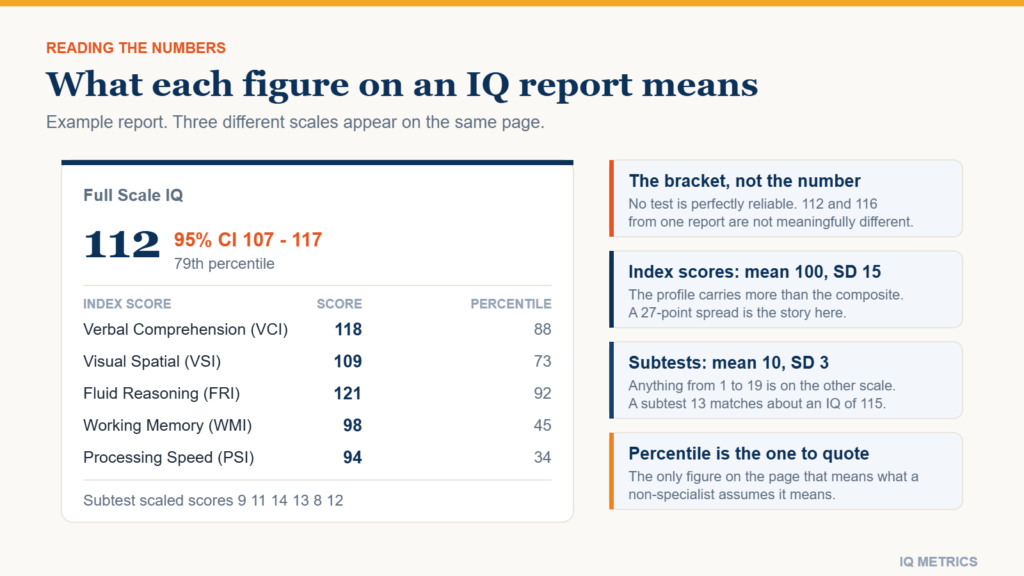
The same arithmetic explains why retesting produces so many reversals. A child who scores 127 in March and 133 in October has not become more able; a second draw from the same distribution came out differently, which is what the interval was warning about. Reading an interval correctly is the single most useful skill for anyone handling one of these reports, and it is covered in how to read an IQ test report.
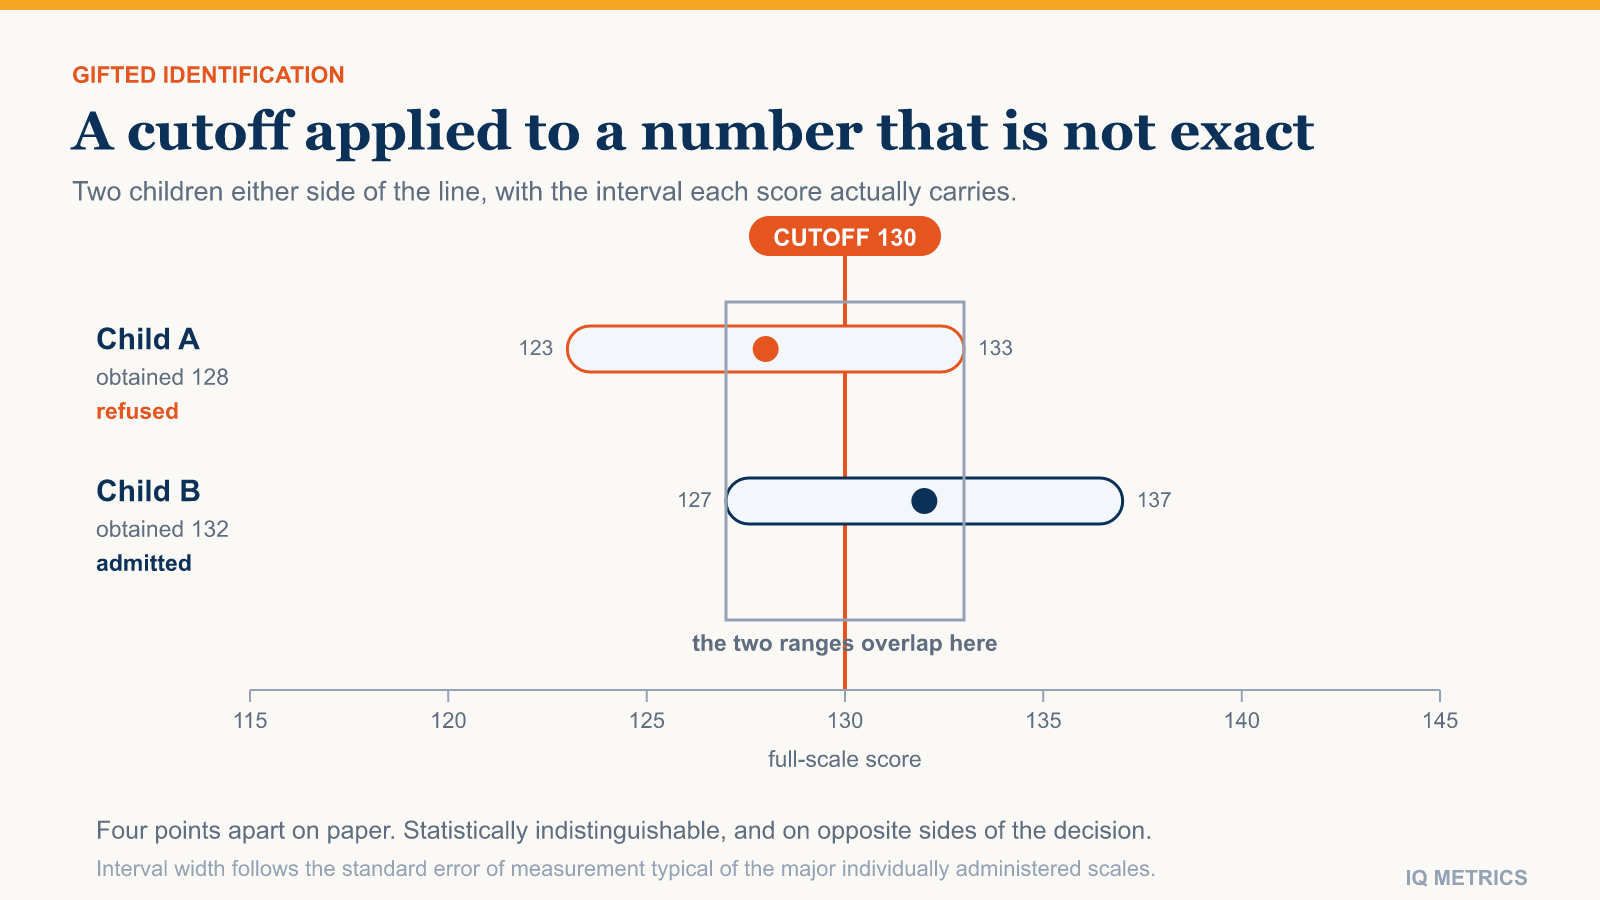
Diagram showing a confidence interval straddling the gifted cutoff of 130, illustrating how two children with different obtained scores can have overlapping true-score ranges

National norms against local norms

A standard score compares a child to a nationally representative sample. For deciding whether that child needs a different level of instruction than their classmates are getting, the relevant comparison is often the classmates.

The two diverge sharply in schools whose intake is not representative. In a high-achieving school, a large fraction of pupils may clear a national cutoff, so the cutoff stops discriminating and the programme becomes oversubscribed. In a school serving a disadvantaged catchment, almost nobody clears it, so a child who is dramatically ahead of everyone around them and plainly under-challenged is not identified — the label is reporting the catchment rather than the child.

Local norms address this by ranking within the school. They are not a softer standard; they answer a different and more relevant question, namely whether this child is being taught at the right level given the class they are actually in. The two criteria are best used together.

Your own number

Where would your own score land?

Take the IIF-certified assessment and get your score with the scale it was measured on, the percentile it corresponds to and the confidence range around it — the three figures most online tests leave out.

Find your IQ score now!

Secure & encryptedInstant results10–20 minutes

The bigger leak: who gets tested at all

Measurement error and norm choice both assume a test happened. In many systems, identification begins with a nomination from a teacher or a parent, and only nominated children are assessed. Every child never nominated is outside the process before any cutoff is applied.

Research on districts that switched from referral-based identification to universal screening — testing every child in a given year group rather than waiting for a nomination — has found substantial increases in the number of children identified from groups that were previously underrepresented, including children from low-income households and those whose first language is not the language of instruction. The children were there; the referral step was not finding them.

This is the largest of the three effects and the easiest to fix, and it is worth being precise about what it shows. It is not a claim that the test was biased against those children. It is a claim that the step before the test decided who would be measured, and that step was not neutral. The instructions given around an assessment can matter as much as the assessment, a theme that also runs through stereotype threat.

The children a cutoff is worst at finding

Two groups are missed so consistently that the pattern is a known feature of the system rather than an accident of any one district.

The first is children whose ability and difficulty coexist — a strong reasoner who is also dyslexic, has attention difficulties, or is autistic. A full-scale score is an average across indexes, and averaging a very high reasoning index with a much lower processing speed or working memory index produces a middling composite that describes neither. The composite is the number the cutoff reads, so the child is refused on the strength of a figure that no clinician would treat as meaningful. Where the index scores are far apart, the full-scale figure should be set aside and the profile read instead — ADHD, autism, dyslexia and IQ test scores covers what those profiles look like.

The second is children still acquiring the language of the test. Verbal subtests measure vocabulary and verbal reasoning in a specific language, and a child two years into learning it will score below their reasoning ability on those subtests and much closer to it on the non-verbal ones. Averaging the two produces a composite that mostly reports language exposure. The gap between the two kinds of subtest is set out in verbal and non-verbal IQ scores.

In both cases the test is doing what it was built to do. The failure is in reducing its output to one number and comparing that number to a line.

What a parent can reasonably do with this

None of this means the score is worthless. It means a single number compared against a single line is a weak decision rule built on top of a reasonable measurement.

  • Ask for the interval, not the number. A proper report gives one. If a decision rests on a point estimate a few points from the line, the interval is the relevant fact.
  • Ask what the comparison group was. National norms and local norms answer different questions, and which one was used should be stated rather than inferred.
  • Ask whether screening is universal. If identification depends on nomination, then not being nominated is not evidence about a child.
  • Treat one session as one session. Attention, sleep and rapport with the examiner all move a result, which is why the same child produces different numbers on different days.

The useful question is not whether a child crosses a line. It is whether they are being taught at a level that fits them, which a score can inform and cannot settle. For what the high end of the scale does and does not mean, see what is genius IQ level; for how age affects the interpretation of a childhood score, see what age is most accurate to take an IQ test.

Share this article

Know someone who keeps seeing these numbers quoted without the scale they were measured on? Send it to them.

Does School Raise IQ?

Research & Evidence

Does School Raise IQ? What Natural Experiments Show

Education is the environmental factor with the strongest evidence for actually raising IQ scores, and the effect is bigger than most people expect. Three independent study designs, pooled across more than 600,000 participants, point the same way. Here is the size of it, and the caveat that gets dropped.

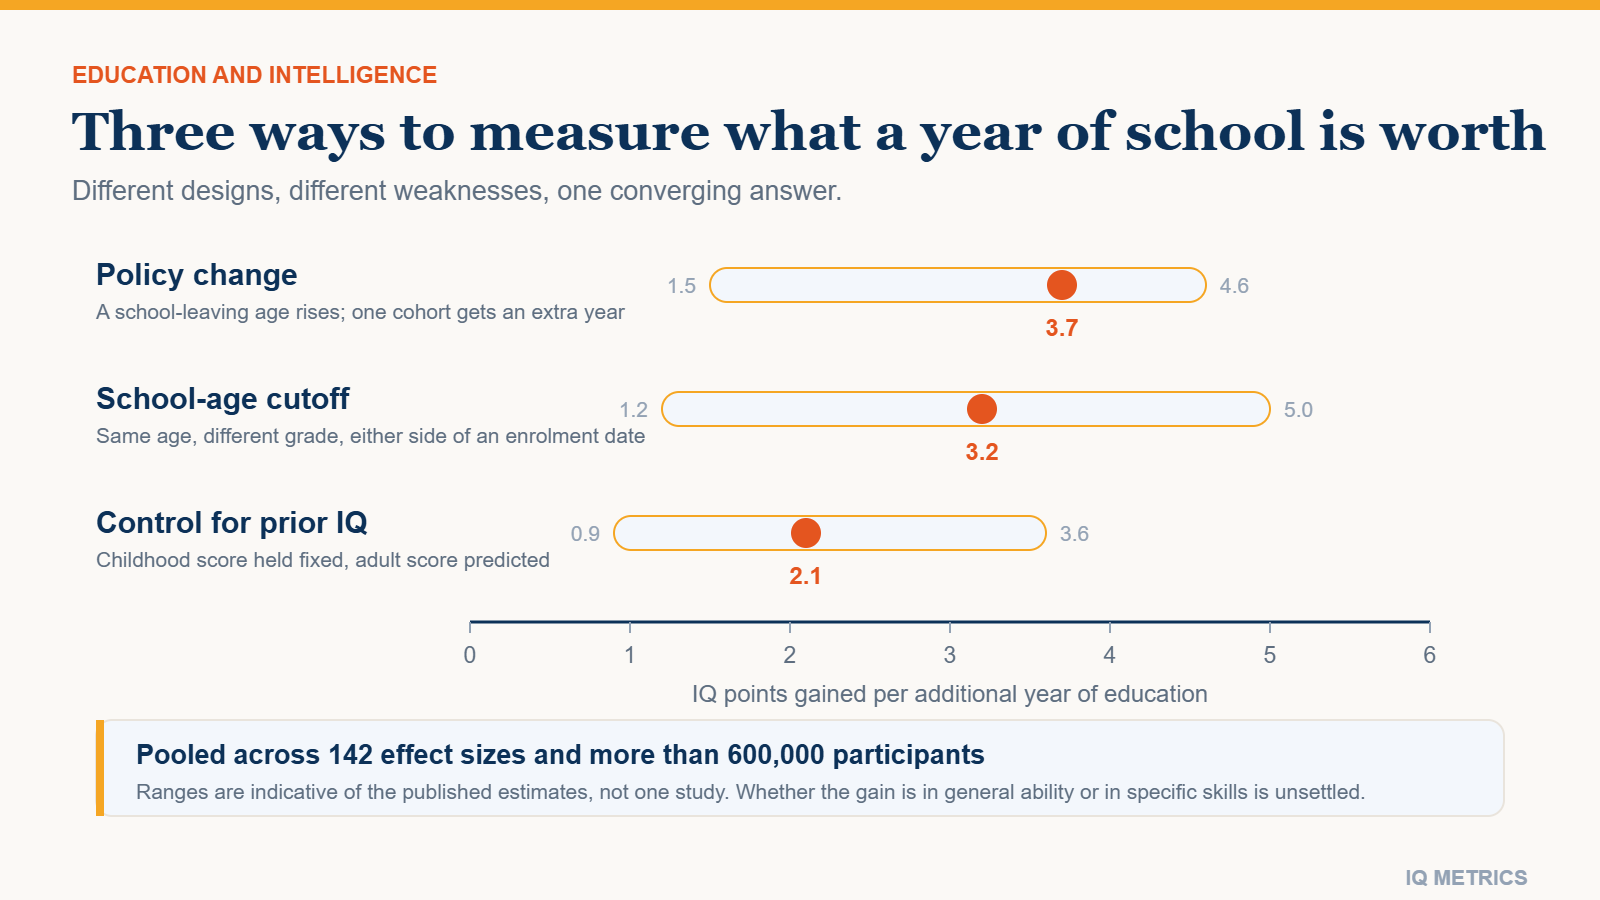
Chart showing the three natural-experiment designs used to estimate the effect of schooling on IQ (policy change, school-age cutoff and control for earlier intelligence), each yielding an estimated gain of roughly one to five IQ points per additional year of education

Yes — school raises IQ scores, and the effect is one of the largest and best-identified in the whole environmental literature. The best current estimate comes from a 2018 meta-analysis by Stuart Ritchie and Elliot Tucker-Drob, which pooled 142 effect sizes from over 600,000 participants and found that each additional year of education is associated with a gain of roughly one to five IQ points, with a central estimate of a little over three.

That is a serious number. It is comparable to the gap between the middle of the average band and its upper edge, and it appears to persist rather than fading out in the years after schooling ends. But there is a real caveat about what is being raised, and it does not get repeated nearly often enough. Both halves are below.

Why this question is hard to answer

The obvious problem is that people who stay in education longer were already scoring higher before they got there. Any raw correlation between years of schooling and adult IQ is therefore uninterpretable on its own: it could be schooling raising ability, ability raising schooling, or a third factor driving both. This is the mirror image of the question we cover in whether IQ predicts school success, and the two run in opposite directions.

What makes the modern evidence credible is that researchers stopped relying on correlations and started using natural experiments — situations where something other than the student decided how much schooling they got. Ritchie and Tucker-Drob organised the literature around three such designs:

  • Policy change. A country raises its school-leaving age, so one birth cohort gets an extra compulsory year and the cohort just before it does not. Nothing about the students themselves differs systematically.
  • School-age cutoff. Children born days either side of an enrolment cutoff are the same age when tested but have had a full extra year of school. Age is held constant while schooling varies.
  • Control for earlier intelligence. Take a measured IQ in childhood, then predict adult IQ from years of education while holding the earlier score fixed.

The three designs have completely different weaknesses. That they converge on a similar answer is the reason the finding is taken seriously.

What the natural experiments found

The compulsory schooling studies are the cleanest. A well-known analysis of a Norwegian reform, which added two years to compulsory education and rolled out across municipalities at different times, estimated a gain of roughly 3.7 IQ points per additional year on the military conscription test taken at around age 19. Because the reform arrived at different times in different places, the comparison is close to a clean experiment.

The cutoff studies attack the problem from the other end. A classic Israeli study by Cahan and Cohen compared children within the same grade who differed in age with children of the same age who differed in grade, and found that a year of schooling contributed substantially more to test performance than a year of simply getting older. Later work using the same logic in other countries reached compatible conclusions.

Chart of the three natural-experiment designs used to estimate the effect of schooling on IQ

The third design is the weakest of the three but the easiest to run at scale: measure intelligence in childhood, measure it again in adulthood, and ask whether years of education in between predict the adult score once the childhood one is held fixed. It cannot rule out every confound — motivation and family circumstances still differ — but it removes the largest one, and it produced estimates in the same broad range as the other two.

Perhaps the most striking part of the meta-analysis is that the gains did not appear to fade with age. Educational interventions in early childhood have a well-documented fadeout problem — initial score gains shrink over the following years. The schooling effect on adult IQ did not show that pattern in this analysis, which is what makes it unusual.

The caveat: raising scores is not the same as raising g

Here is the part that gets dropped in most summaries. There is good evidence that education raises performance on specific cognitive tests without raising the general factor those tests share. Ritchie, Bates and Deary examined this directly using a Scottish sample with childhood and later-life testing, and found education’s effect concentrated on individual test scores rather than on the underlying general ability that all the tests load on.

In practice that means the honest claim is narrower than the headline. More schooling reliably makes you better at the kinds of tasks tests use — vocabulary, arithmetic, structured reasoning, sustained attention under instruction. Whether it increases some deeper general capacity is genuinely unsettled, and anyone who tells you it is settled in either direction is ahead of the data. Our page on how IQ tests work explains why the distinction between a test score and the general factor matters so much here.

It is worth adding that this is not a debunking. For nearly every practical purpose — qualifications, employment, the day-to-day cognitive demands of adult life — being better at the tasks is what people actually want. The distinction matters for the theory, not usually for the decision.

Your own number

Where would your own score land?

Take the IIF-certified assessment and get your score with the scale it was measured on, the percentile it corresponds to and the confidence range around it — the three figures most online tests leave out.

Find your IQ score now!

Secure & encryptedInstant results10–20 minutes

Why early-years gains fade but schooling gains do not

There is an apparent contradiction here worth resolving, because it is the most common objection to the whole finding. Intensive early-childhood programmes — the Perry Preschool and Abecedarian projects are the famous examples — reliably produce large IQ gains that then shrink substantially within a few years of school entry. Fadeout of that kind is one of the most replicated results in the education literature. So why would schooling itself behave differently?

The most persuasive reading, argued in John Protzko’s work on fadeout, is that cognitive gains persist roughly as long as the environmental input producing them persists, and decay once it stops. On that account a two-year preschool programme followed by nothing in particular is expected to fade. A decade of compulsory schooling is not a brief intervention at all — it is a sustained one, and the measurement usually happens while it is still running or shortly after it ends.

  • Short and intense tends to produce a large gain that shrinks — the classic fadeout curve.
  • Long and sustained tends to produce a smaller annual gain that accumulates and holds.
  • The outcome measured matters. Several programmes whose IQ advantage faded still showed durable effects on attainment, employment and earnings decades later.

This is an explanation that fits the data rather than a demonstrated mechanism, and it should be held loosely. But it does mean the two literatures are not in conflict, and it points at something useful: continuity of cognitive demand looks more valuable than intensity in a short burst.

How this fits with the heritability evidence

People often read a large schooling effect as evidence against a genetic contribution to intelligence, or the reverse. Neither follows. Heritability is a statistic about the sources of variation in a particular population at a particular time; it places no ceiling on how much an environmental change can move the average. Our article on whether IQ is genetic works through why a high heritability estimate and a large schooling effect are entirely compatible.

The clearest illustration is historical. Average scores rose substantially across the twentieth century in dozens of countries — far too fast for genetic change to be involved — over exactly the period in which mass secondary education spread. Schooling is not the only candidate explanation for that rise, but it is among the strongest.

What this means for you

  • If you are still studying: the effect is real and the evidence is unusually good. Staying in education longer is one of very few things with credible causal support behind it.
  • If you are past school age: the same logic suggests sustained, structured cognitive demand matters more than brief training. The evidence for short puzzle-app regimes is much weaker, which is what our page on improving your IQ covers.
  • If you are interpreting a score: a test measures you as you are now, education included. That is a feature. See how to read an IQ test report for what each number on a report actually represents.

If you want a current benchmark before drawing any conclusions, our free online IQ test scores against age-adjusted norms and takes about twenty minutes. The result will reflect everything that got you here — genetics, health, and quite a lot of schooling.

Share this article

Know someone who keeps seeing these numbers quoted without the scale they were measured on? Send it to them.

Does IQ Predict School Success?

Research & Evidence

Does IQ Predict School Success? What Fifty Years of Data Show

IQ predicts school achievement better than any other single measure psychologists have found, and still leaves roughly three-quarters of the variation unexplained. Both halves of that sentence get ignored by somebody. Here are the actual correlations, what they mean for one child, and what accounts for the rest.

Chart showing that a correlation of 0.5 between IQ and school achievement accounts for about 25 per cent of the variation, with the remaining 75 per cent attributed to prior knowledge, conscientiousness, motivation, teaching quality and circumstance

IQ predicts school success better than any other single measure psychologists have found, and it still leaves most of the variation unexplained. Correlations between cognitive ability scores and school achievement usually land around 0.5, sometimes as high as 0.7 for standardised achievement tests in younger samples. That is a strong result by the standards of social science. It also means roughly three-quarters of the differences between children are about something else.

Almost every argument about testing in schools comes from taking one half of that sentence and dropping the other. Advocates quote the strength of the correlation to justify selecting children by it; critics quote the unexplained remainder to argue the measure is worthless. Both are reading a real number as though it answered a question it does not address.

What a correlation of 0.5 actually means

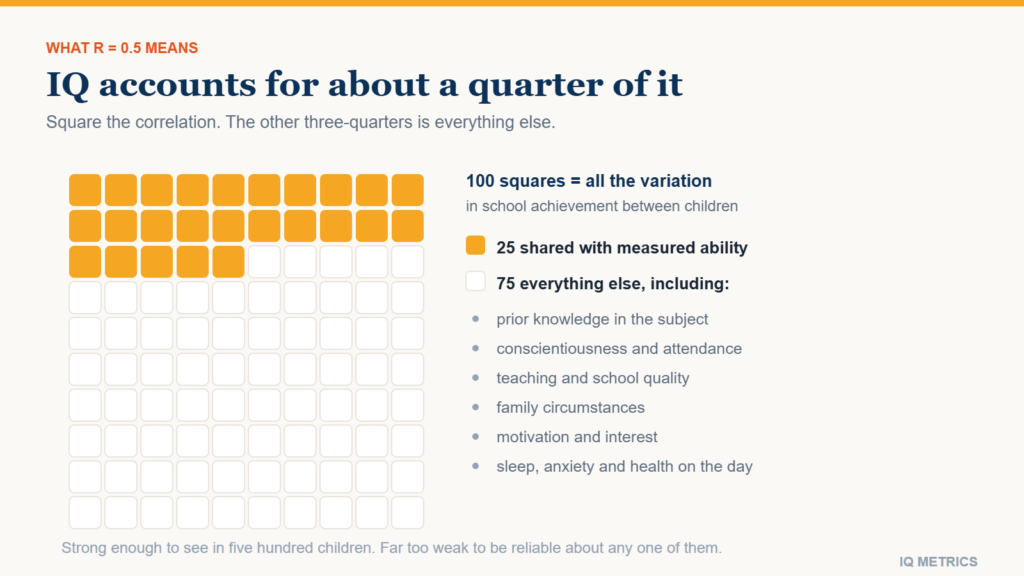
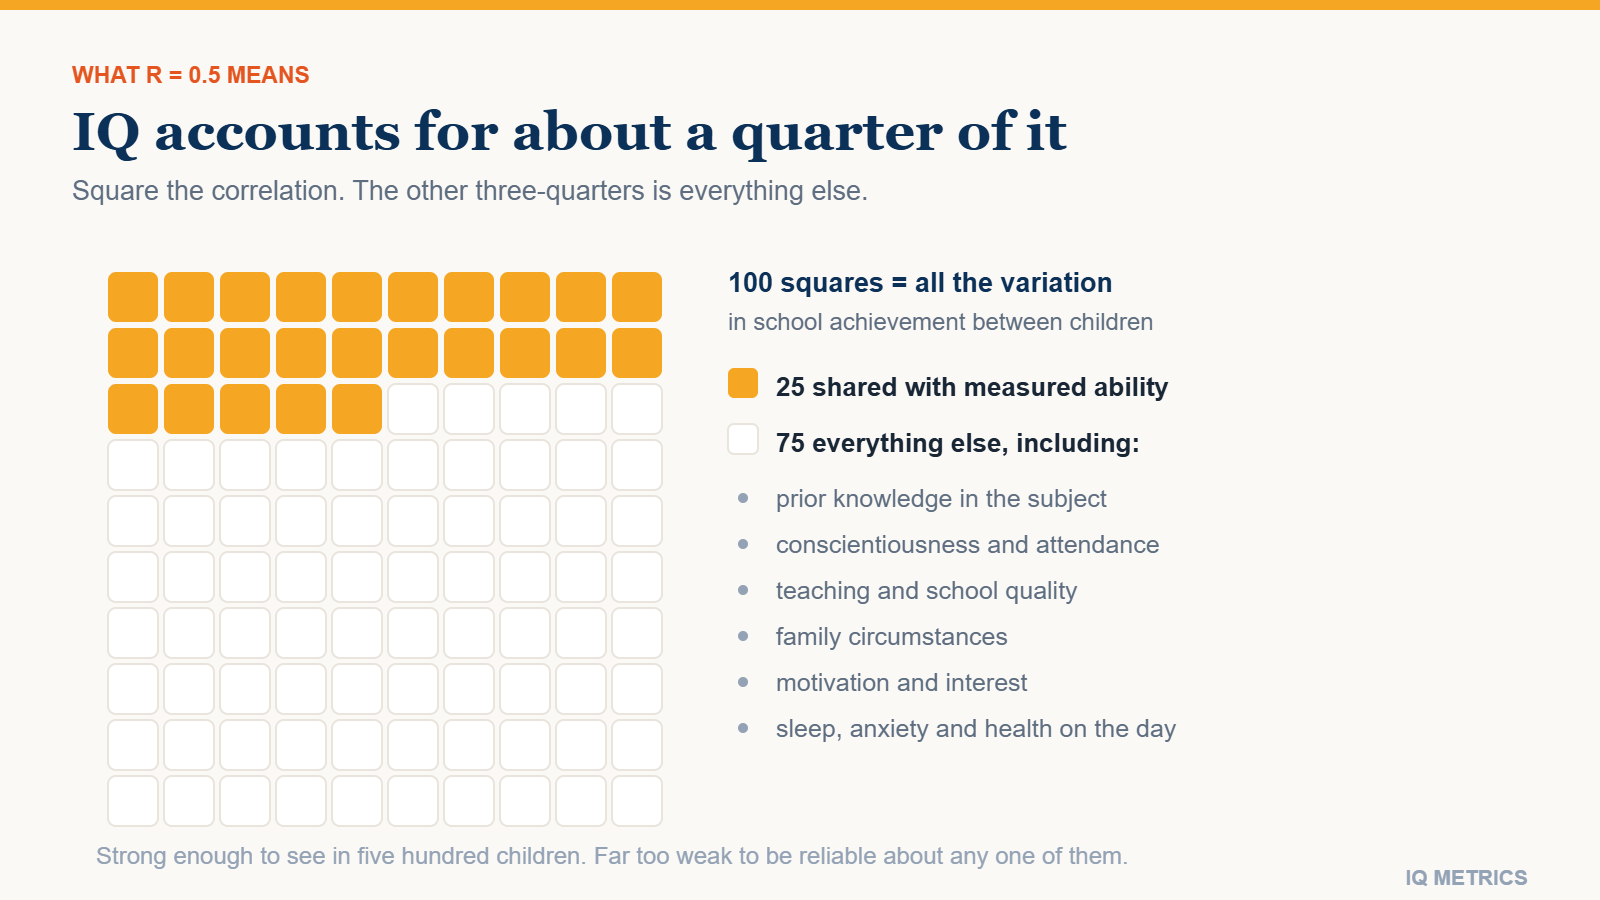
Square it. A correlation of 0.5 corresponds to about 25 per cent of the variance in the outcome being statistically associated with the predictor. Three-quarters is not.

Concretely: among children with the same IQ score, school achievement still varies enormously. The relationship is strong enough to be visible in a group of five hundred and far too weak to be reliable about any one of them. This is the single most common misreading of the literature — treating a solid group-level correlation as an individual-level forecast.

Chart showing that a correlation of 0.5 between IQ and school achievement accounts for about 25 per cent of the variation, with the remaining 75 per cent attributed to prior knowledge, conscientiousness, motivation, teaching quality and circumstance

The numbers, outcome by outcome

The correlation is not one figure. It depends heavily on what is being predicted.

  • Standardised achievement tests: about 0.5 to 0.7. The strongest relationship, and unsurprising — achievement tests and ability tests share format, timing and reasoning demands.
  • School grades: about 0.4 to 0.5. Consistently lower, for reasons worth a section of their own.
  • Years of education completed: around 0.5. Reasonably strong, but heavily entangled with family circumstances.
  • Performance within a selective university: weak. Once a group has been filtered on ability, the remaining range is narrow and the correlation shrinks accordingly.

Age matters too, and in a direction that surprises people. The correlation between measured ability and achievement tends to be strongest in the primary years and to weaken through secondary school and beyond. Part of that is restriction of range as cohorts get filtered; part is that accumulated subject knowledge, study habit and choice of subject increasingly dominate as the material gets more specialised. A reasoning test predicts best when there is least to have already learned.

That last point is restriction of range, and it explains a great deal of apparently contradictory research. A predictor always looks weaker inside an already-selected group. The same effect appears when cognitive tests are used in hiring, where the candidate pool has usually been screened already.

Why grades track IQ less closely than test scores

A grade is not a measurement of what a student knows. It is a composite of what they know, whether they handed it in, whether they attended, how they behaved, and a teacher’s judgment of all of that.

The best-known study on this point followed eighth-graders and found that a measure of self-discipline outpredicted IQ for report card grades by a substantial margin — while IQ remained the better predictor of standardised achievement test scores in the same children. Both findings are in the same paper, and quoting either one alone misrepresents it. Conscientiousness wins where sustained daily compliance is measured; ability wins where a single unfamiliar reasoning task is measured.

What accounts for the other three-quarters

  • Prior knowledge. The strongest predictor of learning something new is usually how much of the surrounding subject you already know.
  • Conscientiousness and self-discipline. Homework completion, attendance, deadline behaviour.
  • Teaching and school quality. Large effects, unevenly distributed.
  • Family circumstances. Books, quiet space, illness, stability, adult time.
  • Motivation and interest. Also partly a consequence of earlier success, which makes the causal arrows circular.
  • Test conditions on the day. Sleep, anxiety and illness all move scores, as the evidence on test anxiety shows.

A word on grit specifically, since it is often offered as the answer. Meta-analytic work suggests grit is largely a relabelling of conscientiousness and adds modest incremental prediction of academic performance beyond it. The broader point survives; the specific construct is weaker than its popularity implies.

Your own number

Where would your own score land?

Take the IIF-certified assessment and get your score with the scale it was measured on, the percentile it corresponds to and the confidence range around it — the three figures most online tests leave out.

Find your IQ score now!

Secure & encryptedInstant results10–20 minutes

The confound that will not go away

Socioeconomic status correlates with measured ability and with school achievement independently, which makes every simple comparison ambiguous. A family with more resources supplies more books, quieter study space, better nutrition, more adult conversation, less disruption from moving house or illness, and more experience of the conventions a test is written in. All of that raises the score and the achievement at once.

Studies control for it statistically, and controlling is not the same as removing it. The variables available in a dataset — parental income, parental education, an area deprivation index — are crude stand-ins for a diffuse advantage, so residual confounding is the norm rather than the exception. Treat any estimate of the ability-achievement link as an upper bound on the causal contribution of ability, not a measurement of it.

There is one finding worth flagging because it is frequently over-read in both directions: several studies report that the heritability of cognitive ability appears lower in more deprived environments, which would imply that circumstance constrains what ability can express. The result has replicated in some samples and failed to in others, and it should be held loosely. The wider evidence on inheritance is set out in what twin studies actually show.

Causation runs both ways

It is tempting to read all this as ability causing achievement. The arrow is not one-directional.

Natural experiments exploiting changes in compulsory schooling laws find that additional years of education raise IQ scores, with estimates commonly in the range of one to five points per year. Schooling does not merely reveal ability; it partly builds the thing the test measures. That is consistent with the twentieth century’s rising scores described in why IQ norms expire, and with the careful account of what can and cannot be changed in whether you can improve your IQ. It also sits alongside the genetic evidence rather than against it: heritability describes variation in a population under given conditions, and says nothing about how much a score would move if the conditions changed.

The practical consequence is that a low score in a child who has missed a great deal of school is not a stable trait measurement. It is a reading taken partly on the schooling. Repeating the assessment after a period of consistent attendance is not redundant — it is the only way to separate the two.

What this means for one child

Four things follow, and they are the practical payoff of everything above.

  • A single score is a snapshot with an error band. Childhood scores are less stable than adult ones, as how scores change over time sets out.
  • Extreme scores drift toward the average on retesting, for statistical reasons rather than psychological ones — regression to the mean is the mechanism.
  • A test taken in a second language, or under an unfamiliar format, measures partly those things — the practical upshot of cultural bias in IQ tests.
  • Predicting a group is not forecasting a person. A 25 per cent variance share is a headwind or a tailwind, not a destination.

What follows for schools

The prediction is good enough to be useful for allocating support and poor enough to be dangerous for allocating opportunity. Those two uses look similar and are not. Using a score to decide which children get extra reading help is a low-cost decision that is easily reversed if wrong. Using the same score to decide which children enter an academic track at eleven is a high-cost decision that is difficult to reverse and that compounds over years.

The historical case against selection by test at a fixed age was built on exactly this asymmetry rather than on the tests being meaningless, and how testing has been used in education and employment traces where that argument went.

The defensible summary

Cognitive ability is a real and useful predictor of school achievement, the best single one available, and a poor basis for deciding what any individual child will do. Those statements are consistent, and holding all three at once is the whole skill.

If you want a score read the way this article argues it should be — with its scale, its percentile and its confidence range stated rather than a bare number — that is what our IQ test reports, and the version for children is normed against age-matched peers rather than adults.

Share this article

Know someone who keeps seeing these numbers quoted without the scale they were measured on? Send it to them.

ADHD, Autism and Dyslexia in IQ Testing

Taking a Test

How ADHD, Autism and Dyslexia Change What an IQ Test Measures

A test score is a measurement, and a measurement can be biased by the conditions under which it is taken. ADHD, autism and dyslexia each depress performance on particular kinds of item without lowering the reasoning underneath. Here is what actually interferes, condition by condition, and what to do next.

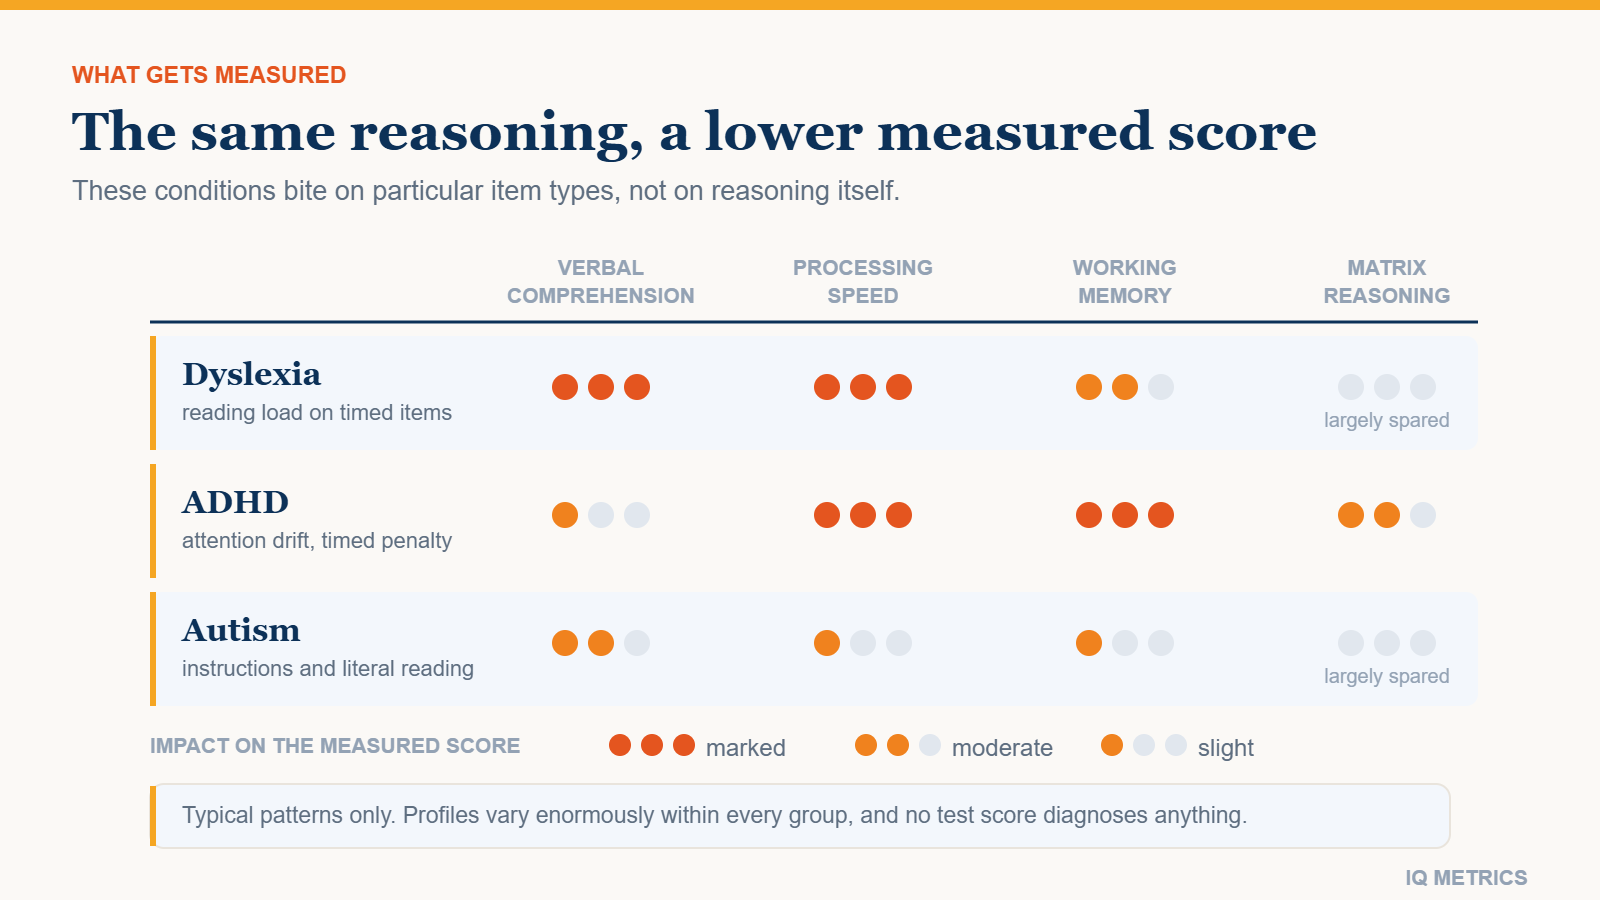
Grid rating how far dyslexia, ADHD and autism affect four IQ test domains: verbal comprehension, processing speed, working memory and matrix reasoning, which is largely spared

If you have ADHD, autism or dyslexia, a score from a timed online test is not meaningless, but for many people it reads lower than their reasoning does. ADHD and IQ test scores interact through the format rather than through intelligence: attention, reading load and the clock all sit between your thinking and the number at the end. What follows names the mechanism for each condition, and what to do about it.

This site publishes tests and explains scores; it has no clinical standing, and nothing here is diagnosis or medical advice. No IQ score, and least of all an unproctored online one, can indicate or rule out ADHD, autism or dyslexia. A qualified assessor is the only route to that answer.

A Depressed Score Is Not a Lower Ability

Much of what is written about neurodevelopmental conditions and testing quietly folds two different claims into one. The first is that measured composites in these groups often come out lower than in comparison samples. For ADHD and dyslexia that is a reasonably consistent finding; for autism it depends heavily on which test was used and how the sample was recruited.

The second claim is that these groups reason less well. That does not follow from the first. A test score is a measurement, and any measurement can be distorted by the conditions under which it is taken. It is more precise to say the score is depressed than that the ability is lower.

A bathroom scale on a thick carpet reads wrong; the reading changed, the weight did not. Much of what these three conditions do to a test result is carpet.

Ordinary test-day variables work the same way; the same person can land several points apart across a fortnight. Our longer piece on the factors that affect IQ test results covers sleep, anxiety, caffeine and practice. The difference is that these three conditions are stable features of how you process information, not the state you turned up in.

Where the Interference Actually Lands

A modern battery is not one thing. It samples several fairly distinct abilities and averages them into a single composite, and interference rarely hits all of them equally. It lands hard on one or two, and the composite carries the damage without saying so.

  • Verbal comprehension – vocabulary, similarities, general knowledge; all of it delivered in written language.
  • Fluid reasoning – matrices and number series, the part closest to raw pattern-finding.
  • Working memory – holding material in mind and manipulating it while you use it.
  • Processing speed – how quickly you get through easy items, not how hard the items are.
Grid rating how far dyslexia, ADHD and autism affect four IQ test domains: verbal comprehension, processing speed, working memory and matrix reasoning, which is largely spared

This is exactly why a profile beats a composite, and why the index-by-index breakdown produced by professionally administered tests is worth far more to a reader in this position than the headline figure.

Dyslexia: The Reading Load Hidden Inside the Test

Dyslexia is a difficulty with accurate or fluent word recognition, decoding and spelling, neurobiological in origin and not explained by a lack of instruction. On a test it lands in two predictable places. Verbal comprehension items have to be read, and so do the instructions and the answer options.

Processing-speed items are trivially easy in content and hard to finish. On a professional battery they use symbols rather than words, and are still often lower in dyslexic profiles because naming things quickly is part of what they measure. On an online test the speeded items are usually words and sentences, which puts the reading load back on top of the clock.

Fluid reasoning typically holds. A dyslexic reader who grinds through a vocabulary section will often complete matrix items at roughly the level the rest of their profile predicts, because a matrix does not have to be read. The composite then averages one fair estimate with one depressed estimate and understates the reasoning.

How large that gap gets varies from person to person, and a gap is not automatically meaningful on its own. The companion piece on verbal and non-verbal score splits covers when a difference between two indexes is big enough to interpret at all.

ADHD and IQ Test Scores: Inconsistency, Not a Lower Ceiling

The characteristic pattern for ADHD on a test is not uniformly weaker performance. It is variability. The same person can solve a hard matrix item in seconds and then miss three easy ones in the block that follows, and where in the session an item fell can matter more than how hard it was.

Three separate things cost points here, and they are worth keeping apart because they respond to different fixes.

  • Time pressure. A per-item or whole-test clock converts a slow start into lost items, even when the reasoning would have arrived a few seconds later.
  • Sustained-attention drift. Dozens of near-identical matrix puzzles in a row is close to a worst case: low novelty, no feedback, and wrong answers that feel exactly like right ones.
  • Working-memory load. Items that require holding several constraints at once are harder to finish when the holding itself takes effort.

That last one is worth holding apart from reasoning itself: the two are related but not interchangeable, and someone can have a genuinely low working-memory index and strong fluid reasoning at the same time. An item that loads both is limited by the weaker of the two.

Sleep and time of day move ADHD test performance, and so can where someone is in their usual routine on the day. That is another reason to treat one sitting as a single sample rather than a verdict, and to be sceptical of any score taken at the end of a long day.

Your own number

Where would your own score land?

Take the IIF-certified assessment and get your score with the scale it was measured on, the percentile it corresponds to and the confidence range around it — the three figures most online tests leave out.

Find your IQ score now!

Secure & encryptedInstant results10–20 minutes

Autism: Uneven Profiles and Confounded Instructions

There is no autistic IQ profile. Autistic people cover the entire measured range, and the variation inside the group is far larger than any average difference between it and everyone else. Anything that describes one shape of profile as typical is describing a subset and calling it a population.

One pattern does show up often enough to be worth naming: a split between verbal and perceptual performance, running in either direction. Some autistic people score markedly higher on matrix reasoning than on verbal subtests, particularly where verbal items reward conventional usage; others show the reverse.

The larger measurement problem is often the wrapper rather than the item. Instructions written loosely can be read literally and answered correctly by their own logic. Asking which one does not belong has several defensible answers, and an item lost that way costs the same as an item nobody could solve. The score cannot tell the two apart.

Conditions matter too. An unfamiliar room, harsh lighting, the social weight of being watched while you think: none of that is reasoning, and all of it can move a number.

What an Online Screener Does to These Profiles

An unproctored online test has no way to accommodate anyone. It cannot verify a diagnosis, grant extra time, offer a quiet room, read an item aloud, or notice that you stopped concentrating twenty minutes ago. It records what happened and scores it.

Format still changes the size of the problem. A timed IQ test stacks the effects above into their worst configuration: a speed penalty, no way back from a slow opening, and a hard stop that arrives whether or not you were nearly there.

If the clock is your main obstacle, the untimed classical format is a fairer instrument for you. If reading load is the obstacle, a culture-fair test built from figures rather than sentences takes most of the language out from between you and the item. Neither is a formal accommodation; each just removes one confound.

Accommodations, and Who Can Authorise Them

Formal assessment does have answers to all of this, and they are unglamorous rather than clever.

  • Extended time, commonly one and a half times the standard limit, sometimes double.
  • Scheduled breaks between subtests, or the session split across more than one day.
  • A separate quiet room, with the examiner present and nobody else.
  • Untimed administration of subtests where speed is not the ability being measured, reported alongside the standard scoring rather than in place of it.
  • Items read aloud, or answers given orally rather than written.

None of that is self-service, which is the practical point most articles skip. Accommodations are authorised by whoever owns the assessment: a qualified psychologist for a clinical evaluation, a school’s special educational needs process for a child being tested, a university disability service, or an employer’s occupational-health route at work. Each normally wants documentation first, which is one more reason a screener result cannot start the process.

If You Think Your Score Is an Underestimate

Start by treating the number as information about a sitting rather than about you. Which sections felt bad, and why? Running out of clock, losing the thread halfway through a block, and reading the same sentence four times are three different failures, each pointing at a different index dragging the composite down.

Then take the test again in a format that removes the thing you identified, and compare. Two scores with a known difference between the conditions that produced them tell you more than one score of any size, and that comparison is the closest thing to self-accommodation a free screener can offer.

If a defensible number actually matters — for a school placement, an accommodation request, an assessment — an online result will not do that job. What a free online IQ test gives you is a rough bearing and, taken twice under deliberately different conditions, a sense of how much of your score is about the format rather than your reasoning.

Share this article

Know someone who keeps seeing these numbers quoted without the scale they were measured on? Send it to them.

Professional IQ Tests

Taking a Test

Professional IQ Tests: What Psychologists Actually Use

When a psychologist measures intelligence, they reach for one of a small number of standardised instruments. This guide covers what the Wechsler scales, Stanford-Binet, Woodcock-Johnson and Raven’s Progressive Matrices each measure, who each one is for, and where an online test genuinely fits.

Comparison of the professional IQ tests psychologists use and what each measures

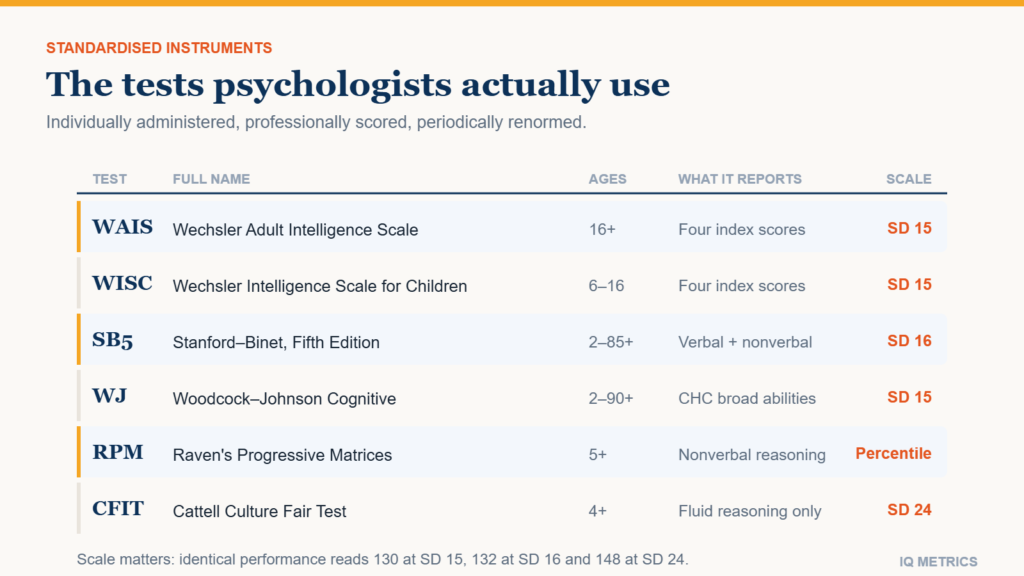
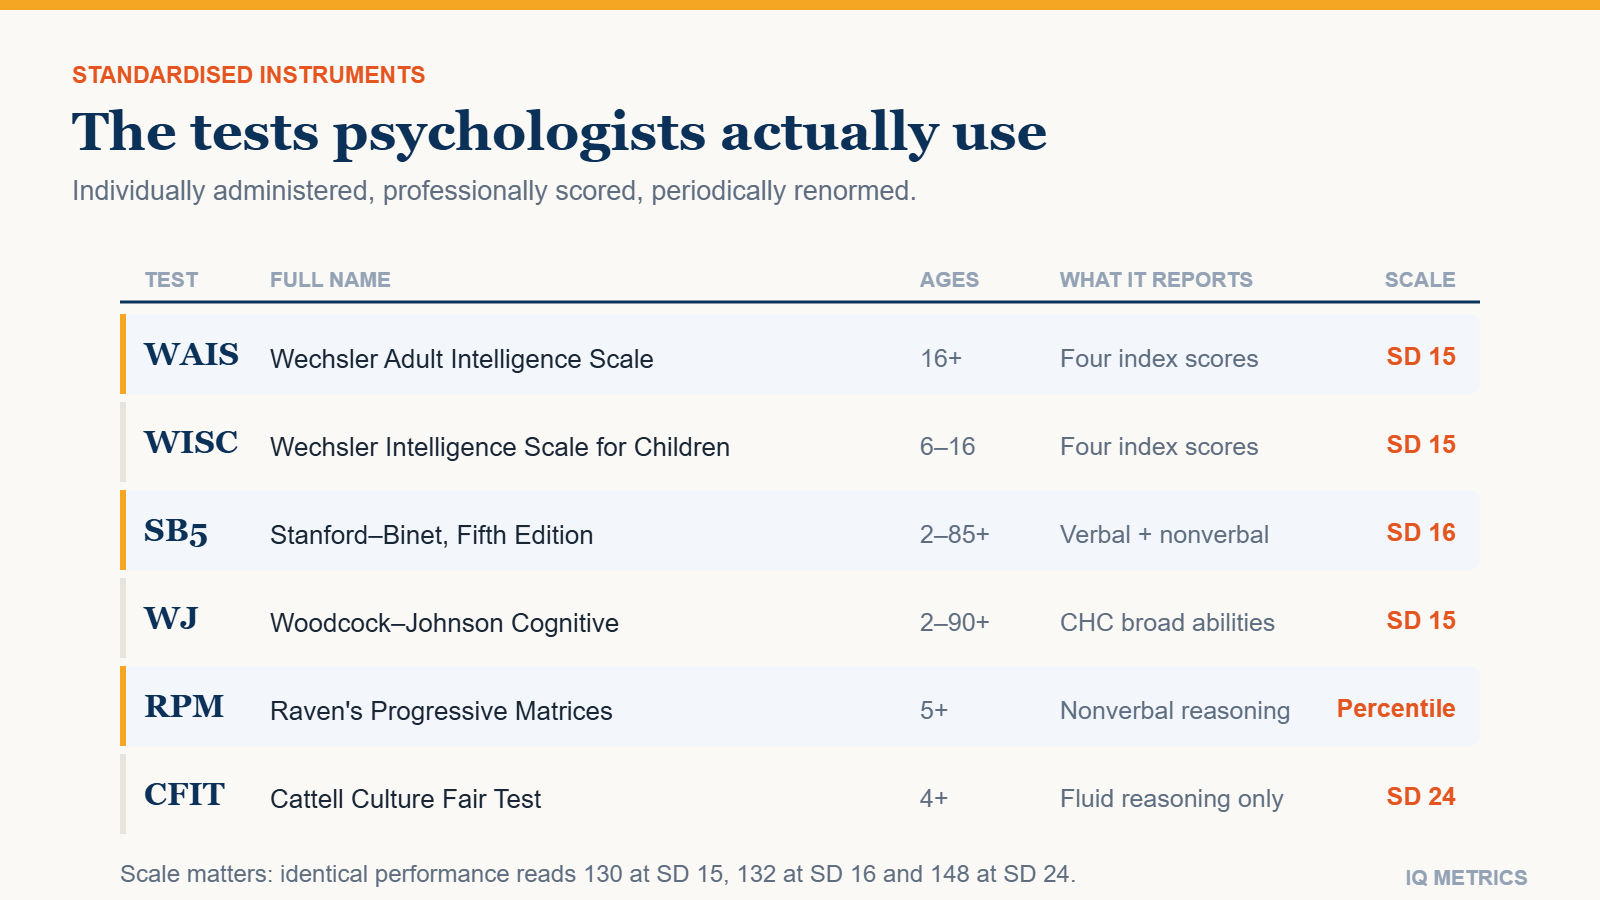
“IQ test” is a category, not a product. When a psychologist actually measures intelligence, they reach for one of a small number of standardised instruments, and those instruments differ in how they are delivered, what abilities they sample, how long they take, what age group they were normed on, and how heavily they lean on language. A score means very little until you know which of them produced it.

This guide walks through the tests professionals actually use, what each is genuinely good at, and how to work out which kind of result you are looking at. If you want to compare the shorter formats available on this site instead, the IQ tests hub covers those.

The first division: individual or group

The most important split is not verbal versus nonverbal — it is whether a trained administrator sits with you.

Individually administered tests are delivered one-to-one over roughly one to two hours. The administrator controls timing, watches how you approach each item, and can tell the difference between not knowing an answer and misunderstanding the question. These are the tests used clinically, educationally and diagnostically, and they are the reference standard for accuracy.

Group tests are delivered to many people at once, usually on paper or screen, with fixed instructions and no individual observation. They are far cheaper and faster, which is why they dominate schools, military selection and large-scale screening. They are also less precise for any single individual, because none of the observational detail survives.

The major individually administered tests

Comparison of the main types of IQ tests and what each one measures

The Wechsler scales: WAIS and WISC

The Wechsler tests are the most widely used individual intelligence tests in the world. The WAIS covers adults and older adolescents; the WISC covers school-age children; the WPPSI covers preschoolers. They are periodically revised, and each revision is renormed on a fresh standardisation sample.

Rather than producing one number, a Wechsler test reports a full-scale score built from index scores covering verbal comprehension, visual-spatial and fluid reasoning, working memory and processing speed. That structure is the real value: two people can reach the same composite by very different routes, and the profile of indexes is often more informative than the headline figure. Wechsler tests use a standard deviation of 15.

The Stanford-Binet Intelligence Scales

The Stanford-Binet is the direct descendant of the original Binet-Simon scale and the oldest continuously developed intelligence test still in use. Its current edition covers an unusually wide age span in a single instrument and assesses five factors in both verbal and nonverbal form, which makes it useful at the extremes of the range where other tests run out of items. It uses a standard deviation of 16, which is why Stanford-Binet scores sit slightly higher than Wechsler scores for identical performance — a difference our IQ score converter handles directly. The test’s long history is covered in our piece on the history of IQ testing.

The Woodcock-Johnson Tests of Cognitive Abilities

The Woodcock-Johnson is built explicitly on the Cattell-Horn-Carroll model of intelligence, which organises cognitive ability into a hierarchy of broad and narrow factors. Its distinguishing feature is that it pairs with a co-normed achievement battery, so cognitive ability and academic attainment can be compared on the same standardisation sample. That makes it a common choice in educational assessment, particularly where a learning difficulty is in question.

The Kaufman batteries

The KABC-II was designed with a specific concern in mind: reducing the influence of acquired knowledge and language on the resulting score. It offers alternative theoretical scoring models and a version that minimises verbal demands, which makes it useful for children from varied linguistic and cultural backgrounds.

Nonverbal and culture-reduced tests

Every verbal test carries an unavoidable problem: it measures language proficiency alongside reasoning. For someone tested in a second language, or from a background unlike the norm group, that confound can be large. Nonverbal tests exist to reduce it.

Raven’s Progressive Matrices

Raven’s is the best known nonverbal reasoning test and one of the purest measures of fluid intelligence available. Every item is a visual pattern with a piece missing; you choose the piece that completes the rule. There are no words, no cultural references and no general knowledge anywhere in it. It comes in progressive difficulty levels, from Coloured for young children through Standard to Advanced for high-ability adults.

The Cattell Culture Fair Intelligence Test

The CFIT was built for the same purpose using series completion, classification, matrix and conditional reasoning items, all nonverbal. It reports on a scale with a standard deviation of 24, which is why Cattell scores look dramatically higher than Wechsler ones — the ruler is wider, not the person. This is the scale British Mensa uses, as covered in our article on Mensa IQ score requirements.

TONI, UNIT and Leiter

These go further still, minimising or removing language from the instructions as well as the items. They are designed for people who cannot be validly assessed in a language-loaded format — including those with hearing impairment, speech and language disorders, or no shared language with the administrator.

One caveat applies to all of them. “Culture fair” is a design goal, not an achieved state. Familiarity with abstract diagrams, formal schooling and test-taking conventions still varies across populations, and no test has eliminated that entirely.

Your own number

Where would your own score land?

Take the IIF-certified assessment and get your score with the scale it was measured on, the percentile it corresponds to and the confidence range around it — the three figures most online tests leave out.

Find your IQ score now!

Secure & encryptedInstant results10–20 minutes

Group and screening tests

Group-administered cognitive tests are used at scale where individual assessment would be impossible: school-wide ability screening, military and occupational selection, and large research studies. They are efficient and, at the population level, statistically sound.

Their limitation is individual precision. A single low score on a group test can reflect a bad morning, an unfamiliar format, misread instructions or a missed line on an answer sheet, and nothing in the procedure would catch it. Good practice treats a group result as a flag for further assessment, never as a diagnosis. Our article on what makes an IQ test reliable covers why that distinction matters.

Where online IQ tests fit

Online tests occupy a real and legitimate niche, provided everyone is honest about what it is. An unsupervised test cannot verify who is taking it, cannot control the environment, cannot stop you looking something up and cannot prevent retakes. For that reason no online test qualifies anyone for Mensa, and none is diagnostic.

What a well-built online test can do is give you a properly normed estimate. The features that separate a serious one from a novelty quiz are concrete and checkable:

  • It states the scale its score is on, so the number can be compared with anything else.
  • It reports a percentile, not just a score, so the rank is explicit.
  • It gives a confidence range, acknowledging measurement error instead of implying false precision.
  • It is timed and consistent, so your result and someone else’s were produced under the same conditions.
  • It describes its norm group rather than leaving you to guess who you are being compared against.

Our own IQ test reports the scale, percentile and confidence range together, and the IQ tools collection lets you convert a score between scales or see where it sits on the distribution. For a fuller treatment of what separates a good online test from a bad one, see your guide to good online IQ tests.

Choosing the right kind of test

The right test depends entirely on the question you are asking.

  • For a clinical or educational decision — a diagnosis, a placement, an accommodation — only an individually administered test by a qualified professional will do.
  • For someone tested outside their first language, or from a background unlike the norm group, a nonverbal test such as Raven’s gives a fairer reading.
  • For Mensa or another high-IQ society, only an approved supervised test on their published list counts.
  • For personal curiosity, a properly normed online test that reports scale, percentile and confidence range is a reasonable and inexpensive starting point.

One last boundary is worth drawing. None of these tests measures emotional skill, and the emotional intelligence questionnaires sometimes sold alongside them are a different construct with a different evidence base — we compare the two in IQ vs EQ.

What none of them will give you is a single unarguable number that captures your intelligence. Every test samples a slice of cognitive ability through one particular method, and the score is an estimate of where that slice sits relative to other people. Knowing which slice and which method is what turns the number into information.

Share this article

Know someone who keeps seeing these numbers quoted without the scale they were measured on? Send it to them.