IIF Certified Assessment
Start IQ Test
IIF Certified Assessment
Deviation IQ is a straight-line transform of the bell curve — not an exponential or logarithmic one. The confusion comes from somewhere else: the rarity behind each score, which is sharply nonlinear.
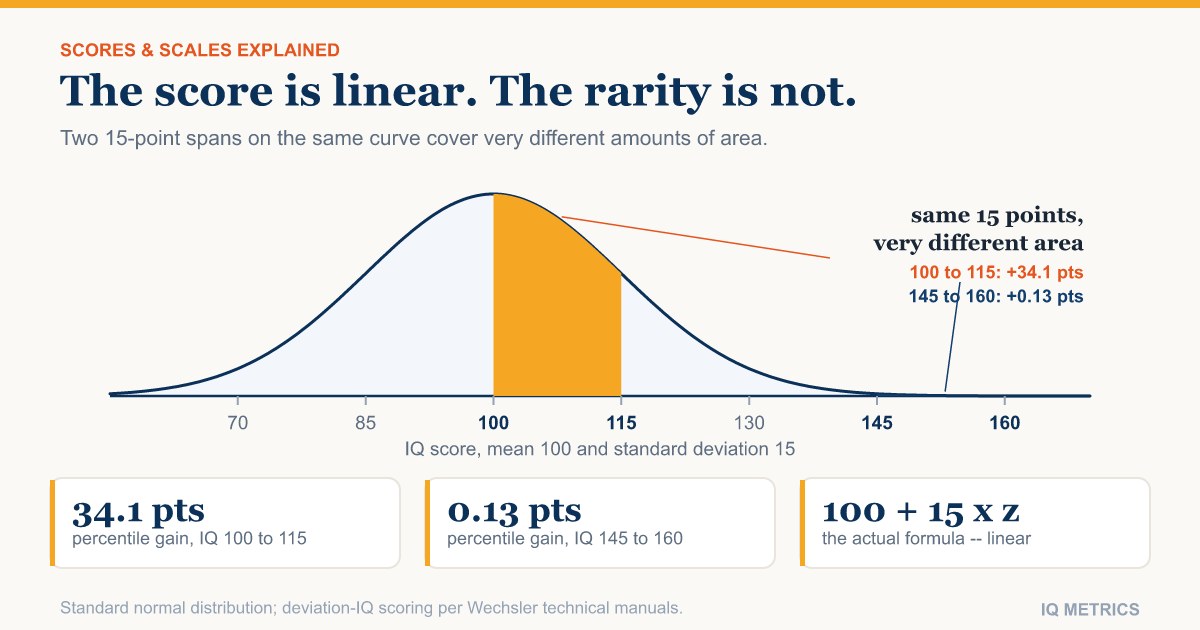
Type "is IQ linear" into a search bar and autocomplete offers you "logarithmic," "exponential," and both, in roughly that order of popularity. The instinct makes sense: a jump from 100 to 130 feels like a bigger deal than a jump from 70 to 100, and unequal-feeling jumps are usually a sign of a curved scale. The instinct is also wrong about where the curve actually is.
Every modern IQ test — the Wechsler scales, the current Stanford-Binet, and effectively every serious instrument in use today — reports what is called a deviation IQ. A deviation IQ starts by finding a person's position on a standard normal distribution, expressed as a z-score: how many standard deviations above or below the average their raw performance falls. A standard deviation is simply a fixed unit of spread, chosen so that the scores of a large reference sample cluster around it in a known, predictable pattern. The final score is then: 100 plus 15 times that z-score.
That is a linear equation. There is no exponent, no logarithm, no curve of any kind in the formula itself. A z-score of exactly 1 gives 115. A z-score of exactly 2 gives 130. A z-score of exactly 3 gives 145. Each additional standard deviation adds exactly 15 more points, every time, with no acceleration and no flattening — which is the literal definition of a linear scale.
The confusion is not baseless — it is just pointed at the wrong part of the system. What genuinely is nonlinear is percentile rank: the share of the reference population that a given score sits above. Because the bell curve is dense in the middle and thins out sharply toward the tails, an equal-sized move in IQ points buys you a wildly different amount of rarity depending on where you start.
Move from IQ 100 to IQ 115 — one standard deviation — and you jump from the 50th percentile to roughly the 84th: 34 percentile points for a 15-point move. Now make the identical 15-point move from 145 to 160, out at the far tail. You go from roughly the 99.87th percentile to roughly the 99.997th — a gain of about 0.13 percentile points for the same 15-point jump. Same distance on the score scale. A gap of over 250 times in what that distance is worth in rarity. That asymmetry is real, it is large, and it is almost certainly what people are actually noticing when they describe the scale as "feeling" exponential. Our IQ percentile calculator makes this concrete: plug in 115 and then 160 and watch how differently the percentile moves for the same 15-point step.
The same pattern shows up at gaps small enough to matter outside a research paper. Two children's school-administered scores of 98 and 106 — an 8-point gap, both close to average — sit about 21 percentile points apart. The identical 8-point gap between 138 and 146, both already rare scores, is worth less than half of one percentile point. A parent comparing those two pairs of numbers and expecting the second gap to "mean" roughly what the first one means is applying the score scale's logic to a place where only the percentile scale's logic actually applies.
The score is linear. The rarity behind it is not — and that is the part people are actually reacting to.
IQ testing did not start with deviation scoring. When Lewis Terman adapted the Binet-Simon test into the 1916 Stanford-Binet, the reported score was a ratio IQ: a child's mental age, as estimated from the test, divided by their chronological age, multiplied by 100. A ten-year-old performing like a typical twelve-year-old scored 120 under that formula. It is a different equation from deviation IQ, but it is still not a logarithm or an exponent — it is a ratio.
Ratio IQ had two real problems, and neither of them was curvature. Mental age effectively stops climbing in a meaningful way once someone reaches adulthood, so the ratio formula breaks down completely for adults — a 40-year-old does not have a sensible "mental age" the way a ten-year-old does. And the spread of scores was not constant across ages: a ratio IQ of 120 marked a different slice of the population at age eight than it did at age fourteen, which made scores hard to compare across an age range. David Wechsler's 1939 Wechsler-Bellevue scale fixed both problems by switching to deviation scoring — comparing each person only to others their own age, then converting that comparison to a fixed-spread standard score. The Stanford-Binet itself switched to deviation scoring in its 1960 revision, retiring the ratio formula it had used since 1916. One detail worth keeping in mind if you have compared old and new scores: some early deviation-scored tests used a standard deviation of 16 rather than 15, its own source of score confusion, covered in our piece on why one percentile has three different numbers depending on the standard deviation in use. A deeper look at exactly what changed in the formula itself is in our explainer on deviation IQ versus ratio IQ.
Get the mechanism right and two common mistakes disappear at once. First: do not assume a 15-point gap means the same thing wherever it falls. It means the same thing on the score scale — exactly one standard deviation, every time — but a wildly different thing in terms of rarity depending on whether you are near the middle of the distribution or out in a tail. Second: do not describe the score itself as compounding or accelerating. It does not. If something about an IQ comparison feels exponential, the feeling is accurate — you are just noticing the percentile underneath the score, not the score.
This is also why comparing two people's scores by simple subtraction works reasonably well near the middle of the distribution and gets less and less informative the further out you go. The distance in points stays constant by definition; the distance in rarity does not. Anyone reasoning carefully about a score difference needs both numbers, not just one.
Want to see your own score translated both ways — as a point value and as the percentile it actually represents? A full <a href="/iq-test/">IQ test</a> reports both, and our percentile calculator lets you check the gap between any two scores on either scale.
Find your IQ score now! →IQ is not exponential, and it is not logarithmic. It is a linear scale wrapped around a distribution that itself is not linear in what it means — and almost every version of this question turns out to be a question about the second thing, mistakenly aimed at the first.
Linear. A deviation IQ score is calculated as 100 plus 15 times a person's z-score on the bell curve, which is a straight-line formula with no exponent or logarithm in it. Each additional standard deviation adds exactly 15 points, with no acceleration.
Because percentile rank — not the IQ score itself — is nonlinear. The same 15-point gap represents a 34-percentile-point difference near the middle of the distribution (100 to 115) but only about a 0.13-percentile-point difference out in the tail (145 to 160). People are noticing the percentile behind the score, not the score itself.
Ratio IQ, used from 1916, divided a person's estimated mental age by their chronological age and multiplied by 100. It broke down for adults and its spread varied by age. Deviation IQ, introduced by Wechsler in 1939 and adopted by the Stanford-Binet in 1960, instead compares each person only to same-age peers and converts that to a fixed-spread standard score — the system every major test uses today.
Not usually. Converting the number of items answered correctly on a subtest into a scaled score typically follows the actual shape of the test's norm sample, which is rarely a straight line. That conversion happens before the final linear IQ formula (100 + 15 x z) is applied, so the finished composite score is linear even though a step underneath it is not.
Corrections: spotted an error? Email corrections@iqmetrics.org and we will update this story and note the change here.
Wechsler scales use a standard deviation of 15, older Stanford-Binet forms used 16, and the Cattell scales use 24. One standing prints as three different numbers — and one printed 140 is a one-in-260 result on one of those scales and a one-in-21 result on another.

The first IQ scores came from dividing mental age by chronological age. The formula worked reasonably well for children and produced nonsense for adults — which is exactly why every major test replaced it.
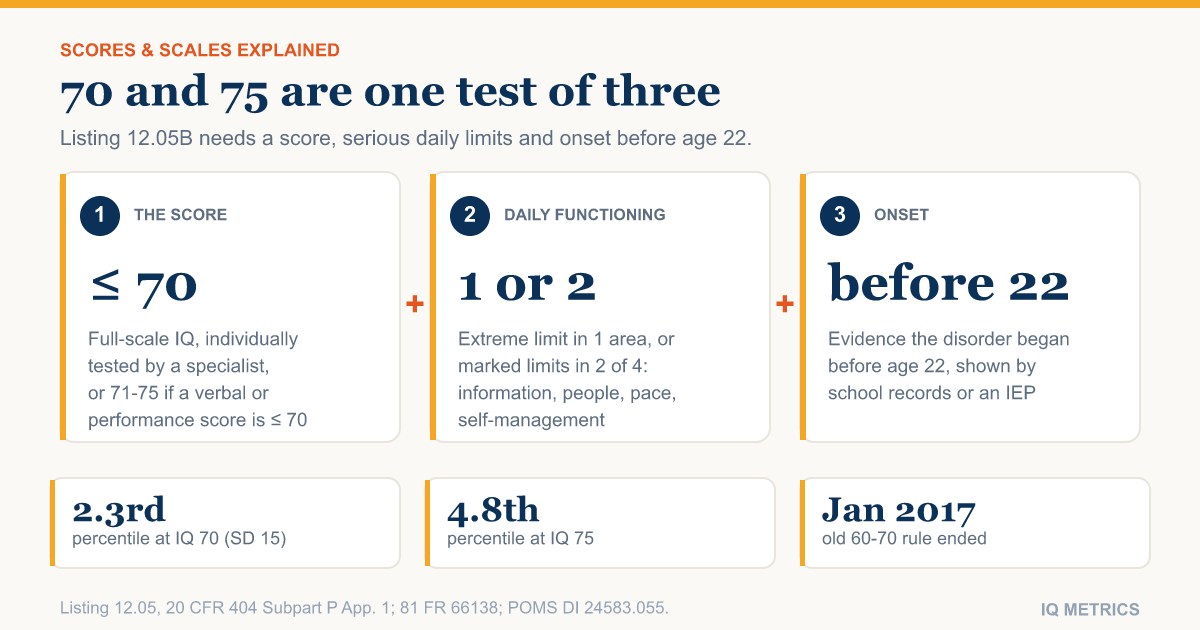
No IQ number qualifies anyone for US disability benefits on its own. Social Security writes 70 and 75 into its intellectual-disorder listing, but each sits inside a three-part test, and a rule many pages still describe was removed in 2017.
Our IIF-certified assessment reports your score with its scale, percentile and confidence range — and a breakdown of the cognitive domains behind it.
Start IQ Test →