



Average IQ by Country 2026: What South Korea's 106.97 Does and Does Not Show
South Korea leads the International IQ Test's 2026 country table at 106.97. The table's own sample counts show a quarter of the 1,212,714 test-takers came from Indonesia, that the rows do not average to the stated 100, and that scores moved with the size of each country's crowd.


What you need to know
- The International IQ Test's 2026 table ranks 137 countries from 1,212,714 people who took its online test in 2025. South Korea is first at 106.97 (26,996 takers), then China at 106.48 (229,918) and Japan at 106.30 (55,994). The site lists internet access bias among its own limitations.
- Three countries supply 51.2% of all takers: Indonesia 299,304 (24.7%, average 89.96), China 229,918 (19.0%) and Ukraine 91,242 (7.5%). The median country has 1,237 takers, and 63 of the 137 have fewer than 1,000. South Korea's 26,996 is well under one in a thousand of its residents.
- The page states a sample mean of 100 (SD 15). Weighting the 137 country averages by their takers gives 98.48; leaving out Indonesia gives 101.27. Last year's table, weighted the same way, gives 100.06. The page does not say which people the 100 refers to.
- Scores moved with the crowd. Across 125 countries with both years, the change in a country's sample size and the change in its average correlate at r = -0.40: countries whose sample shrank by more than half gained 0.92 points on average, and those whose sample grew by a quarter or more lost 1.01.
In early October 2026 outlets such as ARY News reported that South Korea had taken first place in the world's IQ rankings, with an average of 106.97. The figure comes from the International IQ Test, a website that publishes an annual table of average scores by country, updated on 1 January 2026 from people who took its test during 2025. Unusually for a viral ranking, the site prints its sample counts next to every score and a methodology section beneath the table, so the claim can be checked against the site's own numbers. We read the page on 9 October 2026 and recomputed what could be recomputed. The ranking is real as a list of averages. What it is an average of is a narrower question.
What does the 2026 table say?
The table ranks 137 countries, each with at least 100 test-takers. At the top: South Korea 106.97, China 106.48, Japan 106.30, Iran 104.80, Australia 104.45, Russia 103.78, Singapore 103.56, Mongolia 102.61, New Zealand 102.35 and Viet Nam 102.26. The United Kingdom is 14th at 101.57, the United States 18th at 101.04, Germany 38th at 99.32 and India 50th at 98.44. At the bottom are Rwanda (86.90), Timor-Leste (86.70) and Somalia (83.84). Twenty-seven countries average above 100 and 110 below it. A further 77 countries and territories had fewer than 100 takers and are listed separately, unranked.
Two details change the headline. The page rolls territories into their sovereign country following UN practice, so Hong Kong (107.73, 20,793 takers), Macao (106.32) and Taiwan (105.80, 46,281) are inside China's 106.48. Counted on their own, Hong Kong would sit above South Korea. And the "previous year" column on the same page shows China first in the 2025 edition at 107.19, with South Korea at 106.43 and Japan at 106.40. South Korea's climb to first is a gain of 0.54 points for it and a loss of 0.71 for China, not a new leap in a nation.
Who took the test?
The 137 country rows add up to exactly 1,212,714, the sample size the page states, so the counts can be used to see who the sample is. Indonesia supplied 299,304 takers, 24.7% of everyone, with an average of 89.96. China supplied 229,918 (19.0%) and Ukraine 91,242 (7.5%, average 95.66). Those three countries are 51.2% of the sample; the top five by takers, adding Japan and Germany, are 58.6%; the top ten are 68.5%. At the other end the median country has 1,237 takers, 63 of 137 have fewer than 1,000, and 43 have fewer than 500. South Korea's 26,996 is 2.2% of the sample and, with about 51 million residents, well under one in a thousand of its people.
These are people who found an online IQ test, chose to take it and finished it. The page says as much in its own list of limitations: every participant had internet access, the test is modelled on the Raven's matrices format, a nonverbal reasoning measure, and any online test should be treated as informational rather than diagnostic. It also says participation varies with local interest in IQ tests and with how search engines surface the website in each country and language. That is a description of an audience. A random sample of a nation, the kind a national survey draws, would not depend on any of it. For how a matrix test turns raw answers into a score, see our guide to Raven's matrices scores explained.
A table that moves when its audience moves is measuring the audience.
Does the table average to the 100 it says?
The page states that the sample has a mean IQ of 100 and a standard deviation of 15. If the country rows are a complete split of that sample, the average of the country averages, weighted by each country's takers, has to equal the sample mean exactly. Recomputed from the table, it does not: the weighted average of the 137 country scores is 98.48, 1.5 points below 100. The unweighted mean of the 137 scores is 96.39. Leave Indonesia out and the weighted figure is 101.27. Last year's table, for the 125 countries that have a previous-year row (1,332,521 takers), gives 100.06 under the same calculation.
We cannot say why this year's table is 1.5 points off. The page does not state whether the 100 refers to every response before its screening for repeat attempts and bots, to a different pool of people, or to a scale that was set before the final table was cut. What it does show is how much the Indonesian crowd, at 24.7% of the sample and 89.96 on average, weighs on any global figure. The FAQ answers a related question, why most countries are below 100, by pointing to population weighting: China's large population offsets the many sub-100 countries. That argument is about population, which the page does not tabulate, so it cannot be checked here. What can be checked is that the takers, not the populations, are what produced the 100.
Do scores move when the crowd moves?
The page says averages are stable: in 84.8% of countries the score shifted by less than 2 points year over year. We counted 106 of 125, which is 84.8%, and the mean absolute change is 1.07 points. Stability within 2 points sounds reassuring until it is set against the sample counts, because the changes are not random with respect to them. Across the 125 countries, the change in a country's average has a correlation of -0.40 with the change in the logarithm of its sample size (Spearman -0.39): where the crowd grew, the average tended to fall, and where it shrank, the average tended to rise.
- 38 countries whose sample shrank by more than half gained 0.92 points on average
- 35 countries whose sample stayed within 25% either way changed by +0.14
- 18 countries whose sample grew by more than 25% lost 1.01 points
- Indonesia's sample doubled (150,041 to 299,304) and its average fell 3.22 points (93.18 to 89.96)
- Viet Nam's sample fell 69% (47,671 to 14,915) and its average rose 2.14; Romania's fell 75% and rose 2.57; Argentina's fell 68% and rose 2.72
It is not a law: Japan's sample fell 62% and its average moved only 0.10. And a correlation does not say what the cause is. It is consistent with a changing mix of people, for example a country's test traffic swinging between search visitors and social-media visitors from year to year. It sits awkwardly with the idea of a fixed national quantity measured by a steady instrument. The same caution applies to norms that age on their own; our report on why IQ norms expire covers what happens when even a carefully sampled reference group is a decade old.
How precise is a rank?
Sampling error is small for big samples and large for small ones. The standard error of an average is the standard deviation divided by the square root of the sample size, so with a standard deviation of 15 it is 0.09 points for South Korea, 0.03 for China and 0.13 for the Netherlands, but 1.3 for Malta (129 takers) and 1.26 for Somalia (141). Assuming a standard deviation of 15, a 95% interval for the smallest ranked countries is therefore about plus or minus 2.5 points, about 5 points from end to end. That is wider than the 3.3 points between 20th place (Switzerland, 100.84) and 60th (Algeria, 97.53).
The top of the table is the opposite case. South Korea and China differ by 0.49 points with a standard error on the difference of about 0.10, so the gap is not noise in the sample. That is exactly the trap: a large sample makes a gap look decisive, but it measures the people who took the test more precisely, not the country better. Ranks 21 to 31 (Georgia to Thailand) sit within 0.41 points of each other, 100.35 to 99.94, and tell you nothing about order. Our IQ bell curve shows how little of the distribution a half-point shift covers, and the IQ percentile calculator turns it into a rank: a person scoring 106.97 on a mean-100, SD-15 scale is at about the 68th percentile and one scoring 106.48 at about the 67th, so the half-point gap that decides first place is worth one percentile place.
What would a fair country comparison need?
A comparison of nations needs a sampling frame that covers the whole population, one instrument given under matched conditions, norms set on the people being compared, and a fixed date. National assessments come closer, and even they measure schooling as much as reasoning; see our reading of PISA 2025 and what it does not show about IQ. The older tables that circulate as national IQs have a different problem, a patchwork of studies and estimated values, which we set out in why country IQ rankings are weaker than the charts suggest. The International IQ Test table avoids that patchwork and substitutes another weakness, a very large but self-selected crowd. Neither is a measurement of the intelligence of a country. For the same question at state level, see what average IQ by US state rests on.
- Ask how many people stand behind a number, and how they came to take the test
- Ask whether the top countries are also the biggest contributors to the sample
- Treat any gap smaller than about 2 points between small-sample countries as noise
- Check whether the year-over-year change tracks the change in sample size
- Prefer sources that publish a sampling frame, a date and a norm group
Where would your own score land?
Want a result placed on a human norm scale, with a percentile and a full report, instead of a country average? Take the IQ Metrics test and see where your score falls on the same curve used throughout this site.
Find your IQ score now! →Our IQ Metrics test reports a score and percentile against its own norm group. If you are weighing any online test, our checklist on what to check before trusting an online IQ score applies to the country tables as much as to individual results, and the page on average IQ by country explains the older figures in more detail. How far any single test can be trusted is covered in IQ test accuracy.
Common questions
Which country has the highest average IQ in 2026?
On the International IQ Test's 2026 table, South Korea is first at 106.97 from 26,996 takers, ahead of China at 106.48 and Japan at 106.30. This is an average among people who chose to take that online test in 2025, not a measurement of each nation. Hong Kong, which the table counts inside China, scores 107.73 on its own.
Is South Korea really the smartest country in the world?
The data cannot say. The table averages self-selected online test-takers: 26,996 from South Korea, well under one in a thousand residents. A national comparison needs a representative sample, one instrument under matched conditions and shared norms, and none of those exist here. The gap to China is 0.49 points.
How many people took the International IQ Test in 2025, and from where?
The page states 1,212,714 takers, and its 137 country rows sum to exactly that. Indonesia supplied 299,304 (24.7%), China 229,918 (19.0%) and Ukraine 91,242 (7.5%), together 51.2% of the sample. The median country had 1,237 takers, and 77 further countries and territories had fewer than 100 and were left unranked.
Are online country IQ rankings reliable?
They are reliable as counts of what a website recorded and unreliable as comparisons of nations. The takers are self-selected internet users, the site itself lists internet access bias as a limitation, and in the 2026 table a country's change in score tracks the change in its sample size (r = -0.40). Use them as a curiosity, not as evidence about national intelligence.
Sources for this story
- Average IQ by Country 2026 (Map and Global Ranking): country table, methodology and limitations, read 9 October 2026 — International IQ Test (international-iq-test.com)
- Smartest nation in the world 2026: Which country took the crown? (5 October 2026) — ARY News
- Infographic: ranking of countries by IQ level in 2026 (February 2026) — Vokrug Sveta
- Recomputation of sample shares, weighted means and year-over-year changes from the published table (9 October 2026) — IQ Metrics analysis
- Country IQ rankings are weaker than the charts suggest (18 August 2026) — IQ Metrics News
Corrections: spotted an error? Email corrections@iqmetrics.org and we will update this story and note the change here.
Related stories
All news →Country IQ Rankings Are Weaker Than the Charts Suggest
The tables that circulate as national IQ figures come from one compilation built out of whatever studies existed, in whatever years, on whatever samples. Several of the numbers were estimated rather than measured.
Online IQ Scores Vary Widely. The Norm Sample Explains Why
Two people can perform identically on two different online tests and walk away with scores twenty points apart. The scale, the comparison group and the margin of error are what separate an assessment from a quiz.
PISA 2025 Results: Record Lows, and What They Do Not Show About IQ
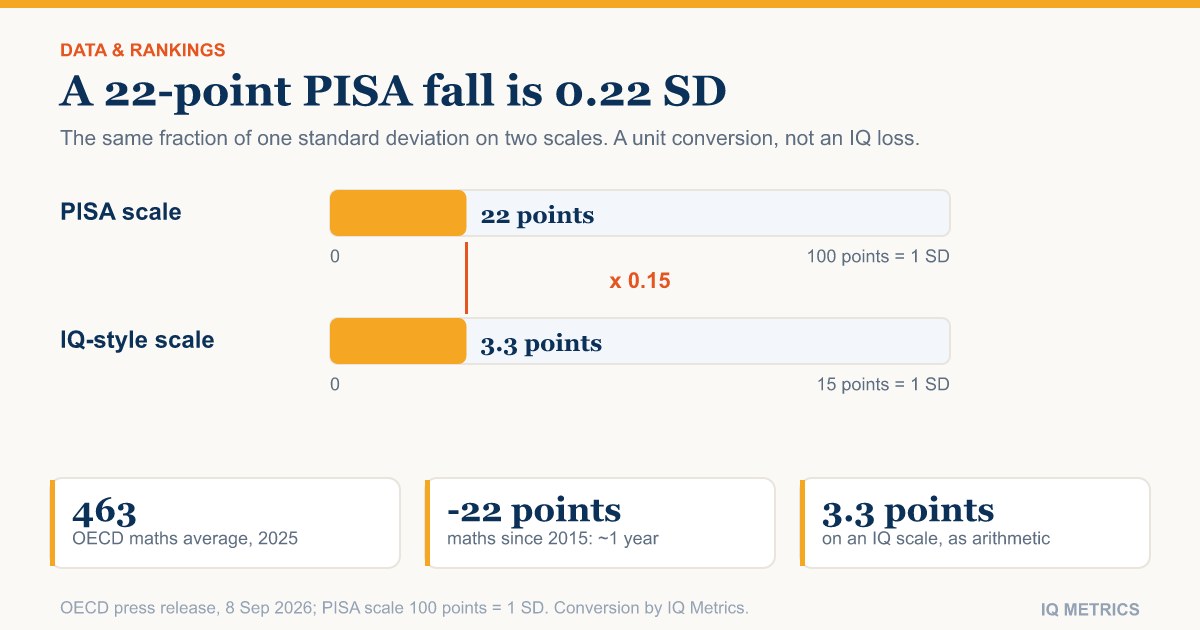
The OECD average fell to 463 in mathematics and 461 in reading, the lowest it has recorded. A 22-point maths fall works out at about three points on an IQ-style scale, but that is a unit conversion, not a measurement of anyone's intelligence.
Read the research.
Then find your own number.
Our IIF-certified assessment reports your score with its scale, percentile and confidence range — and a breakdown of the cognitive domains behind it.
Start IQ Test →