



SAT Scores for the Class of 2026: What the 1045 Average Means
The College Board reports a mean of 1045 for 1,954,833 test takers, 16 points up on last year. The median is 1030, and two groups of takers sit 270 points apart, so the headline average reflects who sits the test as well as how well they do.

What you need to know
- The College Board's 2026 annual report covers 1,954,833 students in the class of 2026, 2.5% fewer than the class of 2025. The mean total score is 1045 (Reading and Writing 528, Math 517), 16 points above last year and the second year in a row of gains. Of takers, 42% met the college and career readiness benchmark in both sections.
- The report prints quartiles: 870 at the 25th percentile, 1030 at the median and 1220 at the 75th. That puts about 28% of takers at 1200 or higher, 9% at 1400 or higher, and 691 students (0.04%) at a perfect 1600. These ranks are among SAT takers, not among all U.S. 18-year-olds.
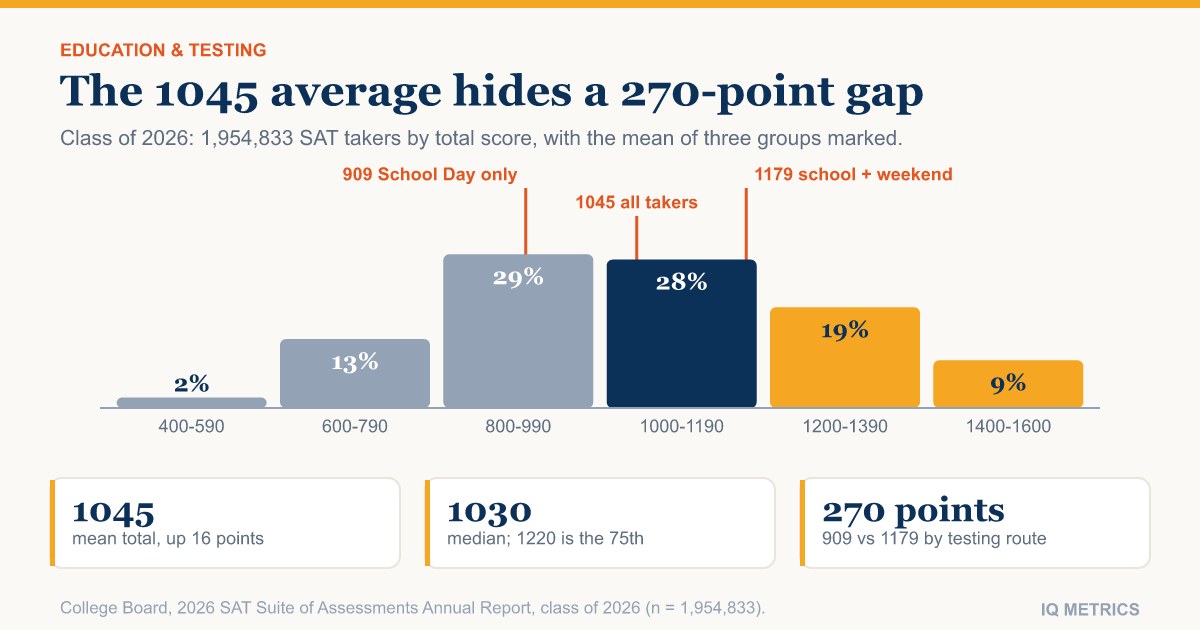
- The mean hides large differences between groups of takers. The 968,119 students who took the SAT only through School Day averaged 909; the 294,579 who took it at school and again on a weekend averaged 1179. That 270-point gap is about 17 times the 16-point rise in the headline mean.
- The report does not print a standard deviation for the total. Estimated from its quartiles (about 259 points), a 16-point rise is roughly 0.06 of a standard deviation, or about 0.9 points on an IQ-style scale with a standard deviation of 15. The SAT is strongly related to general cognitive ability (r = .82 in one study) but it is not an IQ test.
The College Board reported on 29 September 2026 that the 1,954,833 students in the class of 2026 who took the SAT averaged 1045 out of 1600. That is 16 points above the class of 2025 and the second year in a row of gains. Reading and Writing averaged 528 (up 7) and Math 517 (up 9). The release is titled "As the SAT Turns 100"; the test made its debut in 1926. The number is easy to quote, and easy to misread: it is the mean of a self-selected, uneven group, and the same report shows two groups of test takers 270 points apart. This guide sets out what the 1045 does and does not say, and why it is not an IQ.
What did the College Board report for the class of 2026?
The figures below come from the College Board's press release of 29 September 2026 and its 2026 SAT Suite of Assessments Annual Report (Total Group). The report counts each student once, using the most recent score, and it covers students who graduated high school in 2026. The SAT total ranges from 400 to 1600, built from two sections scored 200 to 800. The College Board describes the digital SAT as now in its fourth year; we explain what changed for scores in our guide to the digital, adaptive SAT.
- Test takers: 1,954,833 in the class of 2026, down 2.5% from the class of 2025; takers grew in 42 states and the District of Columbia
- Mean total score: 1045, up 16 points; Reading and Writing 528 (up 7); Math 517 (up 9)
- Benchmarks: 42% met both section benchmarks, 67% met the Reading and Writing benchmark, 45% met the Math benchmark, 69% met at least one and 31% met none
- Testing route: 1,262,698 students (65%) took the SAT at least once through School Day; 692,135 tested only on a weekend, up more than 7% on the class of 2025
- Scores rose for every demographic group the College Board reports, according to its release
A benchmark is not a pass mark. The Math benchmark, for instance, is the section score associated with a 75% chance of earning at least a C in a first-semester, credit-bearing college algebra course, so 42% meeting both benchmarks says how many takers reach a readiness line, not how the scores are distributed.
What does a 1045 look like in percentiles?
A mean is the arithmetic average. A median is the middle score, and a percentile says what share of a group scored at or below a given score. The report prints three of them for the total score: the 25th percentile is 870, the median is 1030 and the 75th percentile is 1220. The mean of 1045 sits 15 points above the median, which tells you a longer stretch of high scores pulls the average up.
The score bands give the same picture. Of 1,954,833 takers, 167,152 scored 1400 to 1600 (9%), 377,381 scored 1200 to 1390 (19%), 549,902 scored 1000 to 1190 (28%), 562,438 scored 800 to 990 (29%), 251,378 scored 600 to 790 (13%) and 46,582 scored 400 to 590 (2%). Adding the top two bands, 544,533 students, or 27.9%, scored 1200 or higher, which squares with 1220 being the 75th percentile. A perfect 1600 went to 691 students, 0.04% of takers.
These are ranks among SAT takers, a group shaped by state testing programs, school choices and who decides to apply to college. A rank among SAT takers is not a rank among all young people, so do not paste it into a tool built for the general population. If you want to see how a percentile maps onto an IQ-style scale, the IQ percentile calculator does the arithmetic, with that caveat attached.
Why is the average not the whole story?
The report breaks takers down by how they tested, and the gaps are far larger than the year-on-year change. The 968,119 students who took the SAT only through School Day (50% of takers) averaged 909 and 18% of them met both benchmarks. The 294,579 who took it at school and again on a weekend averaged 1179 and 68% met both benchmarks. The 692,135 who tested only on a weekend also averaged 1179. The 1045 is a blend of these groups, weighted by how many students fall into each.
That matters because the mix moves. Weekend takers grew by more than 7% on the class of 2025, while total participation fell 2.5%. Nothing in the report says the mix explains the 16-point rise, and we do not claim it does; the point is that a headline mean can shift when the group changes as well as when the students learn more. The College Board itself cautions against using these scores to compare teachers, schools, districts or states, because test taker populations differ.
A 270-point gap between two groups of takers is about 17 times the 16-point rise in the headline average.
The report also tabulates scores against background factors. By the highest level of parental education, takers whose parents had no high school diploma (131,773 students) averaged 887, while takers with a parent holding a graduate degree (431,639 students) averaged 1190. By estimated median family income of the home census tract, the lowest quintile averaged 923 and the highest 1180. Those are contexts and correlations, not measures of anyone's ability, and we cover the research on the link in our guide to socioeconomic status and IQ.
How large is a 16-point rise?
To judge size you need the spread of scores. The standard deviation is the usual measure of how widely scores scatter around the mean. The pages of the 2026 report we read define it but do not print one for the total score, so we estimated it from the published quartiles. For a roughly bell-shaped distribution, the gap between the 25th and 75th percentiles is about 1.349 standard deviations. Here that gap is 350 points (1220 minus 870), which gives a standard deviation of about 259.
On that estimate a 16-point rise is 0.06 of a standard deviation. On an IQ-style scale with a mean of 100 and a standard deviation of 15, the same fraction is about 0.9 points. That is a unit conversion and nothing more. It does not mean the class of 2026 is one IQ point brighter: the takers are self-selected, the mix of takers changed, and the SAT measures what students know and can do on a given day as well as underlying ability. It does show that a headline gain of 16 points is small next to the width of the distribution. The PSAT/NMSQT shares the SAT score scale, and its Selection Index sets the National Merit cutoffs; see our guide to National Merit 2027 cutoffs in percentiles and IQ.
Is the SAT an IQ test?
No. It is a college-admissions test scored on its own 400-to-1600 scale, with no norm group of the general population. But it overlaps heavily with what IQ tests measure. In a 2004 paper in Psychological Science, Meredith Frey and Douglas Detterman reported a correlation of .82 (.86 corrected for nonlinearity) between SAT scores and a measure of general intelligence extracted from the Armed Services Vocational Aptitude Battery, in 917 participants from the National Longitudinal Survey of Youth 1979. In a second study of 104 undergraduates, the correlation with Raven's Advanced Progressive Matrices was .483 (.72 corrected for restricted range).
A correlation of .82 means the two measures share about two-thirds of their variation (.82 squared is .67); .483 shares about a quarter. Both studies used older versions of the SAT, well before the 2016 redesign and the 2024 digital version, so the conversion equations in that paper should not be applied to 2026 scores without care. Our SAT score to IQ conversion guide explains the method and its limits, and we compare achievement and ability tests in achievement tests versus IQ tests. For how elite-university averages are inferred from SAT data, see our analysis of the average IQ of Harvard students.
What should students and parents take from the 2026 numbers?
- Read your own score against the percentile table for the same year, not against the headline mean of 1045
- Remember that 1030 is the median of takers and 1220 is the 75th percentile; a 1200 is above roughly 72% of takers
- Treat the readiness benchmarks as a separate, criterion-based line, not as the middle of the distribution
- Do not compare state or school averages without checking who takes the test there
- Do not read an SAT score as an IQ: if you want a score on the standard IQ scale, take a test built for that
Where would your own score land?
An SAT score places you among college-bound test takers. For a score on the standard IQ scale, with a percentile among the general population and a full report, take the IQ Metrics test.
Find your IQ score now! →Our IQ Metrics test reports on the same scale used throughout this site, so you can place a result against the IQ bell curve. If you are weighing graduate-school tests next, the GRE and LSAT to IQ guide covers the same questions for those exams, and our report on PISA 2025 results shows how international school tests relate to IQ.
Common questions
What is the average SAT score for the class of 2026?
The mean total SAT score for the class of 2026 is 1045, with Reading and Writing at 528 and Math at 517, according to the College Board's report of 29 September 2026. That is 16 points above the class of 2025. The median is 1030, and the mean covers the 1,954,833 students who took the SAT, not all U.S. graduates.
What is a good SAT score in 2026?
It depends on the goal, but the College Board's own percentiles help: 1030 is the median of class of 2026 takers, 1220 is the 75th percentile, and about 9% scored 1400 or higher. A 1200 sits above roughly 72% of takers. For readiness, the College Board reports that 42% of takers met the benchmarks in both sections.
Did SAT scores go up in 2026?
Yes. The mean total rose 16 points to 1045, the second consecutive year of gains, with Reading and Writing up 7 points and Math up 9. Participation fell 2.5% to 1,954,833, and the mix of how students test changed, so the headline mean can reflect who takes the test as well as how much students learned.
Is the SAT an IQ test?
No. It is a college-admissions test with its own 400-to-1600 scale. It is strongly related to general cognitive ability: Frey and Detterman (2004) found a correlation of .82 with a general intelligence measure in 917 young adults, and .483 with Raven's matrices in 104 undergraduates. A strong correlation does not make a score an IQ.
Sources for this story
- As the SAT Turns 100, Nearly 2 Million Students in the Class of 2026 Take the Test (press release, 29 September 2026) — College Board
- 2026 SAT Suite of Assessments Annual Report, Total Group — College Board
- SAT scores are up across the board for class of 2026 (30 September 2026) — Higher Education Dive
- Frey and Detterman, Scholastic Assessment or g? The relationship between the SAT and general cognitive ability, Psychological Science 15(6), 373-378 (2004) — Psychological Science (SAGE)
Corrections: spotted an error? Email corrections@iqmetrics.org and we will update this story and note the change here.
Related stories
All news →The SAT Is Digital and Adaptive Now. Here Is What That Changes for a Score
The exam is shorter, taken on a screen, and the second half of each section changes difficulty based on how you did in the first. Raw right-answer counts stopped mapping onto scores the way they used to.
Falling Reading Scores Are Not Falling IQ. Here Is the Difference
National reading results have dropped again, and around forty per cent of American fourth-graders are now below the NAEP Basic level. That is a fact about an achievement test, and achievement tests are built to show exactly the movement an IQ score is built to hide.

What Is a Good TARA Score? Official Data From Oxford's New Admissions Test
UAT-UK sets no pass mark for the TARA and reports two separate scores from 1.0 to 9.0. Its first technical report shows medians of 4.0 and 4.7 for 2,626 candidates, and a standard error of about one point.
Read the research.
Then find your own number.
Our IIF-certified assessment reports your score with its scale, percentile and confidence range — and a breakdown of the cognitive domains behind it.
Start IQ Test →