





Socioeconomic Status and IQ: What the Evidence Shows
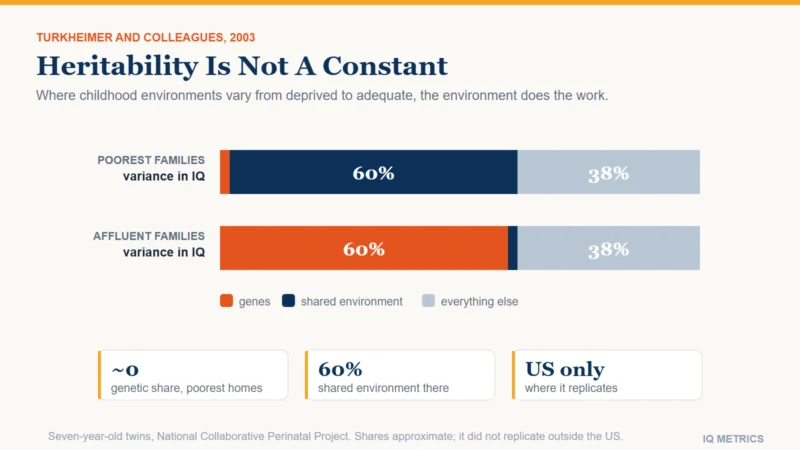
Family circumstances track IQ scores, and the relationship is stranger than a simple gap. In the poorest families studied, genes explained almost none of the variation in childhood scores and shared environment explained most of it. In affluent families the pattern reversed. Here is what that finding does and does not support.

Children from wealthier families score higher on IQ tests on average. That much has been in the literature for a century and is not seriously disputed. The interesting part is the shape of the relationship, because socioeconomic status does not merely shift scores up and down — in the best-known study of the question it changed how much heritability itself explained. That result is genuinely surprising, it has been partly replicated and partly not, and it is routinely overstated in both directions.
This article covers the size of the gap, the gene-environment interaction behind it, the adoption evidence that comes closest to a natural experiment, and the mechanisms that plausibly carry the effect. It is about the arrow running from circumstances to scores. The arrow running the other way — whether a score predicts what you go on to earn — is a separate question, covered in the evidence on IQ and income.
How large is the gap
Across studies, measures of family socioeconomic status correlate with childhood IQ at somewhere around 0.3. That is a real association and a moderate one: it means status accounts for something like a tenth of the variation in scores, and that the distributions overlap heavily. Plenty of children from poor families score above the average for rich ones. A correlation of this size is a fact about populations and close to useless as a prediction about a person.
The correlation is also not one clean variable. Household income, parental education and parental occupation each contribute, they are entangled with each other, and they are entangled with genetics too, since the parents passing on the environment are also passing on the genes. Untangling that is what the twin and adoption designs below exist to do, and it is why an unadjusted income-to-score correlation is the weakest evidence in this article rather than the strongest.
Turkheimer: heritability itself changes with income
In 2003 Eric Turkheimer and colleagues analysed IQ scores from seven-year-old twins in the National Collaborative Perinatal Project, a sample with an unusually large number of families at or below the poverty line — which matters, because most twin studies draw from comfortable volunteers and so cannot see the bottom of the range at all. Instead of estimating one heritability for the sample, they let the genetic and environmental components vary as a function of socioeconomic status.
The result: in the poorest families, shared environment accounted for roughly 60 percent of the variance in scores and the genetic contribution was close to zero. In affluent families the pattern was approximately reversed. The interpretation that follows is not that genes matter less for poor children in some mystical sense. It is that genetic potential expresses itself only to the extent that the environment permits it. Where conditions vary from adequate to excellent, the remaining differences between children are largely genetic. Where conditions vary from deprived to adequate, the environment is doing the work — it is the binding constraint.
This is a genuinely important qualification to the standard heritability figure quoted for adult IQ, and it sits alongside rather than against the twin-study evidence on heritability. A heritability estimate is not a constant of nature; it is a description of one population in one set of conditions.
Why the finding did not replicate everywhere
The honest version of this story includes the replication record, which is mixed in an informative way. A 2016 meta-analysis by Tucker-Drob and Bates pooled the studies that had tested this interaction. They found it, on average, in United States twin samples — though accounting for less variance than the original headline suggested. In samples from Europe, England and Australia they did not find it at all.
That cross-national split is a result in itself rather than a failure. The most straightforward reading is that the interaction appears where the bottom of the income distribution is genuinely deprived and disappears where a welfare floor, universal healthcare and more evenly funded schools compress the range of childhood environments. On that reading the finding is not about income as such, but about how bad the worst environments in a country are allowed to get — which is a testable claim, and one reason the question is still open.
Where would your own score land?
Take the IIF-certified assessment and get your score with the scale it was measured on, the percentile it corresponds to and the confidence range around it — the three figures most online tests leave out.
Find your IQ score now! →Adoption studies: the closest thing to an experiment
Twin designs infer environmental effects; adoption designs move children between environments, which is as close to a natural experiment as this field gets. The clearest example is a 1999 French study by Michel Duyme and colleagues, which found 65 children who had been adopted between the ages of four and six after abuse or neglect, and whose measured IQ before adoption was below 86 — the group averaged 77.
Reassessed in adolescence, all of them had gained, and how much depended on where they landed. Children adopted into low-status families gained 7.7 points on average. Children adopted into high-status families gained 19.5. Same starting range, same country, same age at placement, and a twelve-point difference attributable to the adoptive home. Two things make this unusually persuasive: the pre-adoption score is measured rather than assumed, and adoptive placements are not made at random but also are not made by the birth families, which breaks the usual confound between the genes a child inherits and the home they grow up in.
Note the direction it points. Even in the best-placed group the gain did not erase the differences between individual children, and pre-adoption scores still predicted post-adoption ones. Environment moved every child substantially; it did not make them interchangeable.
What actually carries the effect
"Socioeconomic status" is a proxy, not a mechanism. It stands in for a bundle of things that each have their own evidence, and the bundle is why the association is robust even though no single element explains much.
- Environmental toxins. The dose-response relationship between childhood lead exposure and lost cognitive ability is one of the better-established findings in the field, and exposure tracks housing age and neighbourhood — see the evidence on lead.
- Nutrition, particularly early and particularly iodine and iron deficiency, where the effects are largest in the populations that are most deficient. What diet does and does not do is narrower than the supplement market suggests.
- Schooling. Quantity of education raises scores measurably, and access to it is unevenly distributed; the natural experiments on schooling put the effect at a few points per year.
- Chronic stress and instability, which affect working memory and attention directly and also affect test-day performance, overlapping with test anxiety.
- Language exposure, which loads onto the crystallized half of a score far more than the fluid half — a distinction that matters for interpretation and is set out in the fluid and crystallized article.
What this evidence does not support
Three inferences get drawn from this literature that it will not carry. The first is about individuals: none of it predicts a particular person’s score from their background, and the overlap between groups is far larger than the gap between them.
The second is about groups. Heritability estimated within a population carries no information about the causes of differences between populations — this is a point of arithmetic rather than of politics, and it is the reason national IQ rankings cannot support the claims made for them. The Turkheimer finding actually sharpens the point: if the expression of genetic potential depends on the environment, then comparing groups in different environments tells you nothing clean about either.
The third is fatalism, and it is contradicted by the adoption data on its own terms. A twelve-point difference produced by where a child was placed is a large effect by any standard in this field. What the evidence describes is a constraint that can be loosened, not a ceiling that cannot.
Reading a score with this in mind
For anyone interpreting a real result, the practical upshot is that a score is a measurement taken under conditions, and the conditions are part of the reading. That is true of the test-day variables covered in the factors that affect a result and it is true over a lifetime of them. Whether beliefs about ability form another such condition is examined in the article on growth mindset.
If you want a benchmark for yourself rather than for a population, a properly normed test measures where you are now — which is the only thing any test has ever measured.
Keep reading
All articles →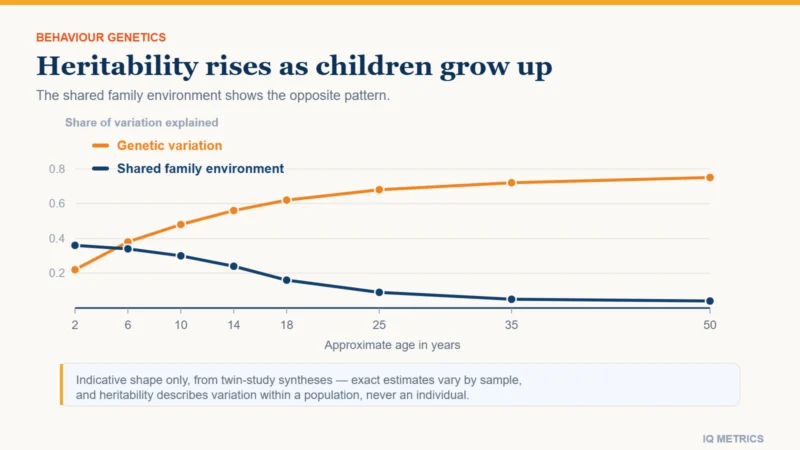 Research & Evidence
Is IQ Genetic?
Heritability estimates for IQ rise from roughly 0.4 in childhood to 0.7 or higher in adulthood, which sounds decisive until you know what heritability measures. Here is what twin and adoption studies actually show, and the four conclusions people draw from them that the statistic does not support.
 Research & Evidence
Growth Mindset and Intelligence
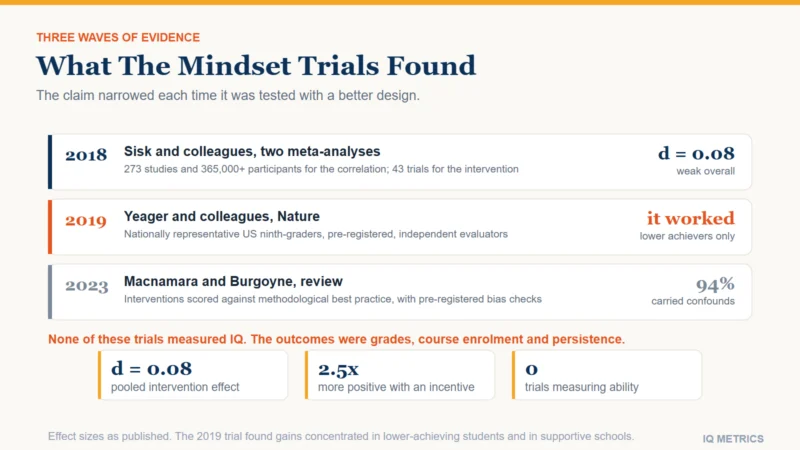
The claim that believing intelligence is malleable makes you achieve more is one of the most widely taught ideas in education, and one of the most heavily contested in the research literature. Three waves of evidence have now landed. Here is what each found, and the question none of them actually answered.
 Understanding IQ
Fluid vs Crystallized Intelligence
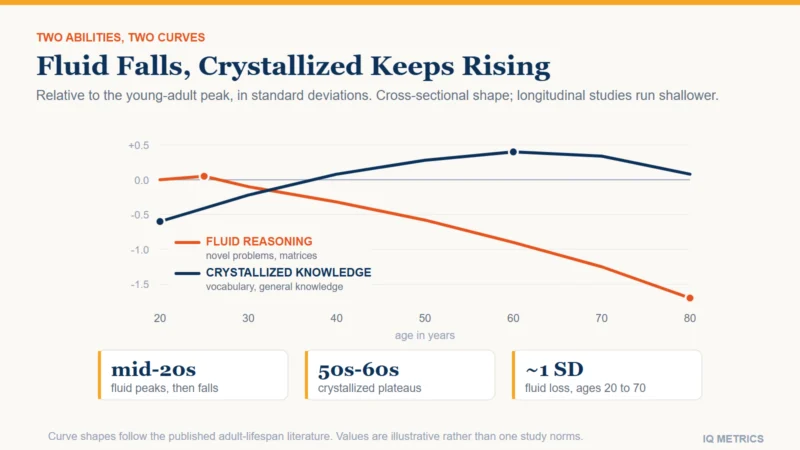
Fluid intelligence is what you use on a problem you have never seen before. Crystallized intelligence is everything you have already banked. The distinction has survived eighty years of factor analysis because the two halves genuinely behave differently, and the clearest proof is what happens to each one as you get older.