



ACT Score to IQ: What the 2026-27 National Ranks Do and Do Not Say
ACT's new national ranks put a composite of 27 at the 89th percentile of ACT-tested graduates. That is not the 89th percentile of everyone, and by ACT's own table the headline average fell mostly because of who sits the test.


What you need to know
- ACT's national ranks for the 2026-27 reporting year (tests from September 2026) put a composite of 36 at rank 100, 30 at 94, 27 at 89, 24 at 80 and 19 at 58. A rank is the percent of ACT-tested graduates of 2024 to 2026 who scored at or below that score; the group's composite mean is 19.1 and its standard deviation 6.1.
- Matched to the IQ scale (mean 100, standard deviation 15), those ranks give about 118 for a 27, 123 for a 30 and 131 for a 33, with a 36 at about 143. That is arithmetic on a rank, not a conversion: ACT says its tested class is not nationally representative, and the ACT is not a perfect measure of IQ.
- The ACT correlated .77 with a general-ability factor in one study of 1,075 people (Koenig, Frey and Detterman, 2008). At that correlation our arithmetic puts the expected IQ of a perfect composite near 133, with a 95% range of roughly 114 to 152. Popular charts that print ACT 36 as IQ 145 are percentile mappings, and one states its own margin of error as 8 to 12 points.
- The national average fell from 20.8 (class of 2016) to 19.4 (class of 2025), but school-day testers rose from 34% to 69% of the class while the two groups' own averages barely moved. By our arithmetic on ACT's table, 1.3 of the 1.4-point fall is the change in mix. American Mensa accepts no ACT taken after September 1989.
An ACT composite of 27 is at the 89th percentile of ACT-tested graduates. Matched to the IQ scale, where the mean is 100 and the standard deviation is 15, that rank would be an IQ of about 118, but only if ACT-takers were a mirror of the whole population and the ACT measured intelligence without error. Neither is true, so there is no official ACT-to-IQ conversion, and every table that prints one is making assumptions. ACT's new national ranks took effect for tests taken from September 2026, which makes this a good moment to do the arithmetic with the official numbers. This guide sets out what the ranks say, how to read them on the IQ scale, why that is not a conversion, and why the national average fell from 20.8 to 19.4.
What do ACT's 2026-27 national ranks say?
ACT's table reports a national rank for every score from 1 to 36. A rank is a percentile: the percent of ACT-tested graduates who scored at or below that score. The edition for the 2026-27 reporting year, September 2026 through August 2027, is based on ACT-tested graduates of 2024, 2025 and 2026; the edition before it used the classes of 2023, 2024 and 2025. In the new edition the composite has a mean of 19.1 and a standard deviation of 6.1, against 19.2 and 6.1 before. Nine composite scores gained one rank point and none lost any: 11, 12, 14, 16, 17, 19, 23, 27 and 29. A 27 moved from the 88th percentile to the 89th.
- Composite 36: rank 100
- Composite 34: rank 99
- Composite 33: rank 98
- Composite 30: rank 94
- Composite 27: rank 89
- Composite 24: rank 80
- Composite 21: rank 68
- Composite 19: rank 58
- Composite 18: rank 52
- Composite 15: rank 34
Two details matter for reading the table. The mean sits above the middle of the distribution: in the class of 2025 the median composite was 18 against a mean of 19.4, so the typical ACT-taker scored a little below the headline average. And since September 2025 the composite has been based only on the English, math and reading scores; science is optional and feeds a separate STEM score. ACT says its research shows consistent score distributions between the old four-section composite and the new three-section one. We found no note in the rank table saying how composites from earlier test dates were treated.
What is an ACT score on the IQ scale?
A percentile can be placed on any scale whose shape is known. On the IQ scale a rank of 50 is an IQ of 100, a rank of 84 is 115 (one standard deviation above the mean) and a rank of 97.7 is 130. Matching each ACT rank to the IQ scale this way gives the figures below. It is the same arithmetic our IQ percentile calculator and IQ score converter run.
- Composite 36 (rank 100; 99.79% of the class of 2025 scored lower): about 143
- Composite 34 (rank 99): 135
- Composite 33 (rank 98): 131
- Composite 32 (rank 97): 128
- Composite 30 (rank 94): 123
- Composite 28 (rank 91): 120
- Composite 27 (rank 89): 118
- Composite 25 (rank 83): 114
- Composite 24 (rank 80): 113
- Composite 22 (rank 72): 109
- Composite 20 (rank 63): 105
- Composite 19 (rank 58): 103
- Composite 18 (rank 52): 101
Read the top row with care. ACT's rank counts everyone at or below a score, so a 36 is rank 100 by definition. ACT's profile report shows that 2,958 of the 1,380,130 graduates in the class of 2025 earned a 36 (0.21%, about 1 in 470), so 99.79% scored lower, which is an IQ-scale value of about 143. Because each rank includes the whole of its score, every figure in the list is the top of that score's band; the middle of the band would be about one IQ point lower. The first composite to reach 130 on this arithmetic is a 33, because 130 is the 97.7th percentile and a 32 is only at rank 97. One composite point is worth about 2.5 IQ-scale points at ACT's standard deviation of 6.1 (15 divided by 6.1), but the ranks move unevenly: near a 19 a point changes the rank by 5 or 6, near a 27 by only 2 or 3, because the distribution thins out at the top.
Why is that not an ACT-to-IQ conversion?
The first problem is who sits the test. ACT states that its tested graduating class is not a nationally representative sample of graduates. About 36% of the class of 2025, 1,380,130 graduates, took the ACT, down from 59% of the class of 2015 in ACT's own 2015 report, and the share by state ran from 1% in Maine to 100% in several states where every student sits it during the school day. ACT also reports that states testing a larger share of their graduates tend to have lower mean composites, because their takers are closer to everyone, while states testing few are dominated by students who chose to test for college admission. A rank among takers is therefore a rank within a group whose make-up differs by state and by year. Whether that makes a score look better or worse than it would among all young people depends on who is missing, and some of the missing sat a different admissions test or none, so the direction cannot be read from ACT's data.
The second problem is that the ACT is not a perfect measure of intelligence. In Koenig, Frey and Detterman (Intelligence, 2008), a general-ability factor taken from the Armed Services Vocational Aptitude Battery for 1,075 participants in the National Longitudinal Survey of Youth 1979 correlated .77 with their ACT scores. In a later sample of 149 people, the correlation between the ACT composite and IQ scores derived from Raven's Advanced Progressive Matrices was .61. The same group's earlier study of the SAT (Frey and Detterman, Psychological Science, 2004) found .82 in 917 people. The ACT equation in the 2008 paper had a standard error of about 7 IQ points, and it was fitted to the pre-1990 version of the test; a 2025 paper by Jon Butler in Intelligence says that it gives less accurate estimates with newer ACT scores.
When a correlation is below 1, the best guess for a person's IQ sits closer to 100 than their test score does, a pull called regression to the mean. With r = .77 the expected IQ is 100 plus 15 times .77 times the rank's z-score (the number of standard deviations from the mean), with a spread of about 9.6 points around it. For an ACT composite that gives the following, with the 95% range in brackets.
- Composite 36: expected IQ about 133 (114 to 152)
- Composite 33: about 124 (105 to 142)
- Composite 30: about 118 (99 to 137)
- Composite 27: about 114 (95 to 133)
- Composite 24: about 110 (91 to 128)
- Composite 19: about 102 (84 to 121)
Popular conversion charts use the percentile mapping of the previous section. One widely shared chart lists a 36 at 141 to 145 and a 27 at 113 to 115, describes its method as percentile mapping adjusted for the college-bound population, and states its own margin of error as 8 to 12 IQ points. A 145 beside a 36 is a rank, not a measurement, and the correlations above say that a perfect composite predicts an IQ nearer 133. Ranking among takers moves the answer by an unknown amount in an unknown direction, and an imperfect correlation pulls the expected IQ toward 100. Neither is a reason to ignore the ACT; both are reasons to distrust a single number printed beside an ACT score. For the same reasoning applied to other exams see our guides to the SAT, the GRE and LSAT and the ASVAB and AFQT, and our wider comparison of achievement tests and IQ tests.
Why did the national average fall from 20.8 to 19.4?
ACT's average composite for the graduating class fell from 20.8 in 2016 to 19.4 in 2025. ACT's own explanation is about who sits the test. Each year it splits the class by how a student most recently tested: during the school day, in a state or district programme, or on a weekend date by choice. The table in its guide to interpreting graduating-class data gives the means and shares.
- 2016: school-day 18.3 x 34% + weekend 22.1 x 66% = 20.8
- 2019: 18.1 x 40% + 22.4 x 60% = 20.7
- 2022: 17.9 x 59% + 22.6 x 41% = 19.8
- 2025: 17.8 x 69% + 23.0 x 31% = 19.4
Our arithmetic on those figures: applying 2016's group means to 2025's mix of testers gives 19.5, so about 1.3 of the 1.4-point fall comes from the change in who tests and about 0.07 from the groups' own scores. Put the other way, had the class of 2025 kept the 2016 mix, its average would have been 21.2, which is 0.4 above 2016. Weekend testers' mean rose from 22.1 to 23.0 while school-day testers' fell from 18.3 to 17.8. That does not show that students became more or less able. It shows that a headline average moves when the mix does, the same lesson as the 270-point gap between groups of takers in our SAT class of 2026 report.
By the arithmetic of ACT's own table, 1.3 of the 1.4-point fall in the average ACT score comes from who takes the test.
Does American Mensa accept ACT scores?
No ACT score earned today can be submitted. American Mensa's list of accepted past tests takes an ACT composite of 29 only if the test was taken before September 1989, and marks an ACT taken after that date as not accepted. The SAT is treated the same way: 1300 before 30 September 1974, 1250 up to 31 January 1994, and not accepted after. For the routes that do qualify, see our guide to Mensa's IQ requirement.
What should students and families take from the ranks?
- Read your score against the current table: a 27 is above 89% of ACT-tested graduates, a 21 above 68% and a 19 above 58%
- Remember that the rank is among ACT-takers, and that a state testing every student and one testing 1% are not comparable
- Do not turn a rank into an IQ with a formula or a table; use the IQ scale only to see the size of a gap, at about 2.5 IQ-scale points per composite point
- Treat one or two points as noise, since every test score carries a margin of error, explained in our guide to the IQ score margin of error
- If you want a result on the standard IQ scale, take a test built for that
Where would your own score land?
An ACT rank places you among ACT-takers. For a score on the standard IQ scale, with a percentile among the general population and a full report, take the IQ Metrics test.
Find your IQ score now! →Our IQ Metrics test reports on the scale used throughout this guide, and the IQ bell curve shows where a result sits. For how elite-university averages are inferred from admissions scores, see our analysis of the average IQ of MIT, Oxford and Yale students, and for the PSAT scale behind National Merit see National Merit 2027 cutoffs.
Common questions
What ACT score equals a 130 IQ?
There is no official conversion. Matching ACT's 2026-27 national ranks to the IQ scale puts 130 at the 97.7th percentile, which a composite of 33 (rank 98) is the first to reach. That treats ACT-takers as everyone and the ACT as a perfect IQ test; with a correlation of .77 the expected IQ for a 33 is nearer 124, with a wide range around it.
What is a good ACT score in 2026?
By ACT's 2026-27 national ranks a 19 is about the middle of ACT-tested graduates (rank 58), a 24 is rank 80 and a 27 is rank 89. The class of 2025 averaged 19.4 and its median was 18. What counts as good depends on the colleges and scholarships you are aiming at.
Is the ACT an IQ test?
No. It is a college-readiness test scored from 1 to 36, with ranks based on ACT-tested graduates rather than the general population. Research does find that admissions-test scores overlap strongly with general cognitive ability: the ACT correlated .77 with a general-ability factor in one study of 1,075 people.
Does Mensa accept ACT scores?
Not for tests taken after September 1989. American Mensa accepts an ACT composite of 29 only for tests taken before that date and lists later ACT tests as not accepted.
Sources for this story
- ACT Score National Ranks, 2026-2027 and 2025-2026 reporting years (PDF tables) — ACT
- Interpreting Graduating Class Data (class of 2025); 2025 ACT Profile Report, National; Condition of College and Career Readiness 2015 — ACT
- The enhanced ACT: K-12 frequently asked questions (composite from English, math and reading) — ACT
- ACT and general cognitive ability, Intelligence 36(2), 153-160 (2008); Scholastic Assessment or g?, Psychological Science 15(6), 373-378 (2004) — Koenig, Frey and Detterman; Frey and Detterman
- Assessing the external validity of the ACT as a predictor for intelligence quotient scores, Intelligence 110 (2025) — Jon Butler
- Join Mensa Using My Past Test Scores: qualifying test scores (us.mensa.org, accessed 12 October 2026) — American Mensa
Corrections: spotted an error? Email corrections@iqmetrics.org and we will update this story and note the change here.
Related stories
All news →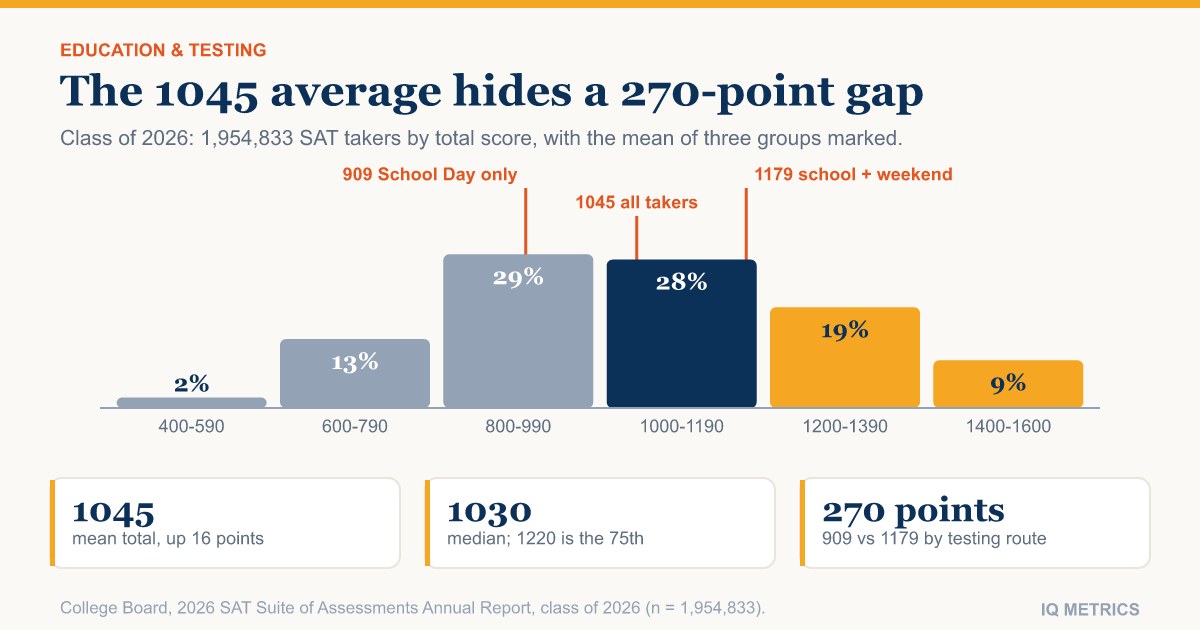
SAT Scores for the Class of 2026: What the 1045 Average Means
The College Board reports a mean of 1045 for 1,954,833 test takers, 16 points up on last year. The median is 1030, and two groups of takers sit 270 points apart, so the headline average reflects who sits the test as well as how well they do.

ASVAB Score to IQ: What an AFQT Percentile Really Converts To
There is no official ASVAB-to-IQ chart. The AFQT is a percentile ranked against about 6,000 young Americans tested in 1997, and the popular claim that the military cannot take anyone with an IQ below 83 matches no rule: the rules draw the line at the 10th percentile.

HSPT Scores Explained: Percentiles, Composites and the Cognitive Skills Quotient
The HSPT gives each of five subtests a 200 to 800 standard score and a national percentile, adds three composites, and reports a Cognitive Skills Quotient on an IQ-style scale. Its publisher sets no pass mark and says the quotient is not limited to innate ability.
Read the research.
Then find your own number.
Our IIF-certified assessment reports your score with its scale, percentile and confidence range — and a breakdown of the cognitive domains behind it.
Start IQ Test →