



PISA 2025 Results: Record Lows, and What They Do Not Show About IQ
The OECD average fell to 463 in mathematics and 461 in reading, the lowest it has recorded. A 22-point maths fall works out at about three points on an IQ-style scale, but that is a unit conversion, not a measurement of anyone's intelligence.

What you need to know
- The OECD published PISA 2025 on 8 September 2026: more than 760,000 students from 91 countries and economies, representing about 33 million 15-year-olds. The OECD averages are 463 in mathematics, 461 in reading and 482 in science. The OECD says mathematics and reading are the lowest averages it has recorded.
- Across OECD countries mathematics fell 22 points between 2015 and 2025, which the OECD equates to just over one year of learning, and reading fell 28 points, about one and a half years. One in five 15-year-olds is now a low performer, up from 16% in 2022. Costa Rica, the Slovak Republic, Türkiye and the United Kingdom raised their science scores since 2022.
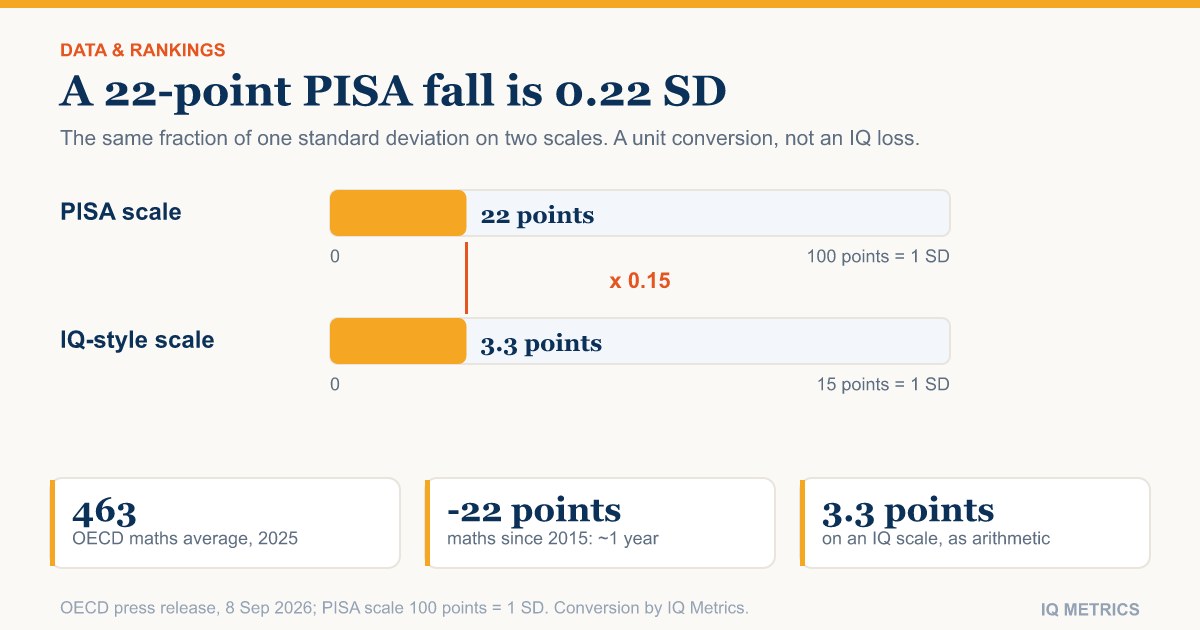
- PISA's scales were set so that the OECD mean is 500 and the standard deviation is 100. On that definition, 22 points is 0.22 of a standard deviation, or about 3.3 points on an IQ-style scale with a standard deviation of 15. A meta-analysis finds a year of extra schooling is worth roughly 1 to 5 IQ points, so the two figures sit in the same range, but neither is an IQ measurement.
- The top scores come from four Chinese jurisdictions (Beijing, Shanghai, Jiangsu, Zhejiang, reported as B-S-J-Z) and Singapore. Turning a score gap into a country IQ, as many ranking tables do, treats a 15-year-old school sample as if it were a norm group for a whole population, which it is not.
The OECD published the results of its 2025 Programme for International Student Assessment, known as PISA, on 8 September 2026. Across OECD countries the average 15-year-old scored 463 in mathematics, 461 in reading and 482 in science, and the OECD said mathematics and reading reached the lowest averages it has recorded. Headlines quickly turn results like these into claims about national intelligence. PISA is not an IQ test, and the arithmetic below shows both what a 22-point fall amounts to on an IQ-style scale and why that conversion should not be quoted as a finding.
What did PISA 2025 find?
More than 760,000 students took part, representing around 33 million 15-year-olds in 91 countries and economies. The 2025 cycle focused on science, alongside reading and mathematics, and added a first-time assessment of learning in the digital world. Because that last scale is new, there is no trend to read from it yet.
- OECD averages in 2025: mathematics 463, reading 461, science 482
- Mathematics: down 22 points across OECD countries between 2015 and 2025, which the OECD describes as just over one year of learning
- Reading: down 28 points over the same period, about one and a half years of learning
- Low performers: one in five 15-year-olds across the OECD, up from 16% in 2022
- Hasty reading, as the OECD labels it, nearly doubled to 9% between 2018 and 2025
Who scored highest, and who gained?
In mathematics the highest mean was B-S-J-Z (China) at 612, ahead of Singapore at 563, Macao at 549, Chinese Taipei at 546, Japan at 525, and Korea and Hong Kong at 522. B-S-J-Z stands for Beijing, Shanghai, Jiangsu and Zhejiang, four jurisdictions, not the whole of China. In reading Singapore led at 535 with B-S-J-Z at 527, and in science B-S-J-Z led at 597 with Singapore at 560.
Among larger Western systems the table shows the United Kingdom at 488 in mathematics, 494 in reading and 511 in science, and the United States at 463, 490 and 502. Australia scored 478, 491 and 509. Estonia reached 508 in mathematics, 499 in reading and 527 in science. The OECD says Costa Rica, the Slovak Republic, Türkiye and the United Kingdom increased their science scores since 2022. The table also marks several systems with an asterisk, including Canada, New Zealand, the Netherlands, Norway and the United States, meaning one or more PISA sampling standards were not met; the table's note says caution is needed in interpreting the results for those systems.
A raw score means more once you subtract the OECD average, because the PISA scale is built so that 100 points is one standard deviation. Our arithmetic on the table, in points above the OECD average of 463 in mathematics, 461 in reading and 482 in science, is below. A gap of 100 is one standard deviation, so Singapore's mathematics lead is exactly that, while the United States sits on the OECD average in mathematics.
- Singapore: +100 in mathematics, +74 in reading, +78 in science
- B-S-J-Z (China): +149 in mathematics, +66 in reading, +115 in science
- Estonia: +45 in mathematics, +38 in reading, +45 in science
- United Kingdom: +25 in mathematics, +33 in reading, +29 in science
- Australia: +15 in mathematics, +30 in reading, +27 in science
- United States: 0 in mathematics, +29 in reading, +20 in science (sampling-standards asterisk)
What does a 22-point fall mean in IQ terms?
PISA reports scores on a scale built so that 500 is the average of OECD countries and 100 points is one standard deviation, the usual measure of how widely scores spread. Each subject's scale was set in the cycle where it was the main focus: reading in 2000, mathematics in 2003 and science in 2006. IQ scales are built the same way, with a mean of 100 and, in most modern tests, a standard deviation of 15. So you can convert: 22 points is 0.22 of a standard deviation, and 0.22 times 15 is 3.3 points. Reading's 28 points converts to 4.2.
There is an independent check on the size. The OECD equates the 22-point fall to just over a year of learning. A 2018 meta-analysis in Psychological Science by Stuart Ritchie and Elliot Tucker-Drob pooled 142 effect sizes from 42 data sets with more than 600,000 participants and found that an additional year of education raised intelligence test scores by approximately 1 to 5 IQ points. A fall worth about a year of learning and a conversion of about 3 points fall in the same neighbourhood. That is reassuring about scale. It does not turn either number into a measured change in anyone's IQ. The same caution applies to the claim that Gen Z is less intelligent than its parents; see Gen Z IQ: is Gen Z less intelligent than its parents.
The size is also worth setting beside the Flynn effect. The figure usually quoted for the twentieth-century rise in IQ test scores in industrialised countries is about three points per decade. The 22-point fall in mathematics converts to about 3.3 points over the ten years from 2015 to 2025, and reading's 28 points to 4.2, so the decline is of a similar size to the typical historical gain, in the opposite direction. That comparison has the same limits as the conversion: it lines up two different kinds of score. A country league table built from online volunteers instead of a sampling design is examined in average IQ by country 2026.
Convert 22 PISA points and you get about three IQ-scale points; that is a unit conversion, not a measurement of anyone's intelligence.
The conversion rests on assumptions. It assumes the spread of scores is close to what it was when each scale was set, which we have not checked for 2025. It treats a school test of 15-year-olds as if it measured the same thing as a reasoning test, which it does not: PISA scores respond to schooling, attendance, curriculum and student engagement. And the OECD average itself depends on which countries are in the comparison. Our guide to PISA versus IQ tests sets out the difference, and our explainer on achievement tests versus IQ tests covers why the two diverge.
Does a PISA gap tell you a country IQ?
The same arithmetic produces headlines. B-S-J-Z's mathematics mean of 612 is 149 points above the OECD average of 463, or 1.49 standard deviations. Multiply by 15 and it looks like 22 IQ points. That is how many "country IQ" tables are assembled from test scores, and it is why they mislead: the sample is 15-year-olds in a selected set of schools or jurisdictions, the tests measure taught skills, and a mean is not a norm group for the whole population. Our analysis of country IQ rankings explains why the data behind such charts is weaker than they suggest, and our page on average IQ by country shows how we handle the figures.
Falling scores also raise a different question: whether IQ norms themselves are drifting. Some countries recorded rising test scores through the twentieth century, a pattern called the Flynn effect, and several data sets show it stalling or reversing. We review that evidence in why IQ norms expire. PISA is a poor test of that question because it is not an IQ test, and because a decline in its scores has many candidate causes, schooling, attendance and screen use among them, that it was not designed to separate. Our piece on screen time and cognitive test scores in children covers what the research can and cannot say.
What should readers take from PISA 2025?
- Read the OECD average (463, 461, 482) as the benchmark, and check whether a system carries a sampling-standards asterisk
- Treat 22 points as roughly a year of learning on the OECD's own scale, not as an IQ loss
- Remember that B-S-J-Z is four jurisdictions, not a country; compare like with like
- Be sceptical of any "national IQ" figure derived from a PISA gap
- Use PISA for what it is, a snapshot of 15-year-olds' school skills, and use an IQ test for reasoning
Where would your own score land?
PISA compares school systems. If you want to see how your own reasoning compares with the general population, take the IQ Metrics test and get a score on the standard IQ scale with a percentile and a full report.
Find your IQ score now! →Our IQ Metrics test reports on the standard scale, and you can see how any score converts with the IQ score converter. For another school-test release from this autumn, see our report on SAT scores for the class of 2026.
Common questions
What is the OECD average in PISA 2025?
The OECD average scores in PISA 2025 are 463 in mathematics, 461 in reading and 482 in science. The OECD says mathematics and reading are the lowest averages it has recorded. Across OECD countries mathematics fell 22 points between 2015 and 2025 and reading fell 28 points.
Which country scored highest in PISA 2025?
B-S-J-Z (Beijing, Shanghai, Jiangsu and Zhejiang) scored highest in mathematics (612) and science (597), and Singapore scored highest in reading (535). Singapore was second in mathematics (563) and science (560). B-S-J-Z is four Chinese jurisdictions, not the whole country.
Is PISA an IQ test?
No. PISA assesses 15-year-olds in reading, mathematics and science and reports scores on scales where the OECD mean is 500 and the standard deviation is 100. IQ tests measure general reasoning against a population norm, usually with a mean of 100 and a standard deviation of 15. PISA scores respond to schooling in ways IQ scores are designed not to.
How many IQ points is a 22-point PISA fall?
As arithmetic, 22 points is 0.22 of a standard deviation, or about 3.3 points on an IQ scale with a standard deviation of 15. That is a unit conversion, not a measured change in IQ. It is close to the 1 to 5 points a meta-analysis finds for one extra year of education, but the two are different quantities.
Sources for this story
- PISA 2025: Students' reading and mathematics performance declined sharply across the OECD (press release, 8 September 2026) — OECD
- Mean scores of participating education systems in PISA 2025 (table sourced to the Ministry of Education, Singapore, and the OECD) — Ministry of Education, Singapore
- PISA 2025 Results (Volume I): Future-Ready Students (results summary, 8 September 2026, updated 10 September) — Sweden at the OECD / OECD
- PISA 2025: What the results tell us (8 September 2026) — Teacher Magazine (ACER)
- Ritchie and Tucker-Drob, How Much Does Education Improve Intelligence? A Meta-Analysis, Psychological Science (2018) — Psychological Science (SAGE)
- PISA technical documentation: construction of the reporting scales — OECD
Corrections: spotted an error? Email corrections@iqmetrics.org and we will update this story and note the change here.
Related stories
All news →Country IQ Rankings Are Weaker Than the Charts Suggest
The tables that circulate as national IQ figures come from one compilation built out of whatever studies existed, in whatever years, on whatever samples. Several of the numbers were estimated rather than measured.
A Century of Rising IQ Scores Has Stalled in Wealthy Countries
Average scores climbed for decades, then flattened and in places slipped. None of it shows on a score report, because every test is reset so the average is 100 again — which is why a 1990 score is not a 2026 score.

Average IQ by Country 2026: What South Korea's 106.97 Does and Does Not Show
South Korea leads the International IQ Test's 2026 country table at 106.97. The table's own sample counts show a quarter of the 1,212,714 test-takers came from Indonesia, that the rows do not average to the stated 100, and that scores moved with the size of each country's crowd.
Read the research.
Then find your own number.
Our IIF-certified assessment reports your score with its scale, percentile and confidence range — and a breakdown of the cognitive domains behind it.
Start IQ Test →