



Gen Z IQ: Is Gen Z Less Intelligent Than Its Parents? What the Data Show
A neuroscientist told the US Senate in January 2026 that Gen Z is the first generation to underperform its parents, "even general IQ". The written testimony does not say it, and the best IQ data stop with people born in 1991.


What you need to know
- The "first generation" line was spoken, not written. At the 15 January 2026 Senate hearing Jared Cooney Horvath said Gen Z is the first generation to underperform its parents on nearly every cognitive measure, "even general IQ", with no dataset or number. His eight-page written testimony has no "Gen Z", "first generation" or "standardized".
- The strongest IQ evidence is Norwegian: conscript IQ peaked for men born in 1975 at 102.3 and fell to 99.4 for 1989, about 0.33 points a year after correction, inside families too. Those data stop at the 1991 birth cohort, six years before the first Gen Z birth year.
- Teenage test scores have fallen as well: the OECD averages in PISA 2022 were 472 in mathematics and 476 in reading, and the US age-13 NAEP fell 9 points in maths and 4 in reading from 2020 to 2023. Those are achievement tests, not IQ tests, and Horvath himself said "this is all correlative".
- "Six to eight IQ points per decade" traces to Horvath's own newsletter with no study named; the best documented rate is about 3.3 points a decade in Norway. A paper published on 7 October 2026 found small, mixed changes in attention among Austrian adults since 2000.
We found no study that compares the IQ of Gen Z, people born from 1997 onward in Pew Research Center's definition, with its parents' on the same test. The claim that Gen Z has a lower IQ rests on one spoken sentence at a US Senate hearing. On 15 January 2026 the neuroscientist Jared Cooney Horvath said Gen Z is the first generation in modern history to underperform its parents on basically every cognitive measure, including "even general IQ", and gave no figure for it. The evidence behind the claim is narrower: reading and maths scores of teenagers have fallen in many countries since the early 2010s, and conscript IQ in Norway peaked for men born in 1975 and fell afterwards. But the best IQ data stop with men born in 1991. This guide sets the claim beside the primary sources.
What did the Senate witness actually say?
The hearing was "Plugged Out: Examining the Impact of Technology on America's Youth", held by the Senate Commerce Committee on 15 January 2026 and printed as S. Hrg. 119-472. Horvath's spoken statement began: "Our kids are less cognitively capable than we were at their age." He said every generation since the late 1800s had outperformed its parents "until Gen Z", and that Gen Z "is the first generation in modern history to underperform us on basically every cognitive measure we have, from basic attention to memory to literacy to numeracy to executive functioning to even general IQ". He asked what happened "around 2010" to separate schooling from cognitive development, pointed to classroom technology, and added: "of course, this is all correlative." He named no dataset for the generational claim.
His eight-page written testimony is more cautious than the speech. We searched its text and found no "Gen Z", no "first generation" and no "standardized"; "IQ" and "Flynn" appear only inside the titles of references. It dates the turning point to the mid-2000s, saying the long rise in cognitive performance "plateaued then reversed in many Western nations". The psychologist Jean Twenge, speaking on the same panel, dates the fall in US 8th and 12th grade reading and maths scores to after 2012. So the decline starts in the mid-2000s, around 2010 or after 2012, depending on which sentence of the hearing you read.
Press coverage widened the gap. Fortune reported that Horvath told the Senate, in written testimony, that Gen Z is the first generation to score lower on standardized tests than the one before it. That sentence is not in the written testimony, and the phrase "standardized tests" appears in neither of his statements. Fortune's remark that literacy and numeracy tests "aren't always indicative of intelligence" is also the journalist's caveat, not the witness's. Weeks later, in a newsletter post of 6 February 2026, Horvath wrote that "we cannot concretely say that Gen Z is less intelligent than Millennials", and described IQ as a measure of "school-ability". The sensational version of the claim is therefore stronger than the one its author defends.
What do school-test scores show for Gen Z?
Here the numbers are real, but they come from achievement tests. PISA tests 15-year-olds, so the 2022 cycle covered students born in 2006 and 2007 and the 2025 cycle those born in 2009 and 2010 (our arithmetic; Pew puts the Millennial and Gen Z boundary at 1996 and 1997).
- PISA 2022 OECD averages: 472 in mathematics, 476 in reading and 485 in science
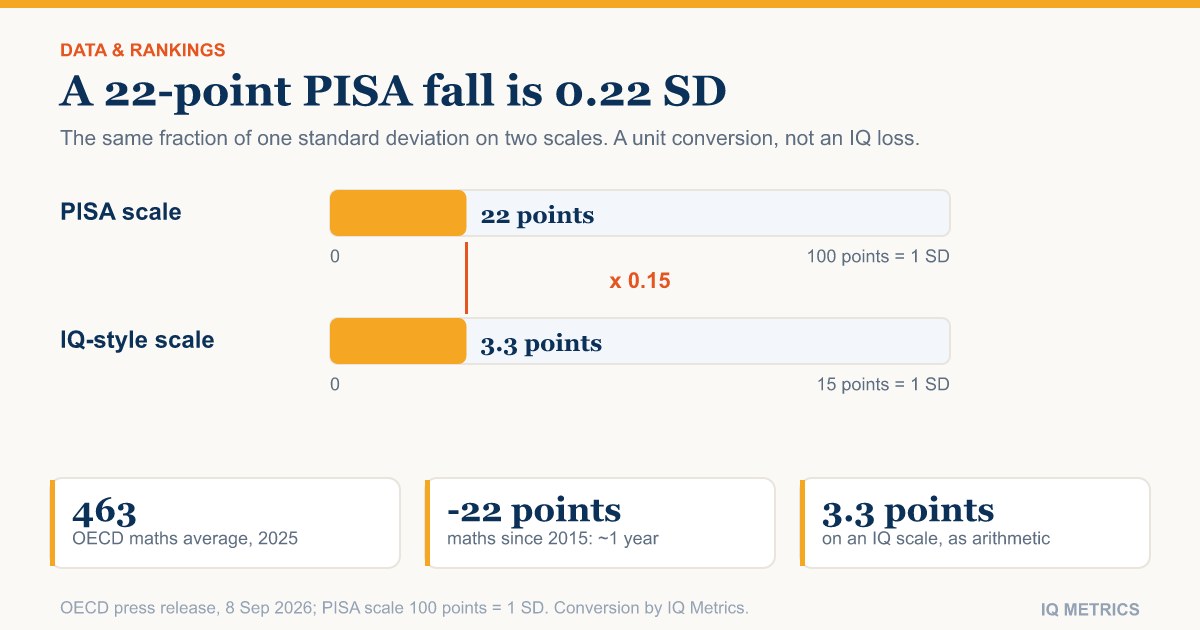
- PISA 2025 OECD averages: 463 in mathematics, 461 in reading and 482 in science; mathematics is down 22 points and reading 28 since 2015 (see our guide to PISA 2025)
- NAEP long-term trend, age 13, 2023: mathematics down 9 points and reading down 4 from the 2019-20 assessment, and down 14 and 7 points from a decade earlier
PISA is scaled to a mean of 500 and a standard deviation of 100, so a 22-point fall is 0.22 of a standard deviation, about 3.3 points on an IQ-style scale with a standard deviation of 15. That conversion treats an achievement test as if it were an IQ test. Our guide to the PISA test versus an IQ test explains why the two are not interchangeable, and our guide to screen time and test scores in children covers the screen-time evidence.
What do IQ-type tests show?
The best evidence is Norwegian conscription testing. Bratsberg and Rogeberg (PNAS, 2018) analysed 736,808 valid scores from men born between 1962 and 1991, converted to an IQ scale with a mean near 100. The average rose from 99.5 for the 1962 cohort to 102.3 for 1975, then fell to 99.4 for 1989 and 99.7 for 1991. Their selection-corrected model puts the 1975 to 1991 decline at about 0.33 points a year within families (interval 0.26 to 0.40), roughly 3.3 points a decade. The same rise and fall appears between brothers, which points to something in the environment, not to who was having children. The authors say they cannot identify the causal structure.
Denmark is similar but smaller. Teasdale and Owen (Intelligence, 2008) found that Danish conscripts gained modestly on a four-test battery between 1988 and 1998, then lost about 1.5 IQ points by 2003 to 2004, among men pursuing higher education and those who were not. In the United States, Dworak, Revelle and Condon (Intelligence, 2023) followed 394,378 online adults from 2006 to 2018: composite, matrix-reasoning and number-series scores fell, verbal reasoning barely moved, and three-dimensional rotation rose. Online volunteers are not a random sample, and these are adults. A 2016 review by Dutton, van der Linden and Lynn found nine studies reporting negative Flynn effects in seven countries.
Set against that, the century-long picture is still one of gains. A meta-analysis of 271 samples and almost 4 million people (Pietschnig and Voracek, 2015) found full-scale gains of 0.28 IQ points a year between 1909 and 2013, stronger for adults than for children and smaller in recent decades. Even the newest US Wechsler comparison shows a smaller gain, not a loss: in two counterbalanced studies (186 people aged 16 to 90 on the WAIS-IV and WAIS-5, and 98 sixteen-year-olds on the WISC-V and WAIS-5), the Flynn effect came out at 1.2 points where about 3 had been expected (Winter, Trudel and Kaufman, 2024). The samples were small and practice effects were possible. Our guide to the Flynn effect stalling sets out why norms age.
The best IQ data behind the Gen Z claim stop six years before the first Gen Z birth year.
Why are "first generation" and "IQ" the weak links?
Three gaps stand out. First, no dataset we read ends in Gen Z: the Norwegian series stops with men born in 1991, the Danish men were tested between 1988 and 2004, and the US online sample is adults. Second, the school-test falls are real but measure reading, maths and science, which is why Horvath's own list runs from "attention" through "literacy" to "IQ" without separating them. Our guide to achievement tests and IQ tests explains the difference. Third, "first generation" is a comparison across birth cohorts in separate countries and tests, not a measured contrast between Gen Z and its parents.
The "six to eight points per decade" figure traces to Horvath's newsletter, which says that "across a handful of well-designed studies" the drop has been "as much as" that, but names none of them. The Norwegian estimate, the one we could verify, is about half of it. We could not identify the 2025 paper called "Digging In" that the newsletter cites for the finding that visually guided tasks held up while memory-heavy ones fell.
What does newer evidence say about attention?
The written testimony cites a 2024 meta-analysis of the d2 attention test (Andrzejewski, Zeilinger and Pietschnig, 287 samples, 21,291 people, 32 countries, 1990 to 2021) as support for stagnation or decline. Its title reports better test performance, and its abstract finds moderate gains in adults but not in children, with more errors alongside faster processing in children. A paper published on 7 October 2026 (Lesigang, Vetter, Voracek and Pietschnig, in Intelligence and Cognitive Abilities) compared Austrian adults tested between 2000 and 2004 with matched adults tested in 2025. Selective attention improved slightly (d = 0.12), interference control was unchanged, and sustained attention may have declined (d = -0.27). The authors say the results contradict the notion of large changes in attention-related abilities in the digital age. The participants were adults aged 16 to 91, not Gen Z.
Causes remain open. Horvath argues that classroom screens are responsible; the Norwegian authors find an environmental cause but cannot say which; other proposals include changes in schooling, media exposure, nutrition and health. Our guide to cognitive offloading and our blog guide on whether AI makes you dumber cover one newer strand of the argument.
What does this mean for your own IQ score?
Nothing changes on an individual report, because every IQ test is re-normed so that the average is 100, as our guide to whether IQ changes over time notes. A drift of 3 points a decade, if it applies to you at all, matters mainly for old norms. Read a score as a rank against people tested on the same norms, and use the percentile calculator to see what the rank means.
Where would your own score land?
Want your own result on the standard IQ scale, with its percentile and a full report? Take the IQ Metrics test.
Find your IQ score now! →To compare any score with the population, take the IQ Metrics test and read the result against the IQ bell curve.
Common questions
Is Gen Z less intelligent than millennials?
We found no study that measures this directly. Teenage reading and maths scores have fallen in many countries, and Norwegian conscript IQ fell for men born from 1975 to 1991, but the best IQ data stop before Gen Z. Horvath himself wrote that "we cannot concretely say" Gen Z is less intelligent.
What is the reverse Flynn effect?
The Flynn effect is the rise in IQ test scores across birth cohorts, about 3 points a decade in the 20th century (0.28 a year in a 271-sample meta-analysis). The reverse Flynn effect is a fall in some countries; a 2016 review found nine studies in seven countries.
Who counts as Gen Z?
Pew Research Center places Millennials at those born from 1981 to 1996 and counts anyone born from 1997 onward as the next generation, Gen Z.
Did the Senate testimony say Gen Z has a lower IQ?
Only in the spoken statement, which listed "even general IQ" among the measures where Gen Z underperforms, with no data. The written testimony makes no IQ claim.
Sources for this story
- S. Hrg. 119-472, Plugged Out: Examining the Impact of Technology on America's Youth, hearing of 15 January 2026, with written and spoken statements — US Government Publishing Office, Senate Commerce Committee
- Flynn effect and its reversal are both environmentally caused (2018); Secular declines in cognitive test scores: a reversal of the Flynn effect (2008) — Bratsberg and Rogeberg, PNAS; Teasdale and Owen, Intelligence
- Looking for Flynn effects in a recent online U.S. adult sample (2023); The negative Flynn effect: a systematic literature review (2016); One century of global IQ gains (2015); Wait, where's the Flynn effect on the WAIS-5? (2024) — Intelligence; Perspectives on Psychological Science; Journal of Intelligence
- Is there a Flynn effect for attention? (2024); No age of inattention: cross-temporal changes in attention in Austrian adults, 2000-2025 (7 October 2026) — Personality and Individual Differences; Intelligence and Cognitive Abilities
- PISA 2022 Results, Volume I; NAEP Long-Term Trend 2023 highlights; Where Millennials end and Generation Z begins — OECD; National Center for Education Statistics; Pew Research Center
- I told the Senate Gen-Z is less cognitively capable (6 February 2026 newsletter post); Fortune coverage of the testimony — Jared Cooney Horvath; Fortune
Corrections: spotted an error? Email corrections@iqmetrics.org and we will update this story and note the change here.
Related stories
All news →A Century of Rising IQ Scores Has Stalled in Wealthy Countries
Average scores climbed for decades, then flattened and in places slipped. None of it shows on a score report, because every test is reset so the average is 100 again — which is why a 1990 score is not a 2026 score.
PISA 2025 Results: Record Lows, and What They Do Not Show About IQ
The OECD average fell to 463 in mathematics and 461 in reading, the lowest it has recorded. A 22-point maths fall works out at about three points on an IQ-style scale, but that is a unit conversion, not a measurement of anyone's intelligence.
Do High-Scoring Children at Age 7 Stay High? What 11,119 Children Show
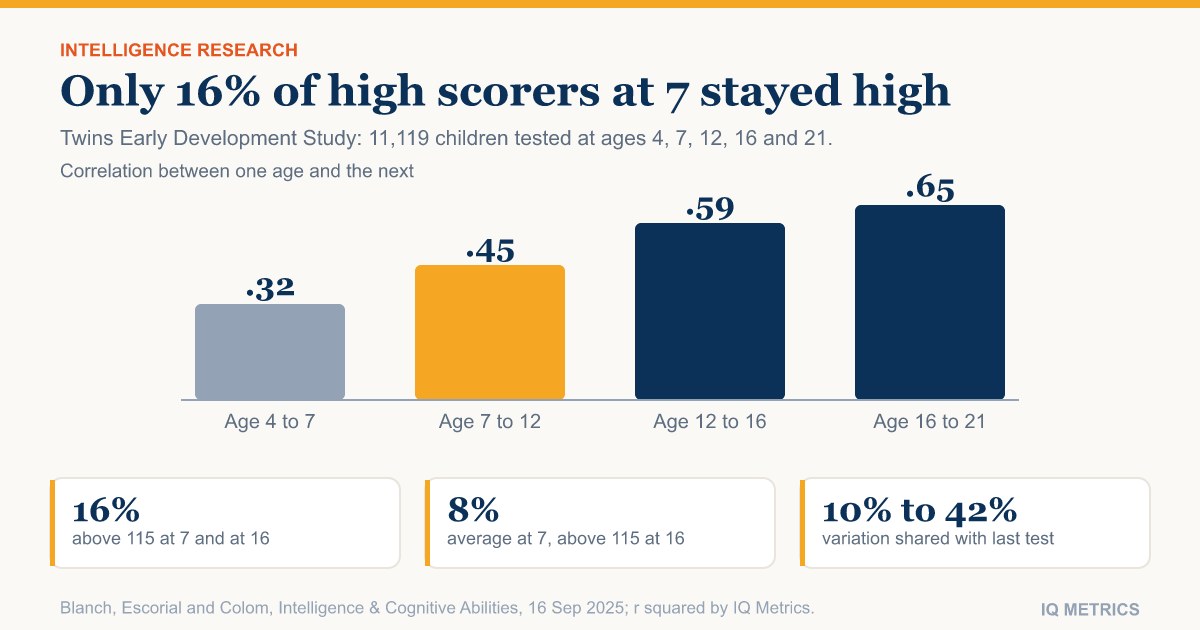
In a study that followed children from age 4 to 21, only 16% of those scoring above 115 at age 7 were still above it at 16. Test-to-test correlations of .32 to .65 explain why an early high score is a snapshot, not a verdict.
Read the research.
Then find your own number.
Our IIF-certified assessment reports your score with its scale, percentile and confidence range — and a breakdown of the cognitive domains behind it.
Start IQ Test →