



Childhood IQ Scores Predict Later Health. Nobody Agrees Why
Almost every eleven-year-old in Scotland sat the same test on the same day in 1932. Decades later those scores turned out to track survival — and the argument about what that means has run ever since.

What you need to know
- On 1 June 1932 nearly every eleven-year-old in Scotland — a little under 90,000 children — sat the same intelligence test on the same day. The exercise was repeated in 1947 with a second cohort.
- When those records were rediscovered and linked to health data in the 1990s, higher childhood scores turned out to be associated with longer survival and with lower death rates from several specific causes.
- Pooled across cohorts, a one-standard-deviation-higher childhood score is associated with roughly a quarter lower risk of death over follow-up. That is a population average, not a prediction about a person.
- Four explanations compete — education and income, health behaviour such as smoking, a bodily "system integrity" marker, and shared genetics — and none accounts for the association on its own.
Most long-running health studies have to reconstruct what their participants were like decades earlier, usually by asking them. One set does not have to. In Scotland the raw material already exists: a national record of how tens of thousands of children performed on the same test, on the same day, before anything else in their lives had happened.
The surveys
On 1 June 1932 the Scottish Council for Research in Education gave a group intelligence test to almost every child in the country born in 1921 — a little under 90,000 eleven-year-olds. The exercise was repeated on 4 June 1947 with children born in 1936, around 70,000 of them. The aim at the time was educational planning. The result, unintentionally, was a near-complete population record of childhood cognitive test performance with a fixed date attached to every entry.
The records were largely forgotten and then rediscovered in the 1990s, at which point they could be linked to Scotland's health and mortality data. That combination — a measured score at eleven, and sixty or more years of subsequent health records on the same named individuals — is close to impossible to construct deliberately. You would have to have started in 1932.
What the linkage showed
Lawrence Whalley and Ian Deary reported in the BMJ in 2001 that childhood mental ability measured at age eleven was associated with survival to age 76. Higher scores, better odds. The research area that grew out of that work was named cognitive epidemiology, and it now spans cohorts in several countries.
A meta-analysis led by Catherine Calvin, published in the International Journal of Epidemiology in 2011, pooled the available cohorts and found that a one-standard-deviation advantage in childhood test score was associated with roughly a quarter lower risk of death across the follow-up periods studied. A later paper from the same group, in the BMJ in 2017, followed the 1936 cohort to age 79 and looked at cause of death rather than death in general. The associations were clearest for cardiovascular disease, stroke, respiratory disease and smoking-related cancers, and weak or absent for several other causes.
That cause-specific pattern is the informative part. An association spread evenly across every cause of death would point at something very general. One that concentrates in cardiovascular, respiratory and smoking-related deaths points at particular pathways, which is a far more tractable question.
A score measured at eleven still carries information about a death sixty years later. What kind of information is the open question.
Four explanations, none of them sufficient
- Education, occupation and income. Higher childhood scores predict more schooling, safer work and more resources, each of which independently affects health. Adjusting for adult socioeconomic position reduces the association substantially — but does not remove it.
- Health behaviour and health literacy. Smoking is the clearest single mediator identified: higher childhood scores predicted both never starting and, more strongly, quitting. Following instructions, sticking with treatment and navigating a health system plausibly load on the same abilities a test measures.
- System integrity. On this account the score is not a cause of anything but a marker — a rough index of how efficiently the whole organism was assembled and maintained, so it indexes bodily robustness rather than producing it.
- Shared genetics. Some of the genetic variation associated with cognitive test performance is also associated with health outcomes, which would produce a correlation with no causal arrow running from one to the other at all.
These are not mutually exclusive, and the honest current position is that all four probably contribute in unknown proportions. Anyone stating the answer confidently is ahead of the evidence.
How stable is the score itself
A related finding from the same records is worth knowing on its own. Some of the 1932 participants were traced and retested in old age, in their seventies and beyond, and the correlation between their score at eleven and their score more than sixty years later was substantial — in the region of 0.6. That is well short of perfect, which means real individual change happens. It is also far higher than most people expect across such a span.
It sets a limit on how much of the health association can be about later-life decline. The ordering established in childhood largely persists, so this is not simply a story about people whose scores fell away.
Why a testing site should care about it
Because it is a rare case where a test score is asked to do something other than sort people, and where the interesting question is what the score is a marker of. The measurement itself is unremarkable: a group test, given to eleven-year-olds, in 1932. What makes it useful eighty years later is that it was administered identically to nearly everyone, on one day, and written down.
That is also the practical lesson. A score is only as good as the conditions and the reference sample behind it, and it keeps its value for decades only when both are documented. A number with no test, no date and no sample attached could not have supported any of this work. For the same point at the level of a single result, see our note on what one number does and does not carry.
Where would your own score land?
The reliable part of this whole literature is boring and generalisable: measure carefully, record the conditions, name the scale, and keep the data. If you want a score of your own worth referring back to, take it under proper conditions once rather than repeatedly under bad ones, and keep the percentile and the confidence range alongside the number.
Find your IQ score now! →Common questions
Does a higher IQ mean you will live longer?
Not for any individual. Across large populations, higher childhood test scores are associated with lower death rates over long follow-up — pooled estimates put it at around a quarter lower risk per standard deviation of childhood score. The spread within every score band is enormous, so the finding says nothing reliable about one person.
What is cognitive epidemiology?
The study of how measured cognitive ability relates to later health and mortality. It took its name in the 2000s and grew largely out of the Scottish Mental Surveys of 1932 and 1947, whose records could be linked to health data decades afterwards.
Why would childhood test scores relate to health at all?
Four explanations compete: better education, work and income; better health behaviour, especially around smoking; the score acting as a marker of general bodily integrity rather than a cause; and genetic variation influencing both. Adjusting for adult socioeconomic position weakens the association without eliminating it, which is why none of the four is accepted as the whole answer.
Does an IQ score measured in childhood stay the same?
Broadly, the ordering does. Participants from the 1932 survey retested in their seventies showed a correlation of around 0.6 with their score at eleven — high for a gap of sixty years, and well short of perfect, which means genuine individual change also occurs.
Sources for this story
- Whalley and Deary, childhood mental ability and survival up to age 76 (2001) — BMJ
- Calvin and colleagues, intelligence in youth and all-cause mortality: systematic review with meta-analysis (2011) — International Journal of Epidemiology
- Calvin and colleagues, childhood intelligence in relation to major causes of death in 68-year follow-up (2017) — BMJ
- Documentation of the Scottish Mental Surveys of 1932 and 1947 and the Lothian Birth Cohorts — University of Edinburgh
- Standards for Educational and Psychological Testing, on norms and score interpretation — American Educational Research Association, American Psychological Association and National Council on Measurement in Education
Corrections: spotted an error? Email corrections@iqmetrics.org and we will update this story and note the change here.
Related stories
All news →Sleep Loss Changes Test Scores. Which Scores Depends on the Test
A bad night does not lower intelligence. It reliably lowers the things a timed test happens to measure most closely — sustained attention, working memory and speed — while leaving vocabulary and general knowledge comparatively intact.
A Century of Rising IQ Scores Has Stalled in Wealthy Countries
Average scores climbed for decades, then flattened and in places slipped. None of it shows on a score report, because every test is reset so the average is 100 again — which is why a 1990 score is not a 2026 score.
Does Dual N-Back Training Raise IQ? What Replications Show
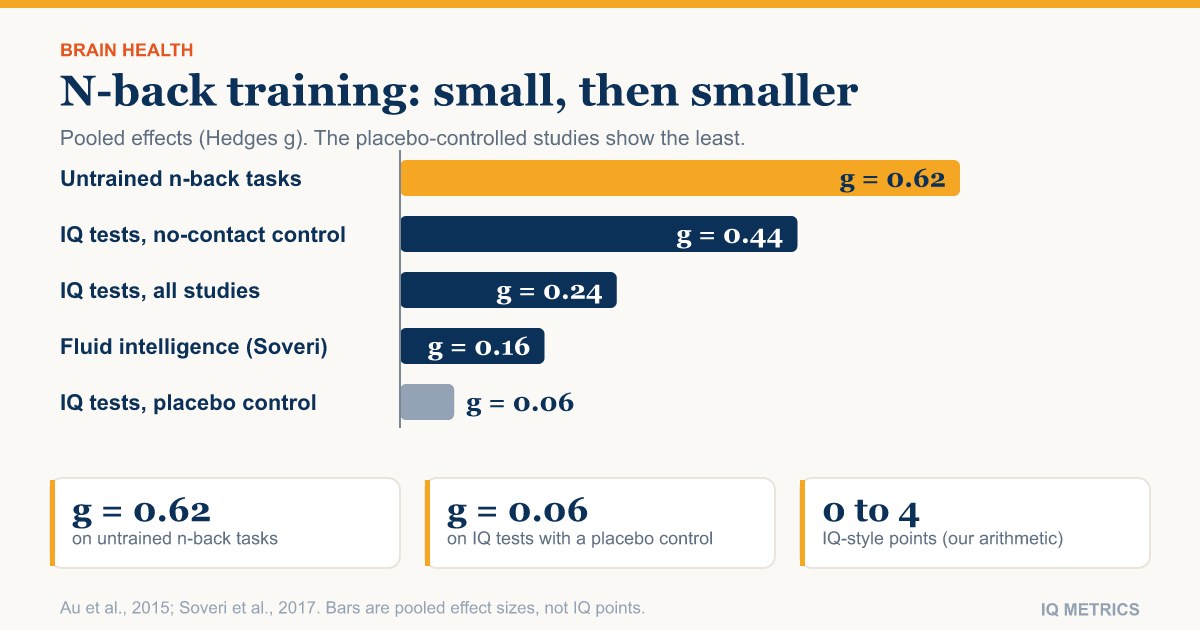
A 2008 PNAS study said dual n-back training raised fluid intelligence. Placebo-controlled replications found nothing, and meta-analyses put the gain at roughly 0 to 4 IQ-style points, smallest where the control group also had a task to do.
Read the research.
Then find your own number.
Our IIF-certified assessment reports your score with its scale, percentile and confidence range — and a breakdown of the cognitive domains behind it.
Start IQ Test →