
Lead, Pollution and IQ: The Exposures That Move Scores
Most things people believe raise or lower intelligence turn out to be small, contested or confounded. Childhood lead exposure is the exception: one of the best-established environmental effects on cognitive test scores anywhere in the literature, with a dose-response curve most people find counterintuitive.
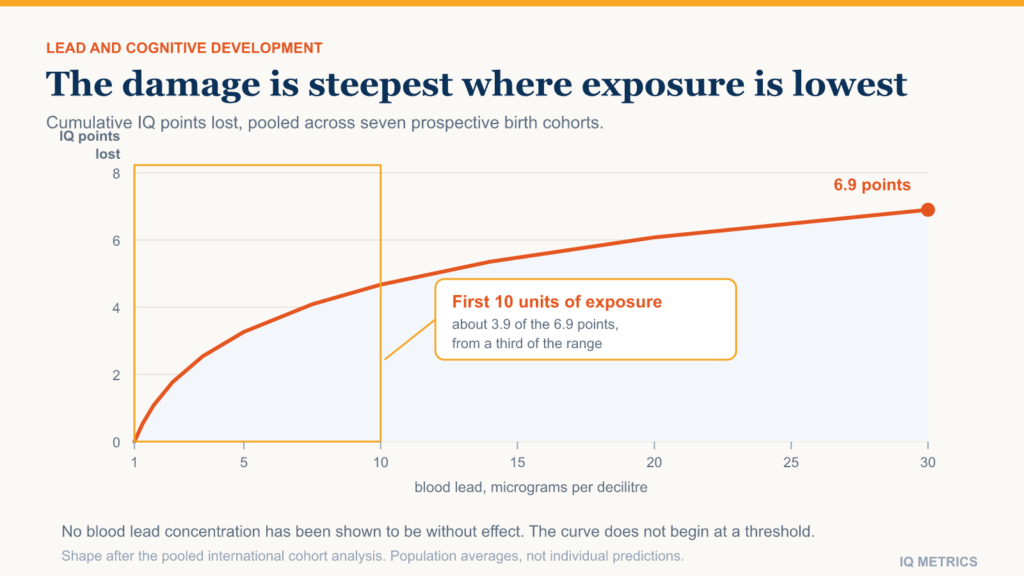
Childhood lead exposure lowers IQ scores, and unlike almost every other environmental claim about intelligence, this one is not seriously disputed. It is supported by prospective cohorts on four continents, by a pooled analysis that combined seven of them, and by a population-scale natural experiment that ran for two decades when leaded petrol was withdrawn. Neither the World Health Organization nor the United States Centers for Disease Control now recognises a blood lead concentration below which no effect is observed.
The part that surprises people is the shape of the curve. The damage is not spread evenly across the range of exposure. Per unit of lead, the steepest loss happens at the lowest concentrations — the ones that were treated as unremarkable for most of the twentieth century. This article sets out what the evidence actually says, how large the effect is in score points, and why none of it tells you anything useful about your own adult test result.
Why a developing brain is the vulnerable target
Lead has no biological function in the human body. It is absorbed because it is chemically similar enough to calcium, iron and zinc to be taken up by the same transport routes, and children absorb a far larger fraction of what they ingest than adults do. Once in circulation it crosses the placenta and the immature blood-brain barrier, and it interferes with processes that are at their most active in early childhood: synapse formation, pruning and the myelination that makes signalling efficient.
That timing is the whole story. The same exposure that produces a measurable cognitive deficit in a two-year-old produces very little in a thirty-year-old, because the thirty-year-old has already built the structures the exposure disrupts. It is one of the clearest cases in the field of a factor that acts on brain development rather than on brain performance, which is also why the effect does not wash out: the deficits found at age five are still there at age ten.
How large is the effect in score points?
The most-cited number comes from a 2005 pooled analysis led by Bruce Lanphear, which combined the raw data from seven prospective cohort studies rather than averaging their published conclusions. Across an increase in blood lead from roughly 2.4 to 30 micrograms per decilitre, it estimated a loss of about 6.9 IQ points, with a confidence interval running from around 4 to 9 points.
Two things about that figure matter more than the figure itself. The first is the shape: the fitted curve is supralinear, meaning the slope is steepest where exposure is lowest. The analysis estimated a loss of roughly 3.9 points across the first stretch — from about 2.4 up to 10 micrograms per decilitre — and less than that across the whole remaining twenty. A child moving from very low to moderately low exposure loses more per unit than a child moving from high to very high.
The second is that this is an average across a population, not a prediction about a person. Four to seven points is a fraction of the ordinary spread of scores, and it sits well inside the measurement error of a single test session. No individual result can be attributed to lead. What the number does describe is what happens to a whole distribution when an entire birth cohort is exposed — and that is a very different quantity, as the next section shows.
The natural experiment nobody designed
Tetraethyl lead was added to petrol from the 1920s and phased out across most of the world between the mid-1970s and the 1990s. In the United States, average blood lead in young children fell from around 15 micrograms per decilitre in the late 1970s to below one today. That is a change of more than ninety per cent, applied to an entire population, over a period short enough to measure.
Applying the pooled dose-response curve to a shift of that size gives an expected gain of several IQ points at the population level, and a much larger proportional change at the tails: shifting a whole distribution upward by even three or four points substantially increases the number of people above any high threshold and reduces the number below any low one. That is the sense in which a small average effect can be a large public health effect.
How much of the twentieth-century rise in raw test scores this explains is genuinely contested. Scores were already climbing before leaded petrol was withdrawn, and the rise is measured across countries with very different exposure histories, so lead is at best one contributor among several — alongside nutrition, schooling and test familiarity. The wider argument about why norms drift is covered in why IQ norms expire. Treat lead as a demonstrated mechanism of the right sign and plausible size, not as the explanation.
Where would your own score land?
Take the IIF-certified assessment and get your score with the scale it was measured on, the percentile it corresponds to and the confidence range around it — the three figures most online tests leave out.
Air pollution and the other exposures
Lead is the exposure with the strongest evidence, not the only one ever studied. Fine particulate matter, prenatal exposure to certain organophosphate pesticides, and manganese in drinking water have all been linked to lower scores on cognitive tests in children. The findings are real enough to take seriously and much weaker than the lead literature, for a reason worth understanding.
- Confounding is severe. Polluted air, older housing and low household income travel together. Separating the exposure from everything else that accompanies it is far harder than for lead, where blood concentration can be measured directly in each child.
- The designs are mostly observational. Almost none of this evidence comes from anything resembling a randomised comparison, and where quasi-experimental designs exist the estimates usually shrink.
- Effect sizes are smaller and less consistent. Where lead studies converge on a similar slope across countries and decades, the pollution literature does not yet converge in the same way.
The honest summary is that lead is established, and the rest is suggestive. That distinction gets lost when all of it is reported as “pollution lowers IQ”, and losing it makes the strong finding look as arguable as the weak ones.
What this does not tell you about your own score
If you have just taken a test and are wondering whether an exposure explains your result, the answer is almost certainly no, for three separate reasons.
- The window has closed. The effect is developmental. Adult exposure at ordinary environmental levels does not produce the same deficits, because the processes it disrupts have finished.
- The effect is smaller than the noise. A few points sit inside the confidence interval of any single administration. Reading a personal history out of one score is not something the measurement supports — see how to read an IQ test report for what the interval around a score actually means.
- Nothing on a test detects it. There is no subtest, index or profile shape that identifies an exposure history. A blood test measures lead; a cognitive test does not.
The useful reading runs the other way. This is one of the few places where the research supports a concrete action — not for the person taking the test, but for a child who has not been exposed yet. It also belongs to a small group of factors that genuinely move population-level scores, alongside the nutritional deficiencies covered in nutrition and IQ. Most of what gets sold as a way to raise intelligence does not belong in that group at all.
Where this sits in the wider picture
Debates about intelligence tend to be framed as heredity against environment, as though a finding on one side subtracts from the other. Lead is a clean illustration of why that framing fails. Heritability estimates are computed within a population at a given time, and they say nothing about what a change in conditions would do — a point set out in is IQ genetic. A population can have high heritability for a trait and still shift substantially when a specific environmental insult is removed from everybody. That is roughly what happened.
It also sets a realistic bar for every other environmental claim. Lead has a measurable dose in each individual, a plausible biological mechanism, a consistent slope across countries, a dose-response relationship, and a population-scale removal that went the predicted way. When something else is described as changing intelligence, that is the standard of evidence worth asking for. Most candidates meet almost none of it — and the general list of things that shift a result on the day is covered in what affects IQ test results.
Keep reading
 Research & Evidence
Nutrition and IQ
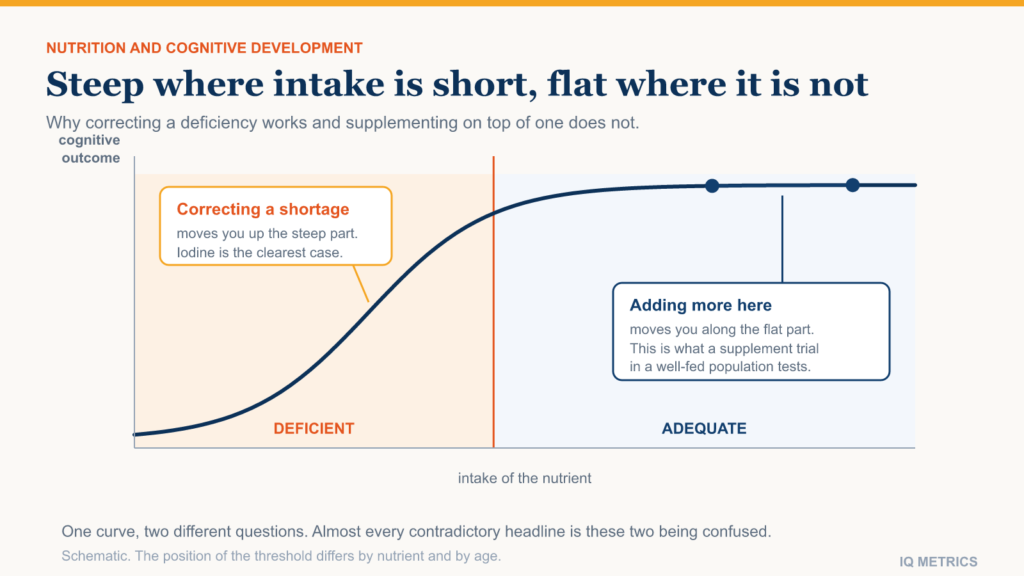
The evidence on diet and intelligence looks contradictory until you separate two questions that get asked as one. Fixing a real deficiency produces some of the largest effects in the field. Adding more of the same nutrient to an already adequate diet produces close to nothing.
 Research & Evidence
Is IQ Genetic?
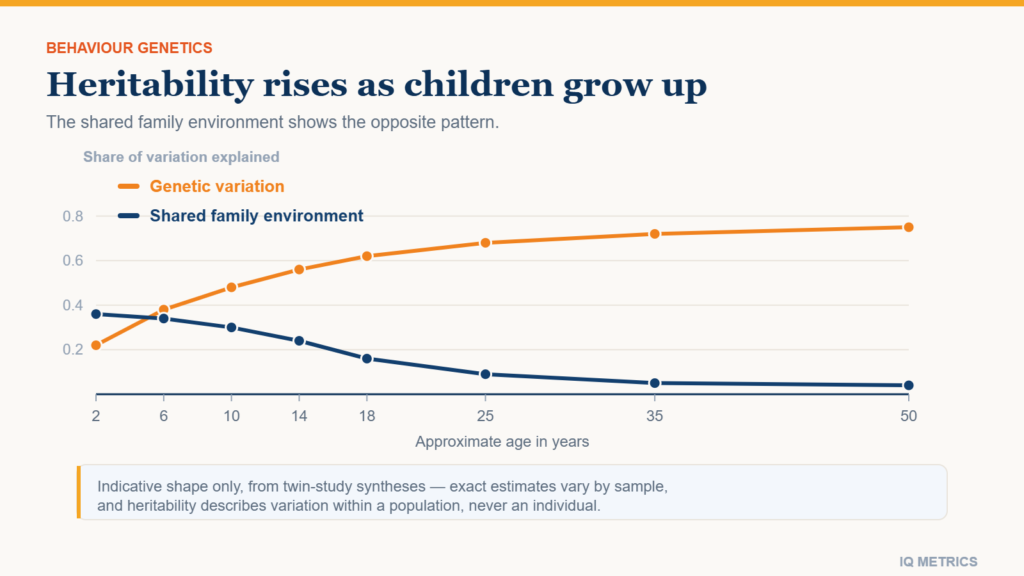
Heritability estimates for IQ rise from roughly 0.4 in childhood to 0.7 or higher in adulthood, which sounds decisive until you know what heritability measures. Here is what twin and adoption studies actually show, and the four conclusions people draw from them that the statistic does not support.
 Research & Evidence
What are the Factors that Affect the Results of an IQ Test?
When you take an IQ test, do you ever find yourself wondering why certain people do better than others? It turns out that your IQ can be affected by a lot of different things. Discover the hidden meaning of these characteristics and how they affect your intelligence in this essay