IQ Metrics
IIF Certified Assessment Start IQ Test
IIF Certified Assessment

What an IQ of 70 Means

Scores & Scales

What Does an IQ of 70 Mean? Why the Line Is Really a Zone

An IQ of 70 sits two standard deviations below the mean, at about the 2nd percentile. It is the score most often linked with intellectual disability, but a diagnosis never rests on the number alone: measurement error turns the line into a zone, and adaptive functioning decides who is inside it.

Bell curve with the lower tail shaded below IQ 70 and a highlighted band from 65 to 75 showing the measurement-error zone around the score.

An IQ of 70 is two standard deviations below the population mean. On a test scaled to a mean of 100 and a standard deviation of 15, that places it at about the 2nd percentile: roughly 2.3% of people score 70 or lower, which is about one person in 44.

It is also the score most often linked with intellectual disability, and that is where most of the confusion starts. Current diagnostic criteria do not treat 70 as a hard cut-off. They treat the region around it, about 65 to 75 once measurement error is counted, as a zone where the deciding evidence is how a person actually manages everyday life. This article covers what an IQ of 70 means for adults and children, what it does not mean, and what to do with one.

Where does an IQ of 70 sit?

IQ scores describe position, not quantity. A 70 is 30 points below the mean of 100, and on a standard deviation 15 scale that is exactly two standard deviations.

  • 2nd percentile: about 2.3 people in 100 score at or below 70, and about 97.7 score above it.
  • 1 in 44 people score 70 or lower.
  • On a test that uses a standard deviation of 16, a 70 is slightly less unusual: about 3% of people score at or below it.

Test manuals attach different words to the same score. On the WISC-V, 70 is the bottom of the Very Low band (70 to 79), and 69 or below is Extremely Low. Older Wechsler editions called the 70 to 79 band Borderline, which is why that word still turns up in reports.

The curve is symmetric, so 70 is exactly as far below the mean as 130 is above it, and exactly as common. The IQ percentile calculator places any score on the same curve, and what an IQ of 85 means covers the low average band a full standard deviation higher.

Is an IQ of 70 an intellectual disability?

Not by itself. Under the DSM-5-TR, a diagnosis of intellectual developmental disorder (intellectual disability) needs three things together:

  • Deficits in intellectual functions such as reasoning, problem solving and learning, confirmed by clinical assessment and individually administered standardized testing.
  • Deficits in adaptive functioning: everyday conceptual, social and practical skills, compared with others of the same age and background.
  • Onset during the developmental period, meaning childhood or adolescence.

The intellectual criterion is scores about two standard deviations below the mean, which the manual puts at roughly 65 to 75 once measurement error is allowed for, and the American Psychiatric Association adds that clinicians should not be bound narrowly to that range. Severity — mild, moderate, severe or profound — is defined by adaptive functioning, not by IQ scores. The World Health Organization’s ICD-11 uses the same two-standard-deviation line (about the 2.3rd percentile), and the American Association on Intellectual and Developmental Disabilities requires the disability to begin before age 22.

So two people who both score 70 can receive different conclusions. Someone who struggles with communication, money and self-care may meet the criteria; someone who manages work, bills and relationships independently may not. According to the American Psychiatric Association, intellectual disability affects about 1% of the population, and about 85% of those people are in the mild range.

Bell curve with the lower tail shaded below IQ 70 and a highlighted band from 65 to 75 showing the measurement-error zone around the score.

Why 70 is a zone, not a line

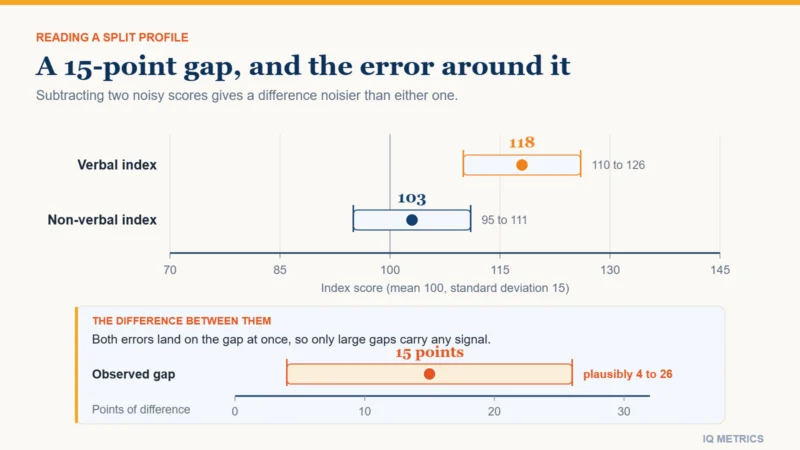
Every test score carries measurement error. For full-scale IQ on the major Wechsler tests the standard error is about 3 points, so publishers report a 95% confidence interval roughly 10 to 11 points wide, leaning slightly back toward 100. A measured 70 is best read as a true score probably somewhere between the mid 60s and the mid 70s, which is why the diagnostic manual’s own range is 65 to 75. An IQ score is a range, not a number walks through the arithmetic.

The US Supreme Court turned that point into law in Hall v. Florida (2014). By 5 votes to 4 it struck down a Florida rule that treated any score above 70 as final, holding that when a score falls within the test’s margin of error, the person must be allowed to present other evidence of intellectual disability, including evidence about adaptive functioning.

What is the mental age of someone with an IQ of 70?

The question comes from the original IQ formula: mental age divided by chronological age, multiplied by 100. On that old ratio scale, a 10-year-old who performed like an average 7-year-old scored 70, and for children it still gives a rough picture of where test performance sits.

For adults the idea breaks down. Raw test performance stops climbing in the late teens, so dividing by an adult’s age produces nonsense, which is one reason modern tests replaced the ratio with deviation scores (see deviation IQ vs ratio IQ). The figure that circulates online, a mental age of about 11 for an adult with an IQ of 70, comes from multiplying 0.7 by an assumed adult ceiling of 16. It describes test items, not a person. An adult who scores 70 still has adult experience, adult interests and adult relationships, and often practical skills that no test item measures.

Your own number

Where would your own score land?

Take the IIF-certified assessment and get your score with the scale it was measured on, the percentile it corresponds to and the confidence range around it — the three figures most online tests leave out.

Find your IQ score now!

Secure & encryptedInstant results10–20 minutes

What can a person with an IQ of 70 do?

A great deal, and the range between people is wide. Most people with intellectual disability are in the mild range, and a 2015 National Academies report describes people with mild intellectual disability as able to learn practical life skills that let them function in ordinary life with minimal support. The American Association on Intellectual and Developmental Disabilities adds that with the right personalized supports over time, life functioning generally improves.

Jobs follow fit rather than a number. No score closes a particular career by itself; what matters is how the demands of a role match a person’s adaptive skills, and how much support comes with it. Support tends to matter most for complex, high-stakes tasks such as contracts, large financial decisions and unfamiliar paperwork. A score of 70 does not cap what someone can learn; it describes how much explicit teaching and practice new skills are likely to take.

When a 70 is a measurement problem

A low score can reflect the testing situation as much as the person. Before treating a 70 as a finding, a careful assessor rules out:

An online IQ test cannot diagnose intellectual disability. Diagnosis needs an individually administered standardized test and an assessment of adaptive behavior, carried out by a qualified professional; professional IQ tests covers the instruments psychologists use.

Where an IQ of 70 matters in law and benefits

Because 70 appears in legal and administrative definitions in the United States, a few points can carry real consequences:

  • Atkins v. Virginia (2002): by 6 votes to 3, executing people with intellectual disability violates the Eighth Amendment. The Court set no score cut-off and left enforcement to the states.
  • Hall v. Florida (2014): a strict line at 70 is unconstitutional when a score falls within the margin of error.
  • Moore v. Texas (2017): courts may not ignore current medical standards when deciding whether someone has intellectual disability.
  • Social Security: the adult listing for intellectual disorder (12.05) includes a full scale IQ of 70 or below, or 71 to 75 with a verbal or performance score of 70 or below, alongside marked or extreme limits in mental functioning and evidence the disorder began before age 22.
  • Special education: under IDEA, intellectual disability means significantly subaverage general intellectual functioning together with deficits in adaptive behavior, appearing during the developmental period and affecting educational performance. The law names no IQ number.

Test age matters too. Outdated norms tend to inflate scores, the Flynn effect, so an old test can put someone above 70 who would score below it on a current edition. Some experts adjust older scores for this, but courts are divided on whether that is required, which is one more reason the same person can be described as above or below 70 depending on the test and the year.

IQ scores between 70 and 85

Scores from about 71 to 84 are often described as borderline intellectual functioning. That range comes from the older DSM-IV; the current manual lists borderline intellectual functioning only as a condition that may be a focus of clinical attention, not as a disorder, and gives it no score range. People in this band usually do not qualify for disability-based support, yet they can find school, complex jobs and paperwork genuinely hard, which is worth recognizing even without a diagnosis.

If you or your child scored 70

Treat the number as a reason for a full assessment, not a verdict. Ask for the confidence interval and the index scores, check hearing, vision, language and health, and make sure adaptive behavior was measured with a standardized tool rather than inferred from the IQ.

For a child, a diagnosis can open access to school support and early services, and skills in this range respond well to explicit teaching. For an adult, the most useful result of an assessment is usually a clear map of which tasks need support and which do not. Down syndrome and IQ covers one of the most common genetic causes of intellectual disability, and what an IQ of 140 means shows the same distance from the mean in the other direction.

Share this article

Know someone who keeps seeing these numbers quoted without the scale they were measured on? Send it to them.

Tagged adaptive functioning, borderline intellectual functioning, confidence interval, diagnosis and assessment, full scale iq, intellectual disability, iq classifications, iq percentile, IQ Score, iq test ranges, Measurement Error, mental age, percentile rank, standard deviation iq

What an IQ of 140 Means

Scores & Scales

What Does an IQ of 140 Mean? Rarer Than 1 in 250

An IQ of 140 sits 2.67 standard deviations above the mean, at about the 99.6th percentile: roughly one person in 261 scores that high. It clears the gifted line and most high-IQ society cutoffs, but no current test manual calls it genius, and a single 140 is far less exact than the number suggests.

Bar chart showing that an IQ of 140 is reached by 1 in 261 people on a standard deviation 15 scale, 1 in 161 on SD 16 and 1 in 21 on SD 24.

An IQ of 140 is very rare. On a test scaled to a mean of 100 and a standard deviation of 15 — the scale used by the Wechsler tests and the Stanford-Binet 5 — a 140 sits 2.67 standard deviations above the mean, at about the 99.6th percentile. Roughly one person in 261 scores 140 or higher.

That puts 140 in the gifted range on every major test. It is not, on any current test manual, a “genius” score, and the same number means something quite different on a test built on a wider scale. This article covers how rare an IQ of 140 really is, what the manuals call it, how much a single 140 can be trusted, and what it does and does not predict.

How rare is an IQ of 140?

IQ scores describe position, not quantity. A test is normed on a large representative sample, the middle of that sample is set at 100, and one standard deviation is set at 15 points. A 140 is 40 points above the middle, which is 2.67 standard deviations, and on a normal curve that leaves about 0.38% of people at or above it.

  • 99.6th percentile: about 996 people in 1,000 score below 140.
  • 1 in 261 people score 140 or higher.
  • About 380,000 people in a country of 100 million, and on the same arithmetic roughly 31 million worldwide.

Rarity climbs steeply from here, which is why the 140s are not one band but ten quite different levels of rarity. Each extra point removes a larger share of the people still left above it. The IQ percentile calculator places any score on the same curve.

IQ percentile chart for scores of 140 to 149 (standard deviation 15)
IQ score Percentile At or above
140 99.62nd 1 in 261
141 99.69th 1 in 319
142 99.74th 1 in 391
143 99.79th 1 in 482
144 99.83rd 1 in 596
145 99.87th 1 in 741
146 99.89th 1 in 924
147 99.91st 1 in 1,157
148 99.93rd 1 in 1,455
149 99.95th 1 in 1,838

A 145 is almost three times rarer than a 140, and a 149 about seven times rarer. The same acceleration explains the gap below: a 130, the usual gifted threshold, is reached by one person in 44, while 140 is reached by one in 261.

Is 140 IQ genius?

No current intelligence test has a band called genius. The label comes from the first American revision of the Binet scale: in 1916 Lewis Terman described scores above 140 as “near genius or genius,” while calling his own boundary lines “absolutely arbitrary.” Terman dropped the word by the 1937 revision and no major test since has used it, but the number stuck, and it is why 140 is still the figure most often quoted as the genius line.

What the manuals say today is more careful:

  • WAIS-IV (adults): 130 and above is Very Superior.
  • WISC-V (children): 130 and above is Extremely High.
  • Stanford-Binet 5: 130 to 144 is gifted or very advanced; 145 to 160 is very gifted or highly advanced.

Researchers who work with gifted children use finer bands. In Miraca Gross’s widely used scheme, 130 to 144 is moderately gifted and 145 to 159 highly gifted, so a 140 sits near the top of the moderate band. Terman’s own long-running study of 1,528 high-scoring children shows how loosely “genius” fits a test score: two boys who were tested but did not make the cut, William Shockley and Luis Alvarez, both later won the Nobel Prize in Physics, and none of the children who were selected ever won one.

Bar chart showing that an IQ of 140 is reached by 1 in 261 people on a standard deviation 15 scale, 1 in 161 on SD 16 and 1 in 21 on SD 24.

A 140 on one test is not a 140 on another

Every IQ score belongs to a scale, and the scale is set by the standard deviation the test uses. Most modern clinical tests use 15. Some older tests and many online quizzes use 16 or 24, and on those scales a 140 is a much more common result.

What a score of 140 means on three scales
Scale Percentile of 140 At or above Same position on SD 15
SD 15 (Wechsler, Stanford-Binet 5) 99.6th 1 in 261 140
SD 16 (older Stanford-Binet forms) 99.4th 1 in 161 about 137
SD 24 (Cattell scale) 95.2nd 1 in 21 about 125

A 140 on a standard deviation 24 test sits where a 125 sits on the Wechsler scale: well above average, but short of the usual gifted line. Mensa’s own entry table shows the same effect from the other direction: the top 2% it requires is a 130 on the Wechsler tests but a 148 on the Cattell scale. The IQ score converter moves a score between scales, and why one percentile carries three numbers explains where the different scales came from.

How precise is a score of 140?

Less precise than it looks. Every score carries a standard error of measurement, so test publishers report a 95% confidence interval about 10 to 11 points wide, and for high scores that interval leans back toward the average. Pearson’s own WISC-V sample report shows a full-scale 132 with an interval of 125 to 136. Worked the same way, a measured 140 is best read as a true score probably somewhere between about 133 and 144. An IQ score is a range, not a number shows how that interval is built.

Three things add extra uncertainty to scores this high:

  • Thin norms at the top. The WAIS-IV was normed on 2,200 people. On a normal curve only about eight of them would score 140 or higher, so the top of the scale rests on very few real test-takers.
  • Regression to the mean. Part of any extreme score is luck on the day, so retested high scorers usually come back a little lower even though nobody lost any ability. In a worked example by researchers David Lohman and Katrina Korb, a 130 on a test with a retest correlation of 0.8 is expected to return as about 124; regression to the mean explains why.
  • Old norms. Scores on the modern Wechsler and Stanford-Binet tests drifted upward by close to three points a decade as their norms aged (Trahan and colleagues, 2014), so an outdated edition can flatter a result. See why IQ norms expire.

None of this makes a 140 meaningless. It means the honest statement is a range with a probable center, which is how a proper IQ test report presents it.

Your own number

Where would your own score land?

Take the IIF-certified assessment and get your score with the scale it was measured on, the percentile it corresponds to and the confidence range around it — the three figures most online tests leave out.

Find your IQ score now!

Secure & encryptedInstant results10–20 minutes

What does an IQ of 140 predict?

For groups, quite a lot. The Study of Mathematically Precocious Youth followed 2,385 children who all scored in the top 1% on the math section of the SAT at age 13. Twenty-five years later, 33.2% of the top quarter of that group had earned a doctorate, against 15.4% of the bottom quarter, and the top quarter were about six times as likely to hold a patent (Robertson and colleagues, 2010). It was a math reasoning test rather than an IQ test, but the lesson carries over: even inside the top 1%, more ability still made a measurable difference.

For one person, much less. A single score accounts for only a modest share of the differences in income between people, and Terman’s selected children mostly grew into healthy, well-educated professionals rather than a run of historic discoveries. Interests, effort, opportunity and health decide much of what a 140 cannot.

Does 140 qualify for Mensa and other high-IQ societies?

For most of them, yes. Societies set their entry rules as percentiles rather than raw scores, which is why the qualifying number changes from test to test:

  • Mensa: the 98th percentile, which is 130 on the Wechsler tests. A 140 qualifies.
  • Intertel: the 99th percentile, about 135 on a standard deviation 15 scale. A 140 qualifies.
  • Triple Nine Society: the 99.9th percentile, about 146. A 140 falls short.
  • Prometheus Society: the 99.997th percentile, roughly 1 in 30,000 or about 160. A 140 is far short.

High-IQ societies explained covers what each group accepts as evidence, and Mensa’s score requirements lists the qualifying score test by test.

A child who scores 140 and an adult who scores 140

Statistically the two mean the same thing, because every age group is scored against its own norms. In practice they behave differently. Scores in early childhood are noticeably less stable than adult scores, so a young child’s 140 is a strong reason to support and stretch that child rather than a permanent ranking. Many schools set their gifted line at 130, which a 140 clears with room to spare; gifted cutoff scores explains why a single line still misses children it should find.

Why so many online tests say 140

Scores in the 140s are the most common “high” result on unsupervised online quizzes, and famous people are routinely credited with numbers in the same range. Neither usually has a norm sample behind it. A quiz can choose its own mean and spread, publish no standard deviation at all and let people retake it until the number looks right, and most celebrity IQ figures trace back to no test whatsoever. The word genius travels just as loosely, all the way to rankings of dog breeds.

Before trusting a 140, check three things: which scale produced it, how large and how recent the norm sample was, and what confidence range came with it.

If you scored 140

Read it as a range: probably somewhere in the low 130s to mid 140s on the scale your test used, a genuinely high result shared by roughly one person in a few hundred. Check the standard deviation before comparing it with anyone else’s score, keep the confidence interval attached when you quote it, and treat a professionally administered result as far stronger evidence than a one-off online quiz.

The mirror-image score sits exactly as far below the mean: an IQ of 70 is just as rare as a 140, and it shows even more clearly why a single number is only the start of an assessment.

Share this article

Know someone who keeps seeing these numbers quoted without the scale they were measured on? Send it to them.

Tagged confidence interval, genius iq level, gifted cutoff, gifted identification, high iq societies, iq classifications, iq percentile, iq scale, IQ Score, iq test ranges, Measurement Error, mensa, percentile rank, Regression to the Mean, standard deviation iq

Down Syndrome and IQ

Understanding IQ

Down Syndrome and IQ: What the Typical Range Really Means

Most people with Down syndrome score in the mild to moderate range of intellectual disability, with an average IQ of around 50 and a typical range of about 30 to 70. The number hides a wide spread, a consistent profile of strengths, and test limits that matter more here than almost anywhere else.

Chart of the cognitive profile often seen in Down syndrome: relative strengths in visual and social skills, relative weaknesses in verbal memory, expressive language and executive function.

Most people with Down syndrome score in the mild to moderate range of intellectual disability. Research reviews put the average IQ at around 50, with a typical range of roughly 30 to 70. The American Academy of Pediatrics describes the intellectual impairment as sometimes mild (IQ 50 to 70), usually moderate (IQ 35 to 50) and occasionally severe (IQ 20 to 35).

Those figures describe a group, and the people in it vary enormously. IQ tests are also less precise at this end of the scale than anywhere else. This article covers the typical Down syndrome IQ range and why it is so wide, whether someone with Down syndrome can score higher, the pattern of strengths behind the number, and what an IQ score cannot tell a family.

What is the average IQ of a person with Down syndrome?

A 2015 review of cognition across the lifespan (Grieco and colleagues, American Journal of Medical Genetics) gives a typical IQ of about 30 to 70 and a mean of about 50, with individual scores reaching from the profound range up to the borderline range. An IQ of 50 is more than three standard deviations below the general-population mean of 100.

The American Academy of Pediatrics’ 2022 clinical guidance breaks the same picture into bands:

  • Mild (IQ about 50 to 70): sometimes.
  • Moderate (IQ about 35 to 50): the most common.
  • Severe (IQ about 20 to 35): occasionally.

Two cautions apply. Current diagnostic manuals grade the severity of intellectual disability by adaptive functioning, not by IQ bands, so these ranges describe test scores rather than a diagnosis (what an IQ of 70 means explains how that works). And Down syndrome is common enough for the averages to be well studied: the CDC estimates it occurs in about 1 in every 640 babies in the United States, roughly 5,700 a year.

Why the Down syndrome IQ range is so wide

Several things spread scores out, and they interact:

  • The type of Down syndrome. About 96% of people have standard trisomy 21, with an extra copy of chromosome 21 in every cell. About 3 to 4% have translocation Down syndrome, and 1 to 2% have mosaic Down syndrome, in which only some cells carry the extra chromosome.
  • Health. Hearing loss, sleep apnea, vision problems and thyroid disease are all common, and each can pull test performance down.
  • Co-occurring conditions. Some people with Down syndrome are also autistic, which changes both the profile and how testing goes.
  • Individual differences. As in any group, people differ in temperament, interests, schooling and support.

Can someone with Down syndrome have an average IQ?

Scores in the average range are not part of the typical picture. The research literature describes scores reaching up into the borderline range, just below average, but it gives no reliable figure for how often that happens.

Higher scores are reported more often in mosaic Down syndrome. In a 1991 study that matched 30 people with mosaicism to 30 people with trisomy 21, the mosaic group’s average IQ was significantly higher, with stronger verbal and visual-perceptual skills (Fishler and Koch). A 2015 review found that most, but not all, studies agree, that the samples are small, and that a higher share of cells carrying the extra chromosome tends to go with lower scores (Papavassiliou and colleagues).

The ranges overlap, though. Some children with trisomy 21 outscore some children with mosaicism, and people who are only mildly affected by mosaicism may never be diagnosed at all, which can make the average gap look bigger than it really is. The American Academy of Pediatrics sums it up carefully: people with mosaicism may be more mildly affected, but this is not always the case.

The profile behind the number

A full-scale IQ blends very different abilities into one figure, and in Down syndrome the pattern underneath is unusually consistent. The Grieco review describes:

  • Relative strengths: visuospatial processing, visual short-term memory, nonverbal learning and memory, understanding of single words, and social engagement.
  • Relative weaknesses: verbal short-term memory, expressive language and grammar, speech clarity, and executive functions such as planning and flexible thinking, which tend to become more affected with age.

In the review’s words, expressive language is delayed relative to comprehension. Many people understand far more than they can say, which matters on any test item that needs a spoken answer. It is also why the index scores in a report usually say more than the full-scale total, and why working memory and reasoning are worth reading separately.

Chart of the cognitive profile often seen in Down syndrome: relative strengths in visual and social skills, relative weaknesses in verbal memory, expressive language and executive function.
Your own number

Where would your own score land?

Take the IIF-certified assessment and get your score with the scale it was measured on, the percentile it corresponds to and the confidence range around it — the three figures most online tests leave out.

Find your IQ score now!

Secure & encryptedInstant results10–20 minutes

Why IQ scores can fall during childhood

Parents are sometimes told that a child’s IQ dropped between two assessments. Grieco and colleagues explain what is usually happening: although standardized scores appear to fall, raw scores show the child is still gaining skills, at a slower rate than same-age peers. An IQ compares a child with others of the same age, so steady progress that is slower than typical produces a lower standard score. It is not a loss of skills. IQ testing for children covers why childhood scores move in general.

How IQ tests work at the low end of the scale

Most intelligence tests, including the Wechsler scales and the Stanford-Binet, do not report IQ scores below 40. When many test-takers hit that floor, the test stops telling them apart: in one longitudinal study using the Stanford-Binet with people who have Down syndrome, more than a third scored at the floor. It is the mirror image of the ceiling effect at the top of the scale.

Researchers have built workarounds. A method published in 2014 turns raw scores into deviations from general-population norms, so scores below 40 can still be distinguished (Sansone and colleagues, first used with fragile X syndrome and autism). A 2026 study of 276 people with Down syndrome aged 6 to 61 found floor effects on both the KBIT-2 and the Stanford-Binet 5, and that the level of intellectual disability a person was assigned depended partly on which test was used (Schworer and colleagues). The practical lesson is that one score from one test is an estimate, and the choice of test matters. Professional IQ tests describes the main instruments.

Health problems that can lower a score

The American Academy of Pediatrics’ 2022 health supervision guidance lists conditions that are common in Down syndrome and that can affect performance on any test:

  • Hearing loss: about 75% of people.
  • Obstructive sleep apnea: 50 to 79%.
  • Eye problems: 60 to 80%.
  • Thyroid disease: 24 to 50%.

Undetected hearing loss or poor sleep can make a test look like a measure of ability when it is partly a measure of hearing or tiredness. Hearing loss changes cognitive test scores, and sleep and IQ covers the second effect. Checking both before a cognitive assessment is simply good practice.

IQ in adulthood and later life

Lifespans have lengthened dramatically. The CDC reports that in 1960 people with Down syndrome lived to about 10 years old on average, and the American Academy of Pediatrics now puts life expectancy at around 60. Longer lives bring a new cognitive question, because Down syndrome carries a high risk of Alzheimer’s disease.

By age 40, most people with Down syndrome have the amyloid plaques and tau tangles linked to Alzheimer’s, according to the National Institute on Aging. In a 2020 Lancet study of 388 adults, the median age at dementia diagnosis was 53.7 (Fortea and colleagues). That is one reason a record of each adult’s own thinking and daily-living skills is so valuable: later changes can be measured against the person’s own baseline rather than against population norms that were never built for them.

What an IQ score does not tell families

Everyday functioning often runs ahead of test results. The American Academy of Pediatrics notes that people with Down syndrome often function more effectively in social situations than cognitive assessment results would predict, unless autism is also present. A study using the Vineland adaptive behavior scales found communication to be a relative weakness next to daily living and social skills (Dykens, Hodapp and Evans, 2006).

Work is part of adult life for many. In a 2016 survey of 511 US adults with Down syndrome, 56.6% had paid jobs, although only 3% worked full time, and the participants chose to take part, so the figure is not a national rate (Kumin and Schoenbrodt). Early intervention improves developmental outcomes, according to the National Institutes of Health, but it has not been shown to raise IQ scores permanently: the short-term gains in early studies tended to fade.

An IQ score is one input to planning, useful for describing how someone learns best right now. It does not set a ceiling on reading, work, relationships or independence. For how other conditions interact with testing, see ADHD, autism and dyslexia in IQ testing and fetal alcohol spectrum disorder and IQ.

Share this article

Know someone who keeps seeing these numbers quoted without the scale they were measured on? Send it to them.

Tagged adaptive functioning, child development, child iq testing, cognitive development, dementia risk, diagnosis and assessment, down syndrome, early intervention, intellectual disability, IQ Science, neurodevelopmental disorder, Test Accommodations, trisomy 21, Working Memory

Dog IQ

Understanding IQ

Dog IQ: What Canine Intelligence Tests Actually Measure

Dogs do not have an IQ: no validated test gives them one. Researchers can measure trainability, memory, self-control and a small general factor, and those results say more about how dogs think than any breed ranking, at-home dog IQ test or "as smart as a toddler" comparison ever could.

Bar chart of breed-level heritability for four dog cognitive abilities: inhibitory control 0.70, communication 0.39, physical reasoning 0.21 and memory 0.17.

Dogs do not have an IQ score. No validated intelligence test produces one, and the researchers who study canine cognition say plainly that a dog IQ test with good measurement properties still does not exist (Arden, Bensky and Adams, 2016). What they can measure is a set of separate abilities — learning commands, remembering, holding back an impulse, following a human point — and some of those results are genuinely revealing about how dogs think.

The comparison people usually reach for, that an average dog is about as smart as a two-year-old child, comes from a conference talk rather than a study, and it measures something narrower than it sounds. This article covers what dog intelligence research actually shows, how dog IQ compares to human intelligence, which breeds learn fastest, and what an at-home dog IQ test can and cannot tell you.

Is there a real dog IQ test?

Not in the sense a person takes one. A human IQ test is normed on thousands of people, so a score says where someone stands against a representative sample; how IQ tests work explains the method. Nothing equivalent exists for dogs. When Rosalind Arden and her colleagues reviewed the field in 2016, they found only three studies of individual differences in dog cognition published since 1911.

Researchers instead use batteries of separate tasks, such as the citizen-science Dognition games, and report each ability on its own. Any website that gives your dog a single IQ number has invented the scale.

How smart are dogs compared to humans?

The most quoted answer comes from psychologist Stanley Coren, speaking at the American Psychological Association’s 2009 convention. He said the average dog can learn about 165 words, including signals, that the top 20% of dogs can learn about 250, and that dogs’ mental abilities are close to those of a human child aged 2 to 2.5 years. He added that dogs can count to about four or five.

Two cautions apply. It was a talk, not a peer-reviewed study, and other estimates are lower: a Dalhousie University survey of 165 owners found their dogs responded to between 15 and 215 words and phrases, 89 on average. And “as smart as a two-year-old” is a mental-age comparison, the same idea behind the original IQ formula, which psychologists dropped for humans because one age equivalent hides very uneven abilities (see deviation IQ vs ratio IQ). A dog far outperforms a toddler at tracking by smell, and cannot begin to match a toddler’s grammar.

Which dog breeds are the smartest?

The famous ranking comes from Coren’s 1994 book The Intelligence of Dogs, built on a survey of 199 obedience-trial judges from the American Kennel Club and the Canadian Kennel Club. It ranks only what Coren called working and obedience intelligence: how fast a breed learns a new command and how reliably it obeys. Top-tier breeds learn a new command in fewer than five repetitions and obey the first command at least 95% of the time.

The top 10 breeds for working and obedience intelligence, Coren (1994)
Rank Breed
1 Border Collie
2 Poodle
3 German Shepherd
4 Golden Retriever
5 Doberman Pinscher
6 Shetland Sheepdog
7 Labrador Retriever
8 Papillon
9 Rottweiler
10 Australian Cattle Dog

The judges largely agreed at the top: 190 of the 199 put the Border Collie in their top ten. At the other end Coren placed the Afghan Hound last, with the Basenji, Bulldog, Chow Chow and Borzoi just above it. Because the list measures trainability, it says more about how readily a breed works with a handler than about how well its dogs solve problems on their own.

Breed also explains less than any ranking suggests. A 2022 study in Science of 18,385 dogs, 2,155 of them genotyped, found that breed explains just 9% of behavioral variation between individual dogs (Morrill and colleagues). The dog in front of you can sit a long way from its breed’s average.

Some abilities do track breed. Using Dognition data on more than 7,000 purebred dogs from 74 breeds, a 2019 study found that breeds with larger brains did better on short-term memory and self-control, though not on the other tasks, with brain size estimated per breed rather than measured in each dog (Horschler and colleagues). That is a breed-level pattern, not a rule that bigger dogs are smarter; brain size and IQ shows how modest the same link is in humans.

Bar chart of breed-level heritability for four dog cognitive abilities: inhibitory control 0.70, communication 0.39, physical reasoning 0.21 and memory 0.17.

A 2020 study of 1,508 dogs across 36 breeds put numbers on it. Breed-level heritability was 0.70 for inhibitory control, 0.39 for communication, 0.21 for physical reasoning and 0.17 for memory (Gnanadesikan and colleagues). In other words, self-control runs strongly in breeds, while memory barely does.

Do dogs have a g factor?

The most IQ-like result in dog research is a general factor. Rosalind Arden and Mark Adams tested 68 working border collies on farms in Wales, using detour puzzles, following a human point and choosing the larger amount of food (Intelligence, 2016). Dogs that solved the detour tasks quickly also tended to do well on the choice tasks, and the best statistical model placed one general factor above three narrower ones — the same structure psychologists call the g factor in humans.

The caveats keep it modest: one breed, a small sample and no retest data. A 2026 study of 415 puppies and 520 adult dogs found that scores on different tasks were only weakly correlated (Gnanadesikan and colleagues), so a canine g factor, if it holds up, is weaker than the human one.

Your own number

Where would your own score land?

Take the IIF-certified assessment and get your score with the scale it was measured on, the percentile it corresponds to and the confidence range around it — the three figures most online tests leave out.

Find your IQ score now!

Secure & encryptedInstant results10–20 minutes

Genius dogs: the gifted word learners

A few dogs learn object names at an extraordinary rate. Chaser, a border collie studied by John Pilley and Alliston Reid, learned the names of 1,022 objects over three years of intensive training (Behavioural Processes, 2011).

Researchers at Eotvos Lorand University in Budapest call dogs like her gifted word learners, and they are rare. In a 2021 study, all 6 gifted dogs found in two years of searching worldwide learned toy names during three months of training, while only 1 of 34 typical family dogs did. In another study, gifted dogs learned 6 new toy names in one week and 12 in the next, and still remembered them two months later. A 2023 survey of 41 gifted dogs from nine countries found they knew 29 toy names on average, and 56% of them were border collies.

Newer work suggests these dogs learn in ways that echo young children. Gifted dogs extend a toy’s name to new toys used the same way rather than toys that merely look alike (Fugazza and colleagues, 2025), and they can learn names by overhearing their owners, a pattern the authors compare to 18-month-old children (Dror and colleagues, Science, 2026).

Dog IQ vs cat IQ: which is smarter?

There is no cat IQ either, and cats are harder to study in a lab, so direct comparisons are thin. The best-known physical comparison is a 2017 neuron count: about 250 million neurons in a cat’s cerebral cortex, against 429 million in a small mixed-breed dog and 627 million in a golden retriever (Jardim-Messeder and colleagues). Only two dogs were counted, and more neurons do not simply mean more intelligence. For scale, the human cerebral cortex holds about 16 billion.

How dogs compare with other animals

Other species have their own headline findings, each on a narrow task:

  • Crows: New Caledonian crows solving water-displacement puzzles showed an understanding “rivalling that of 5-7 year old children,” while failing two harder versions (Jelbert and colleagues, 2014).
  • Self-control across species: in 36 species, including dogs, wolves and coyotes, absolute brain volume — not brain size relative to the body — best predicted performance on self-control tasks (MacLean and colleagues, 2014).
  • Koko the gorilla: her trainer Francine Patterson reported an average IQ of about 80 on children’s tests such as the Stanford-Binet and the Peabody Picture Vocabulary Test. Critics questioned how her handlers interpreted her behavior, and the scores were never independently validated.

Can you test your dog’s IQ at home?

You can run informative games, but not an IQ test. Popular at-home dog IQ tests — finding a treat under one of several cups, getting around a barrier to reach food, working a puzzle feeder — echo the kinds of memory, detour and problem-solving tasks researchers use. What they lack is norms: there is no representative sample of dogs to compare your dog’s time against, so the result cannot be turned into an IQ.

Used fairly, the games still show you something real about how your particular dog solves problems. Try them when the dog is calm and interested in the reward, repeat a task on different days instead of scoring one attempt, and remember that a dog trained to wait for cues may look slow on a puzzle it was never encouraged to try alone.

What dog IQ gets wrong about intelligence

The questions people ask about dogs — which breed is smartest, which age of child a dog equals — are the same simplifications that trip people up about human IQ. One number flattens very different abilities, a ranking of trainability gets read as a ranking of brains, and averages say little about an individual. Multiple intelligences theory is one challenge to the single-number view of people; the dog research is a reminder that even a well-measured ability is only one part of a mind.

Share this article

Know someone who keeps seeing these numbers quoted without the scale they were measured on? Send it to them.

Tagged animal intelligence, brain size, canine cognition, comparative psychology, dog breeds, dog iq, executive function, G Factor, general intelligence, intelligence research, IQ Science, mental age, problem solving, Working Memory

SAT and ACT Score to IQ Conversion

Scores & Scales

SAT and ACT Score to IQ Conversion: What the Research Actually Supports

Neither the SAT nor the ACT is an IQ test, but two landmark studies found they correlate with general cognitive ability at 0.77 to 0.86. Here is what that correlation actually predicts by percentile, the real 12-point margin of error around any single conversion, and why the method breaks down at the extremes.

Table converting SAT and ACT percentile rank into a predicted IQ score and IQ percentile.

Neither the SAT nor the ACT is an IQ test, and neither produces an official IQ score. But both correlate with general cognitive ability strongly enough that researchers have used them as a stand-in for IQ in large studies, and the two papers behind almost every SAT-to-IQ chart online report correlations in the 0.77–0.86 range. That is genuinely high — but it is not 1.0, and the gap between a strong correlation and a trustworthy individual conversion is exactly where most of those charts go wrong.

This article works through what the two source studies actually found, what a correlation of about 0.8 does and does not let you predict about one specific person, and the real margin of error around any single number — which is wider than any chart circulating online tends to admit.

Why a college-admissions test and an intelligence test correlate at all

The SAT and ACT were built to predict first-year college grades, not to measure intelligence. But the skills they sample — verbal comprehension, quantitative reasoning, working with unfamiliar problems under a strict time limit — overlap heavily with what an IQ test samples, because both are, underneath the branding, timed tests of reasoning under novel conditions. The overlap is not total: the SAT and ACT also load on things a well-designed IQ test tries to strip out, including years of curriculum exposure, test-specific coaching, and how many times a student has already sat the exam. Professional IQ tests covers what a clinical instrument samples instead, and the difference is most of why a conversion is approximate rather than exact.

The SAT and ACT are also concordant with each other: the two testing organizations publish official tables mapping a score on one exam to an equivalent score on the other, despite real format differences — the ACT includes a dedicated science-reasoning section that the SAT does not, for instance. That the two admissions tests agree with each other reasonably well is a small piece of supporting evidence that both are sampling something real and shared, which is part of why a correlation with IQ shows up on both sides rather than being a quirk of one particular exam.

The two studies behind almost every SAT/ACT-to-IQ chart

Psychologists Meredith Frey and Douglas Detterman published the original analysis in 2004, titled plainly Scholastic Assessment or g? Using the National Longitudinal Survey of Youth, they identified 917 people who had taken both the SAT and the U.S. military’s own aptitude battery, which has a well-established general-ability score. SAT scores correlated with that measure at 0.82, rising to 0.86 once they corrected for a mild statistical nonlinearity in the relationship. A second, smaller study in the same paper compared SAT scores directly against Raven’s Advanced Progressive Matrices — a nonverbal reasoning test often used because it is harder to coach for — in 104 undergraduates, and found a raw correlation of 0.48, rising to 0.72 once corrected for the fact that undergraduates are a narrower, higher-scoring slice of the population than everyone who sits the SAT.

Karen Koenig, working with Frey and Detterman, repeated the exercise for the ACT in 2008. Among 1,075 people in the same national survey who had taken the ACT and the military aptitude battery, the correlation was 0.77. A newer, smaller sample of 149 people comparing ACT composite scores against Raven’s-derived IQ found 0.61. Both papers have been cited hundreds of times, and nearly every SAT-to-IQ or ACT-to-IQ chart in circulation traces back to one of them, whether or not the site displaying it says so.

One thing both studies were not about is worth stating directly, since the site’s own news coverage handles a related but different question: the SAT’s move to a fully digital, adaptive format is a change to how the test is administered, not a reason its correlation with cognitive ability would be higher or lower. What changes for a score under the new digital format is a different question from the one this article answers.

A table converting SAT and ACT percentile rank into a predicted IQ and IQ percentile, using a correlation of about 0.8.
Your own number

Where would your own score land?

Take the IIF-certified assessment and get your score with the scale it was measured on, the percentile it corresponds to and the confidence range around it — the three figures most online tests leave out.

Find your IQ score now!

Secure & encryptedInstant results10–20 minutes

What the correlation predicts, by percentile

A correlation coefficient has a precise statistical meaning: for two bell-curve-shaped measures correlated at r, the best single guess at someone’s standing on one measure is r times their standing on the other, expressed in standard deviations from the mean. That relationship, applied to the roughly 0.8 average of the studies above, gives the table below — a derived estimate using the studies’ own correlation, not a table lifted from either paper. It uses percentile rank because percentile, unlike a raw score, does not shift every time the SAT or ACT is rescaled.

Approximate IQ prediction from SAT/ACT percentile, using r = 0.8
SAT/ACT percentile (national) Predicted IQ (approx.) Predicted IQ percentile
50th 100 50th
75th ~108 ~70th
90th ~115 ~85th
95th ~120 ~91st
99th ~128 ~97th
99.9th ~137 ~99th

Notice the pattern: the predicted IQ percentile is always closer to average than the SAT/ACT percentile it is built from. That is not a rounding artifact — it is regression to the mean, the same statistical effect that makes the children of very tall parents shorter on average than their parents. Any two imperfectly correlated measures pull toward the middle when you predict one from the other, and a correlation of 0.8, however strong, is still imperfect.

Here is what that looks like for one specific person. A student whose SAT total places them at the 95th percentile nationally is, by this method, predicted to score around IQ 120 — which itself sits at roughly the 91st percentile of the general population, not the 95th. The gap between those two percentiles is regression to the mean showing up in a single concrete case, and it widens rather than narrows further out in the distribution: at the 99.9th percentile on the SAT, the predicted IQ percentile is only about the 99th, not the 99.9th.

Why no single conversion is exact

A 2005 comment on the original Frey and Detterman paper, published in the same journal by testing researcher Brent Bridgeman, worked out the practical size of the uncertainty: the standard error of the prediction equation was about 5.94 IQ points, which means the 95% confidence band around any single person’s predicted IQ runs roughly 12 points wide in either direction. Twelve points is nearly the entire span of the “average” classification band on most scales. Two people with identical SAT scores could have real IQs that differ by 20 points or more and both be entirely consistent with the same prediction.

The method also gets less trustworthy, not more, at the extremes. Bridgeman’s critique specifically flagged that pushing the equation toward a near-perfect SAT score produced implausibly high predicted IQs — an artifact of extrapolating a straight-line relationship past the range where it was actually measured, not a real result. A perfect or near-perfect score should not be read as implying a specific very high IQ with any precision.

  • The SAT has been rescaled more than once — a 1995 recentering, an essay-inclusive 2400-point scale from 2005 to 2016, a return to 1600, and a fully digital adaptive format from 2024 — so a formula fit to one era’s score distribution does not automatically carry over to another.
  • Retakes, test-specific coaching and superscoring can move an SAT or ACT result in ways that do not touch the underlying ability an IQ test tries to isolate under single-session, standardized conditions.
  • Both correlations were measured against a proxy for IQ (a military aptitude battery, or Raven’s matrices) rather than a full individually administered scale, which adds its own layer of imprecision on top of the correlation itself.

What a converted number is actually useful for

Treated as a rough, population-level sanity check, the correlation between these tests and cognitive ability is a genuinely interesting piece of psychometric history — it is part of why the SAT works reasonably well as a rough predictor of first-year college performance in the first place. Treated as a personal diagnostic, it is the wrong tool: a 12-point margin of error and an extrapolation problem at the high end are disqualifying for anything resembling a precise number.

None of this is a reasonable basis for anything consequential — a gifted-program application, a hiring decision, or a diagnosis all call for an actual, individually administered test, not a number backed into from an exam built for a different purpose entirely. Where the correlation is genuinely useful is narrower: as a sanity check on how much real overlap exists between “college readiness” and general cognitive ability, and as a reminder that a single test score, whichever test it came from, is an estimate with a margin of error attached to it, not a fact.

SAT and ACT scores correlate with IQ because both are, underneath everything else, timed tests of verbal and quantitative reasoning under unfamiliar conditions — they share an identifiable mechanism. Not every number that seems to move alongside IQ does; see eye color and IQ for a claim that looks similar on the surface and has no shared mechanism behind it at all. If what you actually want is your own number rather than an estimate built from a different test, an individually normed assessment is the only way to get one, and the percentile calculator converts whatever score you end up with into where it sits in the population — the same step this article just walked through in reverse.

Share this article

Know someone who keeps seeing these numbers quoted without the scale they were measured on? Send it to them.

Tagged ACT score, cognitive ability, college admissions test, correlation study, G Factor, intelligence research, IQ conversion, iq scale, IQ Score, longitudinal study, percentile, Raven progressive matrices, SAT score, standardized testing