
The brain numbers everyone quotes, checked
Twelve brain statistics that circulate in news, classrooms and offices, each traced to where it began and checked against the best current study, with a count of how often research papers still repeat it.

By Leon Falkner, Data & Research Analyst · Reviewed by Aarav Vardhan, Editor-in-Chief · Published 22 October 2026 · 15 min read
About this study
- Report type
- Data study and fact-check ledger
- Claims
- 12 viral brain and thinking numbers
- Checked
- 22 October 2026, against primary sources
- New data
- Research papers repeating each number (OpenAlex); daily Wikipedia views
- Licence
- CC BY 4.0
- Version
- 2026.10
- Sources
- 83
Most viral brain numbers do not hold up. We traced 12 of them to their sources on 22 October 2026: one is supported as usually stated (the adult brain uses about 20% of the body’s resting energy), seven are partly true, and four, including 60,000 thoughts and 35,000 decisions a day, trace to no study at all.
01 Key findings
- Only 1 of 12 holds up as usually stated. The adult brain’s 20% share of resting energy is supported; 7 numbers are partly true, and 4 (60,000 thoughts a day, 35,000 decisions a day, the 8-second goldfish attention span and images processed 60,000 times faster than text) trace to no study.IQ Metrics ledger, checked 22 Oct 2026
- Research papers repeat the unsourced four. At least 277 journal articles indexed in OpenAlex contain one of them, led by “60,000 times faster” (140) and the goldfish comparison (73).OpenAlex, all years to 21 Oct 2026
- 60,000 thoughts a day is about ten times too high. The only brain-scan estimate found about 6.5 new thoughts a minute in 184 young adults, roughly 6,200 a day.Tseng and Poppenk, Nature Communications, 2020
- 86 billion neurons is overtaking 100 billion. In 2026 (to 21 October), 65% of journal articles that give one of the two counts give 86 billion, up from 49% in 2025 and 4% in 2009.OpenAlex, journal articles, 2009-2026
- “Fully developed at 25” began as a magazine quote. It traces to a 2004 Time interview about how long a scanning study would follow volunteers; a 2025 study of 4,216 brains found an adolescent wiring pattern until about 32.Time, 2004; Mousley et al., Nature Communications, 2025
02 Statistics to quote
Viral brain numbers with no traceable study behind them: 60,000 thoughts, 35,000 decisions, the 8-second attention span and images processed 60,000 times faster than text.
IQ Metrics ledger, 22 Oct 2026Journal articles that repeat one of those four unsourced numbers, at least.
OpenAlex, to 21 Oct 2026Thoughts a day in the only brain-scan estimate, about a tenth of the popular 60,000.
Tseng and Poppenk 2020, 184 young adultsShare of 2026 journal articles giving a neuron count that say 86 billion rather than 100 billion; 4% in 2009.
OpenAlex, 2026 to 21 OctShare of the body’s resting energy a 4-year-old’s brain uses; the famous 20% fits adults.
Kuzawa et al. 2014, PNASMeasured gap before office workers returned to interrupted work, after about two other tasks; the viral version says 23 minutes to refocus.
Mark, Gonzalez and Harris 2005, 24 workers03 Which viral brain numbers are true?
One of the twelve holds up as usually stated: the adult brain uses about 20% of the body’s energy at rest. Seven are partly true: a real study sits behind them, but the popular version changes the group, the measure or the number. Four have no study behind them at all. We picked numbers that are widely repeated and can be checked, and left out the “10% of the brain” and “left brain, right brain” myths, which we cover in what brain scans show and six brain myths about intelligence, and the Dunning-Kruger effect (is it real?).
How 12 viral brain numbers held up
Each popular number traced to its source and checked against the best current study. Partly true = a real study exists, but the popular number changes the group, the measure or the number.
Source: IQ Metrics Research ledger of 12 brain claims, checked 22 October 2026 against the sources in Table 1.
The ledger: 12 brain numbers, traced and checked
Papers = journal articles in OpenAlex whose indexed text contains the popular phrase, all years to 21 October 2026 (a lower bound). Select a claim for its section.
| We have 60,000 to 70,000 thoughts a day Traced to: No study; credited to an NSF article nobody has found | No traceable source | About 6,200 a day (one 2020 brain-scan estimate in young adults) | 31 |
| Adults make 35,000 decisions a day Traced to: A 2015 college blog citing “various internet sources” | No traceable source | No count exists; 227 food decisions in a 2007 study now under an expression of concern | 33 |
| Our attention span is 8 seconds, shorter than a goldfish’s Traced to: A statistics website (2012), then a Microsoft Canada report (2015) | No traceable source | No single attention span exists; workers switch screens every 47 seconds on average | 73 |
| It takes 23 minutes to refocus after an interruption Traced to: A 2008 magazine interview about a 2005 office study | Partly true | 25 min 26 s until people returned to interrupted work, after about two other tasks (24 workers, 2005) | 27 |
| The brain processes images 60,000 times faster than text Traced to: A 1982 Business Week advertising section, then 3M | No traceable source | No ratio measured; a picture’s gist in 13 ms, a word read in about 250 ms | 140 |
| The senses take in 11 million bits a second; the conscious mind handles 40 Traced to: 1980s physiology textbooks, popularised in 1991 | Partly true | About 10 bits a second of thought and action against about a billion bits of sensory input (2025) | 56 |
| We forget 70% of what we learn within 24 hours Traced to: Ebbinghaus’s 1885 savings data, reread in training blogs | Partly true | One man, nonsense syllables: relearning a day later took 34% less time (1885; replicated 2015) | 11 |
| The human brain has 100 billion neurons Traced to: A round textbook figure, settled around 1991, never counted | Partly true | 86.1 billion in 4 men (2009); 67.3 billion in 5 older women (2013) | 1,378 |
| The brain uses 20% of the body’s energy Traced to: Real physiology measurements | Supported | About 20% of resting energy in adults (19% men, 24% women); about 66% at age 4 | 564 |
| The brain is 75% water and 60% fat Traced to: Real measurements (1945, 1965); “by dry weight” dropped later | Partly true | Water 70-85% (grey matter more); fat about 5-16% of living tissue, about 60% of dry weight | 44 |
| 90% of the brain develops by age 5 Traced to: A 2014 foundation report, no study cited | Partly true | About 90-95% of peak brain size by about age 6; development continues for decades | 107 |
| The brain is fully developed at 25 Traced to: A 2004 Time quote about a study’s follow-up, not a finding | Partly true | No single age: grey matter peaks near 6, white matter near 29; wiring changes again at about 32 | 116 |
Source: IQ Metrics Research, 2026, from the primary sources cited in each section; paper counts from OpenAlex [81] (CC0).
04 How many thoughts does a person have a day?
No study has counted 60,000 or 70,000 thoughts a day. The only brain-data estimate, a 2020 study of 184 young adults, found about 6.5 new thoughts a minute, which works out at roughly 6,200 a day, about a tenth of the popular number [1].
- Verdict
- No traceable source. The 60,000 and 70,000 figures trace to no study. The one measurement is about ten times lower, and its authors call it a tentative estimate from a new method.
- Where it is repeated
- Self-help and business pages for two decades: the Chopra Center (60,000 to 80,000, 2007) [4], a Forbes column (2012) [6], a university neuroimaging lab’s “Brain Trivia” page (70,000) [5] and an opinion piece in The Straits Times in 2024 [9].
- Where it came from
- No source has ever been produced. An undated sales-coaching page credits the “National Science Foundation” with 12,000 to 50,000 thoughts [3]; the NSF article it describes has never been found [8]. The 2012 Forbes column credited a Stanford researcher, who replied that he had no idea where the quote came from [8].
- Best current evidence
- Tseng and Poppenk scanned 184 young adults (7-tesla MRI, Human Connectome Project) while they watched films and rested, and counted each shift of brain activity into a new stable pattern as a new thought. The median was about 6.5 shifts a minute; with 8 hours of sleep, the paper estimates “over six thousand daily thoughts” [1]; the university’s press release said about 6,200 [2]. It is one method in young adults, not a census of the mind.
- Research papers repeating it
- 31 journal articles in OpenAlex contain “60,000 thoughts” or “70,000 thoughts” (or the 50,000 and 80,000 forms) [81].
Thousands of thoughts a day, counted the way the one brain-scan study counted them
Thoughts a day = new thoughts a minute x 60 x waking hours, in thousands (6.2 = 6,200). The study measured a median of about 6.5 a minute in 184 young adults; 60,000 a day would need a new thought about every second, all day.
Source: IQ Metrics Research arithmetic on the rate reported by Tseng and Poppenk 2020 [1] (CC BY 4.0).
What the thoughts estimate rests on
| Input | Value | Source |
|---|---|---|
| New thoughts a minute (median, movies and rest) | About 6.5 | Tseng and Poppenk 2020, Discussion [1] |
| Waking hours | 16 (8 hours of sleep) | The paper’s assumption [1] |
| Thoughts a day | 6.5 x 60 x 16 = 6,240 (“over six thousand”) | Paper; press release rounds to 6,200 [2] |
| Rate needed for 60,000 a day | 62.5 a minute, about one a second | Our arithmetic |
| People scanned | 184 young adults (7 T MRI, Human Connectome Project) | Tseng and Poppenk 2020 [1] |
Source: Tseng and Poppenk 2020 [1]; Queen’s University press release [2].
05 How many decisions do we make a day?
Nobody has counted 35,000, or any total. The number traces to a 2015 college blog post that credited “various internet sources” [10]. The study usually cited beside it counted food decisions only, 226.7 a day, and its journal issued an expression of concern in March 2026 [14] [15].
- Verdict
- No traceable source. The trail ends at a blog post with no source. No study has counted all the decisions a person makes in a day.
- Where it is repeated
- CNN Health in 2022, crediting a University of Leicester lecturer [12] whose 2018 Psychology Today post had itself questioned how the number was derived [11]. It also runs through leadership and productivity writing.
- Where it came from
- The earliest dated copy is a Roberts Wesleyan College blog post of March 2015, which says “various internet sources” estimate 35,000 [10]. A book citation was added to the post later; a reader who checked the book found no such number in it [13].
- Best current evidence
- Wansink and Sobal (2007) asked people how many food decisions they make. Asked directly, people said about 14; adding up their answers meal by meal gave 226.7, which became the “200 food decisions” figure [14] [17]. A 2025 paper argues the jump is an artefact of asking in parts [16]. The paper now carries an expression of concern dated 17 March 2026 [15].
- Research papers repeating it
- 33 journal articles in OpenAlex contain “35,000 decisions” or “35,000 choices” [81].
06 Is the human attention span shorter than a goldfish's?
No. No study measured an 8-second human attention span or a 9-second goldfish one. Both numbers come from a statistics website that named no study, and spread worldwide in 2015 through a Microsoft Canada marketing report that copied them [18] [19].
- Verdict
- No traceable source. The trail ends at a website. The sources it listed later told the BBC they could find no record of the research [21].
- Where it is repeated
- Time (“You now have a shorter attention span than a goldfish”, 2015) [20], and, by the BBC’s count, the Telegraph, the Guardian, USA Today, the New York Times and others [21].
- Where it came from
- Statistic Brain’s “Attention Span Statistics” page, first archived in February 2012, gave 12 seconds for 2000, 8 seconds for 2012 and 9 seconds for a goldfish, citing the Associated Press [18]. Microsoft Canada’s 2015 “Attention spans” report reprinted the numbers on page 6 as “Source: Statistic brain” [19]; its own research, a survey of 2,000 Canadians and a brain-recording (EEG) study of 112 people, measured kinds of attention, not a span in seconds.
- Best current evidence
- Attention depends on the task, so there is no single span to measure. The closest real measurements are how long office workers stay with one thing before switching: 2 minutes 11 seconds on any device or paper document in 2004 field work [22], and an average of 47 seconds on one computer screen (median 40) in 40 workers in 2016 [23]. That is switching between windows, not an inability to concentrate. Goldfish have been used for decades to study learning and memory, retested a day or two weeks after training [24].
- Research papers repeating it
- 73 journal articles in OpenAlex mention a goldfish, an attention span and an 8- or 9-second figure together [81].
- Earlier fact-checks
- Simon Maybin for BBC News and More or Less (2017) [21].
07 How long does it take to refocus after an interruption?
The study behind the 23 minutes measured something else. Gloria Mark’s team watched 24 office workers and found that interrupted work was picked up again, on average, 25 minutes and 26 seconds later, usually after two other tasks in between [25]. That is a gap before returning, not the time it takes to regain focus.
- Verdict
- Partly true. A real study exists, but the popular version changes both the number and what it measured.
- Where it is repeated
- Productivity apps and business media; the exact “23 minutes and 15 seconds” comes from a 2008 Fast Company interview [26]. Mark’s own 2015 paper summarised the study as “around 23 minutes” [27].
- Where it came from
- Mark, Gonzalez and Harris (2005) shadowed 24 information workers, each for about three and a half working days. When interrupted work was resumed the same day, the average gap was 25 min 26 s (standard deviation 54 min 48 s): 22 min 37 s after an outside interruption, 29 min 1 s after a self-interruption [25]. The 23 min 15 s first appears in the 2008 interview [26]; it is not in the published papers.
- Best current evidence
- In the 2005 study, people worked on about two other projects before returning, so the 25 minutes includes other work. A 2008 lab experiment found interrupted people finished tasks slightly faster but reported more stress [28]. In 2023 Mark herself gave the figure as about 25 and a half minutes [29]. More on switching tasks: does multitasking lower your IQ?
- Research papers repeating it
- 27 journal articles in OpenAlex give “23 minutes and 15 seconds”, or 23 minutes to get back, refocus or resume after an interruption [81].
08 Does the brain process images 60,000 times faster than text?
No study found that. The number first appears in a 1982 Business Week advertising section, with no research cited [30], and spread through 3M presentation guides [32]. The study later offered as its source measured how persuasive presentations were, not speed [31] [33].
- Verdict
- No traceable source. The figure has no measurement behind it; the 1986 study linked to it tested persuasion.
- Where it is repeated
- Marketing, e-learning and infographic advice, 3M’s own guide (“we can process visuals 60,000 times faster than text”) [32], and a 2024 arXiv review of visual AI [35]. It is the unsourced number research papers repeat most: 140 journal articles in our count.
- Where it came from
- Alan Levine traced it to a 28 June 1982 Business Week advertising section, in a statement by the president of Computer Pictures Corporation [30]. 3M repeated it as a finding of unnamed “behavioral research” [32]. The 1986 University of Minnesota and 3M study found visual aids made a talk 43% more persuasive [31]; its lead author later told Levine his research “had nothing to do with visual processing speed” [33]. Jon Schwabish found that 3M’s own report gave the number with no citation [34].
- Best current evidence
- People can grasp the gist of a picture shown for 13 milliseconds [36] and brain activity tells photos with an animal from photos without one about 150 milliseconds after they appear [37]. Adults read about 238 words a minute, about a quarter of a second a word [38]. The tasks differ, so no honest ratio exists, but nothing measured comes near 60,000.
- Research papers repeating it
- 140 journal articles in OpenAlex contain “60,000 times faster” (or quicker) together with the word text [81].
09 How much information does the brain process per second?
The gap is real, but the famous numbers are old rough estimates. The “11 million bits in, 40 or 50 conscious” figures come from 1980s textbook calculations made popular by a 1991 book [39]. A 2025 review puts the senses’ capacity nearer a billion bits a second and the pace of human thought and action at about 10 bits a second [41].
- Verdict
- Partly true. The point (the mind uses a tiny share of what the senses take in) holds up; the specific numbers do not match current estimates.
- Where it is repeated
- Books on the unconscious mind, management readers and teacher training, for example in a 2015-16 American Educator article on implicit bias [40].
- Where it came from
- Information-theory estimates of the senses’ channel capacity by Kupfmuller (1959) and Zimmermann (in German and US physiology textbooks of the 1980s), popularised by Tor Norretranders’ book “The User Illusion”, which put the senses at over 11 million bits a second and consciousness at about 50 bits a second or less [39]. Other retellings give 40, 16 or “a few dozen”.
- Best current evidence
- Zheng and Meister (2025) estimate human behavioural throughput at about 10 bits a second, from typing, speech, memory sports and games, against about a billion bits a second gathered by the senses [41]. The gap is roughly a hundred million times, larger than the popular version suggests.
- Research papers repeating it
- 56 journal articles in OpenAlex contain “11 million bits” or “eleven million bits” [81]. For how fast people react, see average reaction time by age and processing speed and IQ.
10 Do we forget 70% of what we learn within 24 hours?
Not as stated. The number loosely matches Hermann Ebbinghaus’s 1885 experiment on himself: a day after learning lists of nonsense syllables, relearning them took about 34% less time than learning them first [42]. That measures time saved on relearning meaningless syllables, not how much of a lesson people forget.
- Verdict
- Partly true. A real experiment exists, but “70% forgotten” turns a one-person measure of relearning time into a rule about all learning; the “90% in a week” step is not in his data.
- Where it is repeated
- Corporate training and e-learning pages, such as TalentLMS (2023) [46]. The 50/70/90 version appears in a 2014 Learning Solutions column with no study cited [44].
- Where it came from
- Ebbinghaus learned 13-syllable nonsense lists and relearned them after 20 minutes to 31 days. After a day his saving was 33.7%, so 66.3% of the first learning time was needed again [42]. A 2010 review of 14 studies found forgetting ranged from 0% to 94% depending on the material and the method [45].
- Best current evidence
- Murre and Dros (2015) repeated the experiment with one person over 70 hours of learning and got a similar curve, with a small upward jump at one day, possibly sleep [43]. For meaningful material, how much is forgotten depends on the material, how it was learned and how memory is tested. More on memory: memory and IQ.
- Research papers repeating it
- 11 journal articles in OpenAlex mention the forgetting curve or Ebbinghaus together with a “70% in 24 hours” form of the claim [81]: a training-industry number more than a research one.
The forgetting curve measures time saved when relearning, not memory kept
Savings = how much less time relearning a list of nonsense syllables took than learning it the first time (%). One person per line. "70% forgotten" reads 100 minus the 1-day value as forgetting.
Source: Murre and Dros 2015, Table 3 [43] (CC BY 4.0), which reprints Ebbinghaus 1885 [42] and the two subjects of a 1991 replication by Heller, Mack and Seitz.
Savings at each interval: four people learning nonsense syllables
Ebbinghaus's intervals were about 19 minutes, 63 minutes and 8.8 hours; the replications used 20 minutes, 1 hour and 9 hours.
| After | Ebbinghaus 1885 | Mack 1991 | Seitz 1991 | Dros 2015 |
|---|---|---|---|---|
| 20 minutes | 58.2% | 54.4% | 44.2% | 47.2% |
| 1 hour | 44.2% | 43.2% | 32.5% | 37.3% |
| 9 hours | 35.8% | 28.5% | 27.0% | 27.6% |
| 1 day | 33.7% | 31.6% | 27.0% | 31.7% |
| 2 days | 27.8% | 36.5% | 28.6% | 23.0% |
| 6 days | 25.4% | 30.9% | 20.5% | 16.8% |
| 31 days | 21.1% | 25.8% | 20.1% | 4.1% |
Source: Murre and Dros 2015, Table 3 [43] (CC BY 4.0).
11 How many neurons are in the human brain?
About 86 billion, possibly fewer, and not 100 billion. Only two studies we could find have counted the neurons in whole human brains directly: 86.1 billion on average in four men aged 50 to 71 (2009) and 67.3 billion in five women aged 71 to 84 (2013) [47] [49]. The round 100 billion settled in textbooks around 1991 without a count behind it [48] [50].
- Verdict
- Partly true. Right in scale, but higher than both direct counts. Even 86 billion rests on four brains: a 2025 analysis puts its 95% range at 73 to 99 billion [50].
- Where it is repeated
- Textbooks, museum displays and science writing for half a century, and still in research: 1,378 journal articles in our count, more than twice the 609 that give 86 billion [81].
- Where it came from
- For half a century the brain was said to hold about 100 billion neurons and ten times as many glial cells. A 2016 review of 150 years of cell counting traced how these round numbers spread [48]. Until 2009 the total had not been counted: the paper that did it noted the widely quoted 100 billion while the actual number remained unknown [47].
- Best current evidence
- Azevedo and colleagues (2009) dissolved whole brains into a suspension of cell nuclei and counted the neurons (the “isotropic fractionator”): 86.1 plus or minus 8.1 billion neurons and 84.6 billion other cells, in four men [47]. The same method found 67.3 billion in five older women without dementia [49]. Goriely (2025) argues the honest answer is a range, roughly 61 to 99 billion [50]; Roberto Lent, a co-author of the 2009 count, replied in the same journal that the brain has “around 86 billion neurons” [51]. Brain size and IQ: what the correlation really is.
- Research papers repeating it
- 1,378 journal articles in OpenAlex contain “100 billion neurons” (or “100 billion nerve cells”); 609 contain “86 billion neurons” [81]. In 2026, 86 billion is ahead for the first time (chart below).
Every direct count of neurons in whole human brains
Both counts used the isotropic fractionator. The 95% ranges and the 2013 SD are from Goriely's 2025 reanalysis.
| Study | Brains | Neurons, average | 95% range for the average |
|---|---|---|---|
| Azevedo et al. 2009 [47] | 4 men, 50 to 71 | 86.1 billion (SD 8.1) | 73.1 to 99.0 billion |
| Andrade-Moraes et al. 2013 [49] | 5 women, 71 to 84, no dementia | 67.3 billion (SD 4.6) | 61.5 to 73.1 billion |
| Textbooks from about 1991 [48] | none | 100 billion | no count behind it |
Source: Azevedo et al. 2009 [47]; Andrade-Moraes et al. 2013 [49]; Goriely 2025 [50]; von Bartheld et al. 2016, Table 6 [48].
Research papers are switching from 100 billion neurons to 86 billion
Share of journal articles giving "86 billion neurons" among those giving 86 or 100 billion, by year (%), 2010 to 2026. 2026 runs to 21 October; the table below starts in 2009, the year of the count.
Source: IQ Metrics Research count of OpenAlex full-text phrase matches, journal articles only [81] (CC0); the 86 billion count is Azevedo et al. 2009 [47].
Journal articles giving each neuron count, by year
| 2009 | 1 | 23 | 4.2% |
| 2010 | 1 | 28 | 3.4% |
| 2011 | 1 | 42 | 2.3% |
| 2012 | 8 | 44 | 15.4% |
| 2013 | 2 | 60 | 3.2% |
| 2014 | 11 | 48 | 18.6% |
| 2015 | 22 | 68 | 24.4% |
| 2016 | 22 | 59 | 27.2% |
| 2017 | 22 | 77 | 22.2% |
| 2018 | 26 | 81 | 24.3% |
| 2019 | 24 | 91 | 20.9% |
| 2020 | 25 | 82 | 23.4% |
| 2021 | 53 | 88 | 37.6% |
| 2022 | 61 | 106 | 36.5% |
| 2023 | 76 | 135 | 36.0% |
| 2024 | 86 | 97 | 47.0% |
| 2025 | 92 | 95 | 49.2% |
| 2026 (to 21 Oct) | 70 | 38 | 64.8% |
Source: OpenAlex [81] (CC0), queried 22 October 2026; an article that gives both numbers counts in both columns.
12 How much energy does the brain use?
About 20% of the body’s energy at rest, for adults: one of the few viral brain numbers that holds up. The adult brain is about 2% of body weight but uses about a fifth of the oxygen, and so the calories, the body burns at rest [53]. In young children the share is far higher: about 66% at age 4 [54].
- Verdict
- Supported. Measured repeatedly for adults at rest: 19% for young men and 24% for young women in one study. It is a share of resting energy, not of everything burned in a day (11% to 15%), and it does not hold for young children.
- Where it is repeated
- Everywhere from textbooks to health sites, and in 564 journal articles in our count, more than any other number here except the 100 billion neurons [81].
- Where it came from
- Physiology measurements of the brain’s oxygen and glucose use going back to the mid-20th century, summarised by Raichle and Gusnard (2002) [53].
- Best current evidence
- Kuzawa and colleagues (2014) combined PET and MRI data from birth to adulthood. The brain’s glucose use equals 52.5% (boys) and 59.8% (girls) of the body’s resting energy at birth, peaks at 66.3% and 65.0% at about 4 years, and falls to 19.1% and 24.0% in young adults [54]. As a share of all the energy used in a day, the adult brain takes 10.9% (men) and 15.0% (women). The authors link the childhood peak to the slow body growth of human children.
- Research papers repeating it
- 564 journal articles in OpenAlex contain a “20% of the body’s energy” (or oxygen) form of the claim [81].
The brain's glucose use as a share of the body's resting energy, by age
Rows 1 to 4: share of resting metabolic rate. Last row: share of the daily energy requirement, which includes activity.
| Age | Males | Females |
|---|---|---|
| At birth | 52.5% | 59.8% |
| First half-year (lowest) | 37.5% | 40.8% |
| Lifetime peak, about 4.2 to 4.4 years | 66.3% | 65.0% |
| Young adults (19 to 30) | 19.1% | 24.0% |
| Young adults, share of all energy used in a day | 10.9% | 15.0% |
Source: Kuzawa et al. 2014, results [54] (PET data from 29 children and 7 young adults, with MRI volumes).
13 Is the brain 75% water and 60% fat?
Three-quarters water, yes; 60% fat, only once the water is taken out. Brain tissue is roughly 70% to 85% water, more in grey matter than in white [56] [57]. The 60% is roughly the share of fat in the brain’s dry weight (36% to 66%, depending on the tissue); in living tissue fat is about 5% to 16% of the weight [56].
- Verdict
- Partly true. The water figure is about right. The fat figure is a dry-weight number with the words “by dry weight” dropped.
- Where it is repeated
- Guinness World Records calls the brain the “fattiest organ”, “typically composed of 60% fat” [60]; Live Science (2021) [61]; nutrition and supplement pages.
- Where it came from
- Water: a 1945 chemical analysis of one man’s body found the brain, spinal cord and nerves were 73.3% water [55], a figure the US Geological Survey later popularised [62]. Fat: in 1965 O’Brien and Sampson measured lipids at 36% to 40% of the dry weight of grey matter and 49% to 66% of white matter [56]. A 2009 review began its abstract with “nearly 60 percent fat”, without the qualifier [58].
- Best current evidence
- An MRI study of 21 adults measured 83.7% water in grey matter and 69.1% in white matter [57]. Once the water in O’Brien and Sampson’s samples is counted, fat is 5% to 7% of grey matter and 9% to 16% of white matter by weight (our arithmetic from their Table 1) [56]; the 1945 analysis gave 12.7% ether extract (mostly fat) for brain, spinal cord and nerves [55]. Stated correctly, the brain is “nearly 60% lipid by dry weight” [59].
- Research papers repeating it
- 44 journal articles in OpenAlex contain a “brain is 75% water” or “brain is 60% fat” form of the claim [81].
What brain tissue is made of
Fat in living tissue = fat share of dry weight x (100% minus water), our arithmetic from O'Brien and Sampson's Table 1 (four people aged 10 months to 55 years).
| Tissue | Water, chemical analysis | Water, MRI (21 adults) | Fat, as measured | Fat, share of living tissue |
|---|---|---|---|---|
| Grey matter, water | 82.3% to 85.8% | 83.7% | 36% to 40% of dry weight | 5% to 7% |
| White matter, water | 75.2% to 80.8% | 69.1% | 49% to 66% of dry weight | 9% to 16% |
| Brain, spinal cord and nerves (one adult) | 73.3% | 12.7% ether extract | 12.7% |
Source: O’Brien and Sampson 1965 [56]; Oros-Peusquens et al. 2019 [57] (CC BY); Mitchell et al. 1945 [55].
14 Is 90% of the brain developed by age 5?
In size, roughly; in development, no. A child’s brain reaches about 90% to 95% of its peak size by about age 6 [63] [64]. But its parts keep growing and changing for decades: grey matter volume peaks near 6, total brain volume near 12 and white matter near 29 [73].
- Verdict
- Partly true. Close for brain size; wrong when stated as “development” or “capacity”, which go on into adulthood.
- Where it is repeated
- Early-childhood campaigns and university pages: First Things First in Arizona (“90% of a child’s brain develops by age 5”) [69], a University of Connecticut trivia post in 2025 [70] and Discover (2022) [71].
- Where it came from
- The earliest dated use we found is a 2014 Robert Wood Johnson Foundation report: “90 percent of a child’s brain capacity is developed by age 5”, with no study cited [67]. The Royal College of Physicians and Surgeons of Canada repeated it later that year, citing that report [68]. First Things First explained it as size: about 80% of adult size by age 3 and 90% by age 5 [69].
- Best current evidence
- Brain volume is about 35% of adult size a few weeks after birth and about 80% by age 2 [65], and “already at 95% of its peak size by age 6” [63]. Growth in size is not the end of development: white matter keeps growing until about 29 [73], and the brain’s long-range connections keep maturing after adolescence [66]. A related number was corrected at its source: the Harvard Center on the Developing Child, which had said “700 to 1,000 new neural connections form every second”, now says more than a million, a change it made in 2017 [72].
- Research papers repeating it
- 107 journal articles in OpenAlex contain a “90% of brain development (or growth)” form of the claim [81]; many state the size version.
15 Is the brain fully developed at 25?
No study found that the brain stops developing at 25. The age traces to a 2004 magazine quote about how long a scanning study would need to follow its volunteers [75]. A 2025 study of 4,216 people aged 0 to 90 found the brain’s wiring keeps an adolescent pattern until about 32 [80].
- Verdict
- Partly true. The brain does keep changing into the 20s, so the idea has a real basis; the fixed finish line at 25 has none.
- Where it is repeated
- News, parenting and legal writing since 2005, and a 2013 review paper that called maturation “fully accomplished at the age of 25” [77].
- Where it came from
- The landmark NIH scans of children stopped at age 21 [74]. In 2004 the lead researcher told Time that, to follow volunteers until the brain settled, “we’d probably go to age 25” [75]. By 2005 a Washington Post story said the brain region “is not fully formed until age 25” [76]. In 2009 the same researcher wrote that the brain matures “well into the 20s” [78].
- Best current evidence
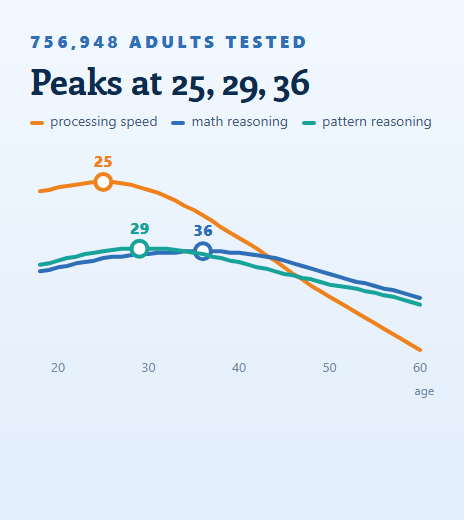
- Brain charts built from 123,984 scans of 101,457 people show different parts peaking at very different ages: grey matter volume at about 6, white matter at about 29 [73]. Mousley and colleagues (2025) found turning points in brain wiring at about 9, 32, 66 and 83, estimated on the 3,802 people with typical development among the 4,216 scanned [80]. When thinking skills peak is a separate question: see at what age is your brain sharpest?
- Research papers repeating it
- 116 journal articles in OpenAlex say the brain or prefrontal cortex is “fully developed” or “fully mature” at, by or until age 25 [81].
- Earlier fact-checks
- Jane C. Hu in Slate (2022) [79].
No single finish line: the age each part of the brain peaks
Age in years at which each measure peaks; the popular "fully developed at 25" marked for comparison. The 95% ranges are in the table below (all within a year).
Source: Bethlehem et al. 2022, brain charts from 123,984 MRI scans [73] (CC BY 4.0); Mousley et al. 2025, 4,216 people aged 0 to 90 [80] (CC BY 4.0).
Peak ages of brain measures
| Measure | Age (years) | 95% range | Source |
|---|---|---|---|
| Cortical thickness peaks | 1.7 | [73] | |
| Grey matter volume peaks | 5.9 | 5.8 to 6.1 | [73] |
| Cortical surface area peaks | 11.0 | [73] | |
| Total cerebrum volume peaks | 12.5 | 12.1 to 12.9 | [73] |
| Subcortical grey matter peaks | 14.4 | 14.0 to 14.7 | [73] |
| The popular claim: “fully developed” | 25.0 | [75] | |
| White matter volume peaks | 28.7 | 28.1 to 29.2 | [73] |
| Wiring leaves its adolescent pattern | 32.0 | [80] |
Source: Bethlehem et al. 2022 [73]; Mousley et al. 2025 [80]; Time 2004 [75].
16 Why can a viral number be close and still wrong?
Several viral numbers sit close to a real measurement and still mislead, because the real number measures something else: resting energy rather than a whole day’s energy, dry weight rather than living tissue, time saved on relearning rather than memory. The chart puts each popular number next to the nearest measurement and names what that measurement is of.
Close numbers, different meanings: viral percentages next to the nearest measurement
Each row gives the popular number and the closest real measurement, and says what that measurement is of. A number can be close and still wrong about what it describes.
Source: Kuzawa et al. 2014 [54]; Mitchell et al. 1945, Table I [55]; O’Brien and Sampson 1965, Table 1, age 55 [56]; Ebbinghaus 1885 [42]; Giedd and Rapoport 2010 [63].
The viral number, the nearest measurement and what it measures
| Row | Viral | Measured | What the measurement is | Source |
|---|---|---|---|---|
| Brain share of resting energy, young men | 20% | 19.1% | Glucose use as a share of resting metabolic rate | [54] |
| Brain share of resting energy, boys at about 4 | 20% | 66.3% | The same measure at the lifetime peak, 4.2 to 4.4 years | [54] |
| Brain share of all energy used in a day, young men | 20% | 10.9% | Glucose use as a share of the daily energy requirement | [54] |
| Water in brain, spinal cord and nerves | 75% | 73.3% | One adult man, chemical analysis | [55] |
| Fat in brain, spinal cord and nerves, living weight | 60% | 12.7% | Ether extract (mostly fat), one adult man | [55] |
| Fat in adult white matter, dry weight | 60% | 64.6% | Total lipid, frontal lobe, age 55 | [56] |
| Extra relearning time needed after a day | 70% “forgotten” | 66.3% | Ebbinghaus on himself, nonsense syllables (100 minus 33.7% saved) | [42] |
| Brain size at about 6, share of its peak | 90% “by 5” | 95% | MRI brain volume, NIMH sample | [63] |
Source: Sources as listed in each row.
17 How did these numbers spread?
Four numbers, four routes. Two began on websites and one in an advertisement, with no study behind them; one began as a researcher’s remark in a magazine. In each case a big brand or outlet carried the number to millions of readers before anyone checked it, and the checks have not stopped it. Each trail runs from the earliest copy we could find to today; the table under the figure links every step.
How four viral brain numbers travelled
Each step in time order, from the earliest copy we found to today. Steps are evenly spaced; the year is printed above each dot.
- 2012A statistics website lists 8 seconds, and 9 for a goldfishNames the Associated Press; no study
- 2015Microsoft Canada report reprints itPage 6: "Source: Statistic brain"
- 2015Time: shorter than a goldfishThen the Telegraph, Guardian, NYT and others
- 2016Office workers switch screens every 47 secondsA different measure, 40 people
- 2017BBC: no research behind itThe listed sources found no record
- 2026Still in research papers73 journal articles so far
- by 2003Sales-coaching page credits the "National Science Foundation"12,000 to 50,000 a day; no such NSF article found
- 2007Chopra Center: 60,000 to 80,000No source
- 2011A university lab's trivia page: 70,000No source
- 2012Forbes: 60,000, "90% repetitive"The scientist it credits had no idea where it came from
- 2012Discover asks where it came fromFinds no origin
- 2020Brain scans of 184 people: about 6,200 a dayA tenth of the popular number
- 1982Business Week advertising sectionComputer Pictures Corp.; no research cited
- 1986University of Minnesota and 3M studyMeasured persuasion, not speed
- 19993M presentation guide repeats the numberCredits unnamed "behavioral research"
- 2012A blogger finds no source; the 1986 author: not about speedA prize for the source, never claimed
- 2015PolicyViz: 3M's own report cites nothingThe 60,000 fallacy
- 2026Still in research papers140 journal articles so far
- 2004NIH scans of children end at age 21Gogtay et al., PNAS
- 2004Time quotes the lead researcher: "we'd probably go to age 25"About how long to follow volunteers
- 2005Washington Post: "not fully formed until age 25"The quote becomes a finding
- 2013A review paper repeats 25 as the finishCited ever since
- 2022Slate: experts do not know why 25
- 20254,216 brains: adolescent wiring lasts to about 32Mousley et al.
Source: IQ Metrics Research, traced from archived pages and papers (each step is linked in the study’s table of trail sources), including Wayback Machine copies [83]; paper counts from OpenAlex [81].
Every step of the trails, with its source
Source: Archived copies via the Wayback Machine [83] where the original page has changed or gone.
18 How often do research papers repeat these numbers?
Scientists repeat them too. We counted journal articles in OpenAlex, an open index of research, whose text contains each popular phrase. At least 277 repeat one of the four numbers with no study behind them, led by the claim that images are processed 60,000 times faster than text (140). The 100 billion neurons figure appears in 1,378 articles, the most of any number here, though papers giving 86 billion are catching up. Some papers quote a number to correct it, so these counts measure how often a number circulates, not how many authors believe it [81].
How many research papers repeat each number
Journal articles in OpenAlex whose indexed text contains the popular phrase, all years to 21 October 2026. A lower bound; some papers quote a number to correct it.
Source: IQ Metrics Research count from OpenAlex [81] (CC0); the exact search phrases are in the CSV.
Journal articles repeating each number, by period
2025-2026 runs to 21 October 2026. A few records in OpenAlex have no publication year. Water and fat are counted separately and added.
| 60,000 thoughts a day | No traceable source | 3 | 1 | 8 | 12 | 7 | 0 | 31 |
| 35,000 decisions a day | No traceable source | 0 | 1 | 7 | 22 | 3 | 0 | 33 |
| 8-second attention span | No traceable source | 1 | 2 | 22 | 34 | 14 | 0 | 73 |
| 23 minutes to refocus | Partly true | 3 | 2 | 6 | 5 | 11 | 0 | 27 |
| Images 60,000 times faster | No traceable source | 1 | 9 | 26 | 71 | 33 | 0 | 140 |
| 11 million bits a second | Partly true | 6 | 5 | 9 | 21 | 13 | 2 | 56 |
| 70% forgotten in 24 hours | Partly true | 0 | 0 | 1 | 2 | 8 | 0 | 11 |
| 100 billion neurons | Partly true | 135 | 222 | 376 | 508 | 133 | 4 | 1,378 |
| 20% of the body’s energy | Supported | 18 | 39 | 84 | 265 | 151 | 7 | 564 |
| 75% water, 60% fat | Partly true | 2 | 9 | 12 | 20 | 1 | 0 | 44 |
| 90% of the brain by age 5 | Partly true | 13 | 7 | 14 | 46 | 27 | 0 | 107 |
| Fully developed at 25 | Partly true | 5 | 10 | 39 | 45 | 17 | 0 | 116 |
Source: OpenAlex [81] (CC0), queried 22 October 2026.
19 When do people look up brain facts?
Daily views of the English Wikipedia article on neurons, where many readers meet the neuron count, follow the school calendar: an average of 937 views on a weekday against 738 at weekends (27% more), with the busiest months in the autumn and winter terms and the quietest in summer. The busiest single day was 8 January 2025, with 1,777 views [82].
When people look up neurons: every day since January 2025
Daily views of the English Wikipedia article "Neuron" by people (bots excluded), 1 January 2025 to 21 October 2026. Each small grid is a month; rows are weeks, Monday to Sunday. Darker = more views.
- Wed 8 Jan 2025 the busiest day (1,777 views)
- Sat 1 Aug 2026 the quietest day (494 views)
Source: Wikimedia Foundation pageviews API [82] (data CC0), user agents only, all access methods.
Views of "Neuron" on English Wikipedia, by month
| 2025-01 | 33,611 | 1,084 | 2025-01-08 (1,777) |
| 2025-02 | 31,393 | 1,121 | 2025-02-27 (1,437) |
| 2025-03 | 32,284 | 1,041 | 2025-03-18 (1,336) |
| 2025-04 | 27,941 | 931 | 2025-04-21 (1,180) |
| 2025-05 | 26,941 | 869 | 2025-05-14 (1,094) |
| 2025-06 | 22,901 | 763 | 2025-06-02 (1,094) |
| 2025-07 | 23,941 | 772 | 2025-07-22 (920) |
| 2025-08 | 27,718 | 894 | 2025-08-25 (1,119) |
| 2025-09 | 34,025 | 1,134 | 2025-09-16 (1,392) |
| 2025-10 | 35,442 | 1,143 | 2025-10-06 (1,615) |
| 2025-11 | 31,375 | 1,046 | 2025-11-04 (1,228) |
| 2025-12 | 24,803 | 800 | 2025-12-04 (1,148) |
| 2026-01 | 27,806 | 897 | 2026-01-27 (1,150) |
| 2026-02 | 25,571 | 913 | 2026-02-10 (1,169) |
| 2026-03 | 25,452 | 821 | 2026-03-10 (1,082) |
| 2026-04 | 24,814 | 827 | 2026-04-21 (1,128) |
| 2026-05 | 23,476 | 757 | 2026-05-04 (1,017) |
| 2026-06 | 19,142 | 638 | 2026-06-02 (813) |
| 2026-07 | 19,926 | 643 | 2026-07-28 (730) |
| 2026-08 | 19,437 | 627 | 2026-08-27 (898) |
| 2026-09 | 25,031 | 834 | 2026-09-17 (1,066) |
| 2026-10 (to 21 Oct) | 16,775 | 799 | 2026-10-06 (1,101) |
Source: Wikimedia pageviews API [82] (CC0).
20 Any of the 12 numbers, in one sentence
Pick a number to see its verdict, where it came from and how many research papers repeat it, with a card to share.
We have 60,000 to 70,000 thoughts a day
- Verdict
- No traceable source
- Traced toNo study; credited to an NSF article nobody has found
- 2003 or earlier
- Research papersjournal articles repeating it
- 31
No study has counted 60,000 or 70,000 thoughts a day. The only brain-data estimate, a 2020 study of 184 young adults, found about 6.5 new thoughts a minute, which works out at roughly 6,200 a day, about a tenth of the popular number.
How to read it: “Supported” means a study measured it for the group it is said of. “Partly true” means a real study exists but the popular version changes the group, the measure or the number. “No traceable source” means the trail ends without a study.
Numbers about the average brain say little about your own. See how your reasoning does: take the IQ test
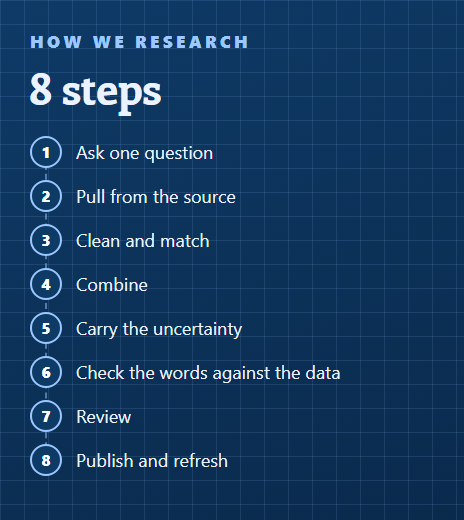
21 How we checked the numbers
- 01
Pick the numbers
Twelve brain or thinking statistics that are widely repeated in news, schools, offices and research, and that can be checked against a source. We left out myths other IQ Metrics pages already cover (the “10% of the brain”, left and right brain, Dunning-Kruger).
- 02
Trace each one back
We followed every citation one step at a time, using archived copies of web pages (Wayback Machine), books and papers, until the trail reached a study or ran out. “Earliest” means the earliest dated copy we could find.
- 03
Read the best evidence
For each claim we read the study that measured the thing, took numbers from its text or tables rather than from summaries, and checked Crossref for retractions, corrections and expressions of concern.
- 04
Give a verdict
Supported: a study measured it and the popular number holds for the group it is said of. Partly true: a real study exists but the popular version changes the group, the measure or the number. No traceable source: the trail ends without a study.
- 05
Count research papers
OpenAlex full-text phrase search, journal articles only (type “article”), all years to 21 October 2026. We checked the ten most-cited matches for each query and tightened three queries that caught unrelated text (temperatures, reaction rates, scan durations). Search phrases are in the CSV.
- 06
Count page views
Wikimedia pageviews API: daily views of the English Wikipedia article “Neuron” by people (not bots), 1 January 2025 to 21 October 2026.
- 07
Recheck every number
A separate script and a second reader recomputed every number on this page from the saved source files and data; each one passed before publication.
- 08
Publish the data
The ledger is a CSV under CC BY 4.0, with the search phrases, the sources and the date checked. The raw responses are kept so every count can be re-run.
- Supported
- A study measured it, and the popular number holds for the group it is usually said of.
- Partly true
- A real study exists, but the popular version changes the group, the measure or the number.
- No traceable source
- The trail ends at a website, an advertisement or “various sources”, with no study behind the number.
What this ledger cannot tell you
- A verdict is a judgement. We publish the definitions and the evidence, so a reader can grade a borderline claim differently.
- The earliest use is the earliest dated copy we found; older uses may exist, especially in print.
- Paper counts are lower bounds. OpenAlex holds the full text of only part of the literature, phrase search misses paraphrases, and some matches quote a number to correct it or match by coincidence.
- The best evidence is often thin: one brain-scan method in 184 young adults for thoughts, nine brains in two studies for neurons, one cadaver for the 1945 water figure.
- Wikipedia views measure interest in one English article, not belief in a number.
- This page summarises published evidence about the brain; it is not medical or health advice.
Numbers about the average brain say little about yours.
The IQ Metrics test measures your own pattern reasoning, with no tools and no shortcuts.
Take the IQ testSources
- Nature Communications 11, 3480 (CC BY 4.0). Tseng and Poppenk: Brain meta-state transitions demarcate thoughts across task contexts exposing the mental noise of trait neuroticism. 2020. doi.org/10.1038/s41467-020-17255-9
- Queen's University. Queen's Gazette: Discovery of thought worms opens window to the mind (press release on Tseng and Poppenk). 2020. www.queensu.ca/gazette/stories/discovery-thought-worms-opens-window-mind
- HVAC Profit Boosters, Wayback Machine copy of 3 March 2012. Charlie Greer: What are you thinking? Part deux (credits the "National Science Foundation"; archived copy). undated. web.archive.org/web/20120303183201/http://www.hvacprofitboosters.com:80/what-are-you-thinking-part-deux-by-charlie-greer.php
- Chopra Center, Wayback Machine copy of 21 November 2007. Chopra Center: Namaste newsletter, May 2007 (archived copy). 2007. web.archive.org/web/20071121073223/http://www.chopra.com:80/namaste/may07
- LONI, UCLA; Wayback Machine copy of 22 August 2011. Laboratory of Neuro Imaging: Brain Trivia (archived copy). 2011. web.archive.org/web/20110822235247/http://www.loni.ucla.edu/About_Loni/education/brain_trivia.shtml
- Forbes. Christine Comaford: Got Inner Peace? 5 Ways To Get It NOW. 2012. www.forbes.com/sites/christinecomaford/2012/04/04/got-inner-peace-5-ways-to-get-it-now
- Discover. Neuroskeptic: The 70,000 thoughts per day myth?. 2012. www.discovermagazine.com/mind/the-70-000-thoughts-per-day-myth
- PolicyViz. Jon Schwabish: Fact-checking 60,000 thoughts: the mystery behind a misleading statistic. 2024. policyviz.com/2024/10/16/fact-checking-60000-thoughts-the-mystery-behind-a-misleading-statistic
- The Straits Times. Power through 60,000 thoughts a day: begin with a walk nearby. 2024. www.straitstimes.com/opinion/power-through-60000-thoughts-a-day-begin-with-a-walk-nearby
- Roberts Wesleyan College, Leading Edge Journal; Wayback Machine copy of 18 April 2015. Joel Hoomans: 35,000 Decisions: The Great Choices of Strategic Leaders (archived copy). 2015. web.archive.org/web/20150418025308/http://go.roberts.edu:80/leadingedge/the-great-choices-of-strategic-leaders
- Psychology Today. Eva Krockow: How Many Decisions Do We Make Each Day?. 2018. www.psychologytoday.com/us/blog/stretching-theory/201809/how-many-decisions-do-we-make-each-day
- CNN Health. Megan Marples: Decision fatigue drains you of your energy to make thoughtful choices. Here's how to get it back. 2022. www.cnn.com/2022/04/21/health/decision-fatigue-solutions-wellness/index.html
- Did The Research (Substack). El Call: Do We Really Make 35,000 Decisions a Day?. 2024. didtheresearch.substack.com/p/do-we-really-make-35000-decisions
- Environment and Behavior 39(1), 106-123. Wansink and Sobal: Mindless Eating: The 200 Daily Food Decisions We Overlook. 2007. doi.org/10.1177/0013916506295573
- Environment and Behavior (notice dated 17 March 2026, listed by Crossref). Expression of Concern: Mindless Eating: The 200 Daily Food Decisions We Overlook. 2026. doi.org/10.1177/00139165261429708
- Appetite 209, 107928. Claassen, Mata and Hertwig: The (mis-)measurement of food decisions. 2025. doi.org/10.1016/j.appet.2025.107928
- Max Planck Society. Max Planck Institute for Human Development: The myth of 200 daily food decisions. 2025. www.mpg.de/25028482/the-myth-of-200-daily-food-decisions
- Statistic Brain Research Institute; Wayback Machine copy of 8 February 2012. Statistic Brain: Attention Span Statistics (archived copy). 2012. web.archive.org/web/20120208152927/http://www.statisticbrain.com/attention-span-statistics
- Microsoft Canada; Wayback Machine copy of 28 May 2015. Microsoft Canada: Attention spans, Consumer Insights (report, p. 6; archived copy). 2015. web.archive.org/web/20150528104806/http://advertising.microsoft.com:80/en/WWDocs/User/display/cl/researchreport/31966/en/microsoft-attention-spans-research-report.pdf
- Time. You Now Have a Shorter Attention Span Than a Goldfish. 2015. time.com/3858309/attention-spans-goldfish
- BBC News / BBC World Service More or Less. Simon Maybin: Busting the attention span myth. 2017. www.bbc.com/news/health-38896790
- Proceedings of CHI 2004, ACM, 113-120. Gonzalez and Mark: "Constant, constant, multi-tasking craziness": managing multiple working spheres. 2004. doi.org/10.1145/985692.985707
- Proceedings of CHI 2016, ACM, 1739-1744. Mark, Iqbal, Czerwinski, Johns and Sano: Neurotics can't focus: an in situ study of online multitasking in the workplace. 2016. doi.org/10.1145/2858036.2858202
- Science 167(3917), 389-390. Behrend, Powers and Bitterman: Interference and forgetting in bird and fish. 1970. doi.org/10.1126/science.167.3917.389
- Proceedings of CHI 2005, ACM, 321-330. Mark, Gonzalez and Harris: No task left behind? Examining the nature of fragmented work. 2005. doi.org/10.1145/1054972.1055017
- Fast Company; Wayback Machine copy of 14 September 2012. Kermit Pattison: Worker, Interrupted: The Cost of Task Switching (interview with Gloria Mark; archived copy). 2008. web.archive.org/web/20120914014132/http://www.fastcompany.com:80/944128/worker-interrupted-cost-task-switching
- Proceedings of CSCW 2015, ACM. Mark, Iqbal, Czerwinski and Johns: Focused, aroused, but so distractible: a temporal perspective on multitasking and communications. 2015. doi.org/10.1145/2675133.2675221
- Proceedings of CHI 2008, ACM, 107-110. Mark, Gudith and Klocke: The cost of interrupted work: more speed and stress. 2008. doi.org/10.1145/1357054.1357072
- University of California. University of California: Can't pay attention? You're not alone (podcast with Gloria Mark). 2023. www.universityofcalifornia.edu/news/cant-pay-attention-youre-not-alone
- CogDog Blog. Alan Levine: The 60,000 Times Faster Claim Gets Dialed Back to 1982. 2015. cogdogblog.com/2015/03/dialed-back-to-1982
- University of Minnesota MISRC; Wayback Machine copy. Vogel, Dickson and Lehman: Persuasion and the role of visual presentation support: the UM/3M study (working paper 86-11; archived copy). 1986. web.archive.org/web/2016id_/http://misrc.umn.edu/workingpapers/fullpapers/1986/8611.pdf
- 3M; Wayback Machine copy of 28 January 1999. 3M Meeting Network: Polishing Your Presentation (archived copy). 1999. web.archive.org/web/19990128112253/http://www.3m.com:80/meetingnetwork/readingroom/meetingguide_pres.html
- CogDog Blog. Alan Levine: The 60,000 Times Question Remains Unanswered. 2012. cogdogblog.com/2012/07/60000-times-question
- PolicyViz. Jon Schwabish: The 60,000 Fallacy. 2015. policyviz.com/2015/09/17/the-60000-fallacy
- arXiv 2404.04308. Wang, Yang and Pan: Visual Knowledge in the Big Model Era: Retrospect and Prospect (preprint). 2024. arxiv.org/abs/2404.04308
- Attention, Perception, and Psychophysics 76(2), 270-279. Potter, Wyble, Hagmann and McCourt: Detecting meaning in RSVP at 13 ms per picture. 2014. doi.org/10.3758/s13414-013-0605-z
- Nature 381, 520-522. Thorpe, Fize and Marlot: Speed of processing in the human visual system. 1996. doi.org/10.1038/381520a0
- Journal of Memory and Language 109, 104047. Brysbaert: How many words do we read per minute? A review and meta-analysis of reading rate. 2019. doi.org/10.1016/j.jml.2019.104047
- Viking / Penguin. Tor Norretranders: The User Illusion: Cutting Consciousness Down to Size (book; English edition 1998; the linked copy is the 1999 Penguin printing). 1998. archive.org/details/userillusioncutt0000nrre
- American Educator, Winter 2015-2016 (American Federation of Teachers). Cheryl Staats: Understanding Implicit Bias. 2016. www.aft.org/ae/winter2015-2016/staats
- Neuron 113(2), 192-204. Zheng and Meister: The unbearable slowness of being: Why do we live at 10 bits/s?. 2025. doi.org/10.1016/j.neuron.2024.11.008
- Classics in the History of Psychology, York University (public domain text). Hermann Ebbinghaus: Memory: A Contribution to Experimental Psychology (1885; English translation 1913), chapter 7. 1885. http://psychclassics.yorku.ca/Ebbinghaus/memory7.htm
- PLOS ONE 10(7), e0120644 (CC BY 4.0). Murre and Dros: Replication and Analysis of Ebbinghaus' Forgetting Curve. 2015. doi.org/10.1371/journal.pone.0120644
- Learning Solutions Magazine; Wayback Machine copy of 24 April 2014. Art Kohn: Brain Science: The Forgetting Curve, the Dirty Secret of Corporate Training (archived copy). 2014. web.archive.org/web/20140424065921/http://www.learningsolutionsmag.com:80/articles/1379
- Work-Learning Research. Will Thalheimer: How Much Do People Forget? (research review; archived copy). 2010. web.archive.org/web/2016id_/http://willthalheimer.typepad.com/files/how-much-do-people-forget-v12-14-2010-2.pdf
- TalentLMS blog. What is the Ebbinghaus forgetting curve?. 2023. www.talentlms.com/blog/ebbinghaus-forgetting-curve
- Journal of Comparative Neurology 513(5), 532-541. Azevedo et al.: Equal numbers of neuronal and nonneuronal cells make the human brain an isometrically scaled-up primate brain. 2009. doi.org/10.1002/cne.21974
- Journal of Comparative Neurology 524(18), 3865-3895. von Bartheld, Bahney and Herculano-Houzel: The search for true numbers of neurons and glial cells in the human brain: a review of 150 years of cell counting. 2016. doi.org/10.1002/cne.24040
- Brain 136(12), 3738-3752. Andrade-Moraes et al.: Cell number changes in Alzheimer's disease relate to dementia, not to plaques and tangles. 2013. doi.org/10.1093/brain/awt273
- Brain 148(3), 689-691 (CC BY 4.0). Alain Goriely: Eighty-six billion and counting: do we know the number of neurons in the human brain?. 2025. doi.org/10.1093/brain/awae390
- Brain 148(5), e37-e38. Roberto Lent: Yes, the human brain has around 86 billion neurons (letter). 2025. doi.org/10.1093/brain/awaf048
- Frontiers in Human Neuroscience 3, 31. Herculano-Houzel: The human brain in numbers: a linearly scaled-up primate brain. 2009. doi.org/10.3389/neuro.09.031.2009
- PNAS 99(16), 10237-10239. Raichle and Gusnard: Appraising the brain's energy budget. 2002. doi.org/10.1073/pnas.172399499
- PNAS 111(36), 13010-13015. Kuzawa et al.: Metabolic costs and evolutionary implications of human brain development. 2014. doi.org/10.1073/pnas.1323099111
- Journal of Biological Chemistry 158, 625-637 (Table I). Mitchell, Hamilton, Steggerda and Bean: The chemical composition of the adult human body and its bearing on the biochemistry of growth. 1945. doi.org/10.1016/S0021-9258(19)51339-4
- Journal of Lipid Research 6(4), 537-544 (Table 1). O'Brien and Sampson: Lipid composition of the normal human brain: gray matter, white matter, and myelin. 1965. doi.org/10.1016/S0022-2275(20)39619-X
- Frontiers in Neurology 10, 1333 (CC BY). Oros-Peusquens et al.: A single-scan, rapid whole-brain protocol for quantitative water content mapping with neurobiological implications. 2019. doi.org/10.3389/fneur.2019.01333
- Acta Neurologica Taiwanica 18(4), 231-241 (PMID 20329590). Chang, Ke and Chen: Essential fatty acids and human brain. 2009. pubmed.ncbi.nlm.nih.gov/20329590
- Journal of Cell Biology 220(7), e202102136. Ralhan, Chang, Lippincott-Schwartz and Ioannou: Lipid droplets in the nervous system. 2021. doi.org/10.1083/jcb.202102136
- Guinness World Records. Guinness World Records: Fattiest organ. undated. www.guinnessworldrecords.com/world-records/594894-fattiest-organ
- Live Science. Human Brain: Facts, Functions and Anatomy. 2021. www.livescience.com/29365-human-brain.html
- USGS; Wayback Machine copy of 10 March 2014. US Geological Survey Water Science School: The Water in You (archived copy). 2014. web.archive.org/web/20140310095857/http://water.usgs.gov/edu/propertyyou.html
- Neuron 67(5), 728-734. Giedd and Rapoport: Structural MRI of pediatric brain development: what have we learned and where are we going?. 2010. doi.org/10.1016/j.neuron.2010.08.040
- Progress in Neurobiology 106-107, 1-16. Semple et al.: Brain development in rodents and humans: identifying benchmarks of maturation and vulnerability to injury across species. 2013. doi.org/10.1016/j.pneurobio.2013.04.001
- Nature Reviews Neuroscience 19(3), 123-137. Gilmore, Knickmeyer and Gao: Imaging structural and functional brain development in early childhood. 2018. doi.org/10.1038/nrn.2018.1
- Journal of Neuroscience 31(30), 10937-10947. Lebel and Beaulieu: Longitudinal development of human brain wiring continues from childhood into adulthood. 2011. doi.org/10.1523/JNEUROSCI.5302-10.2011
- RWJF; Wayback Machine copy of 7 March 2014. Robert Wood Johnson Foundation Commission to Build a Healthier America: Time to Act (report, p. 43; archived copy). 2014. web.archive.org/web/20140307173640/http://www.rwjf.org/content/dam/farm/reports/reports/2014/rwjf409002
- Royal College; Wayback Machine copy of 10 October 2015. Royal College of Physicians and Surgeons of Canada: Early Childhood Development, position statement (archived copy). 2014. web.archive.org/web/20151010145016/http://www.royalcollege.ca/portal/page/portal/rc/common/documents/advocacy/EBBDEL_statement_e.pdf
- First Things First, Arizona; Wayback Machine copy of 14 May 2018. First Things First: Brain Development (archived copy). 2018. web.archive.org/web/20180514182627/www.firstthingsfirst.org/early-childhood-matters/brain-development
- University of Connecticut. UConn KIDS: Trivia Tuesday. 2025. kids.uconn.edu/2025/09/16/trivia-tuesday-29
- Discover. Supporting A Child's Rapidly Developing Brain. 2022. www.discovermagazine.com/mind/supporting-a-childs-rapidly-developing-brain
- Harvard University; Wayback Machine copy of 6 July 2020. Center on the Developing Child: Brain Architecture (with the footnote on the revised estimate; archived copy). 2020. web.archive.org/web/20200706192610/http://developingchild.harvard.edu/science/key-concepts/brain-architecture
- Nature 604, 525-533 (CC BY 4.0; a 2022 publisher correction changed author affiliations only). Bethlehem et al.: Brain charts for the human lifespan. 2022. doi.org/10.1038/s41586-022-04554-y
- PNAS 101(21), 8174-8179. Gogtay et al.: Dynamic mapping of human cortical development during childhood through early adulthood. 2004. doi.org/10.1073/pnas.0402680101
- Time, 10 May 2004. Claudia Wallis and Kristina Dell: What Makes Teens Tick. 2004. content.time.com/time/subscriber/article/0,33009,994126,00.html
- NBC News. Elizabeth Williamson: Brain immaturity can be deadly (Washington Post story). 2005. www.nbcnews.com/news/amp/wbna6891821
- Neuropsychiatric Disease and Treatment 9, 449-461. Arain et al.: Maturation of the adolescent brain. 2013. doi.org/10.2147/NDT.S39776
- Journal of Adolescent Health 45(3), 216-221. Johnson, Blum and Giedd: Adolescent maturity and the brain: the promise and pitfalls of neuroscience research in adolescent health policy. 2009. doi.org/10.1016/j.jadohealth.2009.05.016
- Slate. Jane C. Hu: The Myth of the 25-Year-Old Brain. 2022. slate.com/technology/2022/11/brain-development-25-year-old-mature-myth.html
- Nature Communications 16, 10055 (CC BY 4.0). Mousley, Bethlehem, Yeh and Astle: Topological turning points across the human lifespan. 2025. doi.org/10.1038/s41467-025-65974-8
- OurResearch (data CC0). OpenAlex: works API, full-text phrase search, journal articles (type "article"), queried 22 October 2026. 2026. openalex.org
- Wikimedia Foundation (data CC0). Wikimedia pageviews API: daily views of "Neuron" on English Wikipedia, user agents, 1 January 2025 to 21 October 2026. 2026. wikimedia.org/api/rest_v1
- Internet Archive. Internet Archive Wayback Machine: archived copies of the pages cited above. 2026. web.archive.org
Version history
- 2026.1022 October 2026First release: 12 claims traced and checked; paper counts from OpenAlex to 21 October 2026; Wikipedia views to 21 October 2026.
Leon Falkner, Data & Research Analyst. Leon owns the arithmetic on IQ Metrics: the percentile tables, the score converter and the figures in everyone else's drafts. On the research desk Leon pulls the data, builds each index and writes the method. More about Leon.
Questions
How many thoughts does a person have per day?
Nobody has counted. The only brain-scan estimate, from a 2020 study of 184 young adults, is about 6.5 new thoughts a minute, roughly 6,200 a day. The popular 60,000 or 70,000 has no study behind it.
Is the human attention span really 8 seconds, shorter than a goldfish?
No. The 8 seconds and the goldfish's 9 seconds came from a statistics website that named no study, and spread through a 2015 Microsoft Canada report. Attention depends on the task; there is no single span to measure.
How many neurons are in the human brain?
About 86 billion according to the first direct count (four men, 2009), and 67 billion in a second count of five older women (2013). The older 100 billion was a round textbook figure with no count behind it.
Does the brain use 20% of the body's energy?
For adults at rest, yes: about 20% while the brain is about 2% of body weight. Over a whole day it is about 11% to 15%, and at about age 4 the brain uses about two thirds of the body's resting energy.
Is the brain fully developed at 25?
No study found that. The age traces to a 2004 magazine quote about how long a scanning study would follow volunteers. Different parts of the brain peak at different ages, and a 2025 study found an adolescent wiring pattern until about 32.
Can I use this data?
Yes. The ledger and the counts are published under CC BY 4.0: reuse them with credit to IQ Metrics Research and a link to this page. The studies we cite are other researchers' work; cite them as listed.
Share it, cite it, download it
You may reuse everything on this page under CC BY 4.0: in articles, reports, lessons and posts. The one condition is credit to IQ Metrics with a link to this page.
Cite this study
Version 2026.10. Citing the version lets readers find the exact numbers.
Archived copy with a DOI: 10.5281/zenodo.23559582 (report PDF and data on Zenodo).
Falkner, L. (2026). The brain numbers everyone quotes, checked (Version 2026.10) [Data set]. IQ Metrics Research. https://iqmetrics.org/research/brain-statistics-fact-check/ (DOI: 10.5281/zenodo.23559582)
Falkner, Leon. "The brain numbers everyone quotes, checked." IQ Metrics Research, 22 Oct. 2026, iqmetrics.org/research/brain-statistics-fact-check/. DOI: 10.5281/zenodo.23559582.
Falkner, Leon. "The brain numbers everyone quotes, checked." IQ Metrics Research. October 22, 2026. https://iqmetrics.org/research/brain-statistics-fact-check/. DOI: 10.5281/zenodo.23559582.
@misc{iqmetrics2026brainstatisticsfactcheck, author = {Falkner, Leon}, title = {The brain numbers everyone quotes, checked}, institution = {IQ Metrics}, year = {2026}, version = {2026.10}, doi = {10.5281/zenodo.23559582}, url = {https://iqmetrics.org/research/brain-statistics-fact-check/} }
Source: Leon Falkner, "The brain numbers everyone quotes, checked." IQ Metrics Research, version 2026.10, https://iqmetrics.org/research/brain-statistics-fact-check/ (DOI 10.5281/zenodo.23559582)
Embed the scorecard
Paste this into your page or post. It lists the verdicts and credits the source.
Get the data
One row per viral brain statistic: the popular number, where it is repeated, its traced origin, the best current evidence, our verdict, the number of journal articles in OpenAlex that repeat it, the exact search phrases, key sources and the date checked.
| Column | What it holds |
|---|---|
id, claim, popular_number | The claim as usually stated and the numbers people quote |
where_repeated, traced_origin, origin_year | Prominent repetitions and the earliest dated source we found |
best_evidence, best_estimate | What the best current study found, in one line |
verdict | Supported, Partly true or No traceable source (definitions in the method) |
journal_articles_repeating, openalex_search | OpenAlex count of journal articles whose text contains the phrase (all years to 21 Oct 2026) and the exact query |
key_sources, checked_on | DOIs of the main sources and the date we checked them |
For journalists, researchers and teachers
Everything on this page may be quoted, charted and republished with credit. No embargo and no sign-up. If you know an earlier source for any number, tell us and we will check it for the next version.
Summary you can paste
Plain news style. Edit freely; keep the credit.
Most viral brain statistics do not hold up, according to an IQ Metrics Research ledger that traced 12 of them to their sources. One, the adult brain's 20% share of resting energy, is supported as usually stated; seven are partly true; and four, 60,000 thoughts a day, 35,000 decisions a day, the 8-second "goldfish" attention span and images processed 60,000 times faster than text, trace to no study. At least 277 journal articles indexed in OpenAlex repeat one of those four. Source: IQ Metrics Research, https://iqmetrics.org/research/brain-statistics-fact-check/
Angles for a story
- Four numbers with no source, still in at least 277 journal articles (the paper count).
- The neuron switch: 2026 is the first year research papers give 86 billion more often than 100 billion (how many neurons).
- How “fully developed at 25” grew out of a 2004 magazine quote (the trails).
- Close but wrong: viral percentages that match a real number measuring something else (the chart).
- The study behind “200 food decisions a day” now carries an expression of concern (decisions).
Quotes you can use
Attributable as written, with the name and title. For a different angle or a quote on a specific figure, ask through the contact page.
Four of the twelve numbers lead nowhere: a website, an advertisement, “various internet sources”. They are still in at least 277 journal articles, which shows how a number earns trust just by being repeated.
Leon Falkner, Data & Research Analyst, IQ Metrics ResearchThe most misleading numbers are often close to a real measurement. The brain does use about 20% of resting energy, and it is about 60% fat by dry weight. The trouble starts when the words around the number fall away.
Leon Falkner, Data & Research Analyst, IQ Metrics ResearchNobody has counted 60,000 thoughts a day. The one brain-scan estimate is about 6,200, and its own authors call it tentative.
Leon Falkner, Data & Research Analyst, IQ Metrics Research
Files
- CSV, one row per claim, 13 columns (CC BY 4.0)
- Every figure as a print-ready PNG: white background, 2000 px wide, title and source line included. Use the Image button under each figure
- Share images for social media in three sizes, with the credit line built in
- A card for any number, 1200 x 630 PNG
- Citations in APA, MLA, Chicago, BibTeX and plain text, and embed code for the scorecard
Terms, contact and corrections
Credit: “IQ Metrics Research, The brain numbers everyone quotes, checked (2026)” with a link to this page. On air or in print, “IQ Metrics” and the page address are enough.
The studies are other researchers’ work: cite each one as listed in Sources. The tracing, the verdicts and the counts are ours.
Corrections: made on this page with a dated note in the version history.