



Research you can check, cite and reuse
Original studies, rankings and technical reports from the IQ Metrics research team. Every number links to its source, every study publishes its method, and the data is yours to download under CC BY 4.0.
- Named primary sources
- Method with every study
- Open data, CC BY 4.0
Every study, newest first
Data studies built from public sources, reports from our own test results, explainers of published research and technical reports. Filter by type or search by topic, place or source.
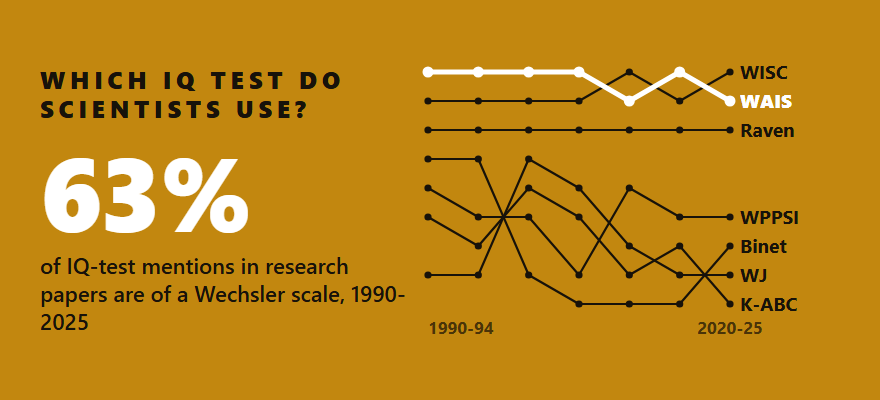
Which IQ test do scientists use? The Wechsler scales, in 16,721 papers
Papers naming each of 38 IQ and cognitive tests, 1990-2025, counted in two indexes: the Wechsler scales lead, Raven's is catching up, and old editions linger.
Key finding16,721 Wechsler papers (63%); Raven's 3,290; 60% of recent WAIS/WISC papers name a replaced edition.

How much of the brain have we mapped? 21 connectomes, 1986 to 2026
Every published connectome we could read, from a roundworm to a cubic millimetre of human cortex, with neurons, synapses, teams and what a whole mouse or human brain would take.
Key finding21 connectomes; fruit fly 166,700 neurons; mouse 0.12% mapped; human 0.00002%.

How fast do humans think? 47 activities measured in bits per second
Forty-seven human activities, from typing and speech to memory records, the Rubik's Cube and brain chips, turned into bits per second and set against the "10 bits per second" claim.
Key finding47 activities; median 7.5 bits/s; 24 below 10; speech 39 bits/s; best brain chip 7.2.

Does heat affect your brain? 36 studies and 41 exam windows, measured
Every study we could read on heat and thinking, plus our own count of how hot national exam days have become in 40 cities since 1981.
Key finding18 of 27 studies: worse when hotter; 33 of 41 exam windows hotter (+0.68 °C).

Can a dish of brain cells be intelligent? Organoid intelligence, every experiment counted
Every published experiment on living neurons and brain organoids, graded for evidence, with the CL1 neuron-count conflict and the "million times less energy" claim traced to their sources.
Key finding23 experiments; 10 of 20 pass all five checks; 0 replications found; dishes hold 70,000-1,000,000 cells.

Are human brains shrinking? Every measured skull, 7 million years
Every measured skull from Sahelanthropus to today in one table, from three open datasets, and what they say about the claim that human brains shrank 3,000 years ago.
Key findingH. sapiens skulls: 1,458 cc older than 11,700 years, 1,297 cc in the last 100 years; 48.8% of skulls are from the last 100 years.

What happens to the brain in space? Every astronaut brain study
Every peer-reviewed study of the brains and thinking of people who flew in space: how the brain moves and swells, whether it recovers, and whether astronauts think any worse.
Key findingFluid spaces +11.6% to +24%; still +6.4% at 7 months; brain 2.52 mm higher after a year; no lasting drop in thinking.

How smart were dinosaurs? Every dinosaur brain measured
Every measured dinosaur brain on one scale of brain size for body size, the T. rex neuron dispute, and how few dinosaurs have ever had their brain measured.
Key findingTroodon 6.5x a reptile's brain; T. rex 1.2-2.2; T. rex neurons 0.25-3.3 bn; 45 of 1,851 genera measured.

How far can human memory go? Memory world records, 1993-2026
Every memory world record since 1993, against athletics records and a normal memory span: how far trained memory goes, how fast the records grew, and who holds them.
Key findingDeck of cards 12.74 s; 4,620 digits an hour (685x a normal span); memory up to 841% vs sport 9%.

Higher IQ than Einstein? Every "162" Mensa child in the news, counted
Every news story that said a child has a higher IQ than Einstein or Hawking, 2007 to 2026: how many, the score they share, and what it is on the usual IQ scale.
Key finding307 stories, 74 children; 91% give 162, the test's top; 162 is about 139 on the usual scale; 3 explain it.

How many people have a brain chip? Every implant counted, 1998-2026
Every person who has had a brain-computer interface implanted for long-term use, 1998 to October 2026: how many, where, why, and how fast the number is growing.
Key findingAt least 138 people; 69 since 2024; China's new programmes 45 vs Neuralink 21; NEO approved for sale.

AI vs the world's best teen mathematicians
Where every AI result at the Math Olympiad would have ranked among the human contestants, 2024-2026, and 67 years of Olympiad results.
Key findingIMO-certified AI gold: joint 27th of 630; the problem every AI missed: 6 humans solved it; 42.1% of Fields Medallists since 1990 were IMO medallists.

Where were history's great minds born?
3,553 great minds born 1400-1999 by birthplace: per million people, by century and city, with the golden ages of cities and where prize winners moved.
Key findingSwitzerland leads per head (5.6 per million per century); the United States by count (950); Vienna's golden age 1875-1924.

How old were history's great minds at their breakthrough?
How old the winners of 663 science prizes and 132 historical geniuses were when they made their breakthrough, 1901-2026.
Key findingMedian age 39; physics 35, chemistry 39, medicine 39; 11% at 50 or older; the wait for the prize now 30 years.

Famous brains weighed: did history's great minds have bigger brains?
Every recorded brain weight of 136 famous people, from 19th-century autopsy reports to Einstein, against the average for their age and sex: who was heavier, where the records disagree, and whether size tracked IQ.
Key finding87% heavier than average for their age; Turgenev 2,012 g; Einstein 1,230 g; no link to IQ estimates.

Which famous brain and intelligence findings held up?
56 famous brain and intelligence findings, each matched with its largest independent replication: what held up, how much effects shrank, and who still cites the failures.
Key finding43% held up, 26 failed; replication effects were 62% smaller; failed findings were still cited.

The world's shortest IQ test: how many people really pass it?
Every published result of the bat-and-ball problem we could read in the original, pooled: how many people solve the "world's shortest IQ test", by country and kind of sample.
Key finding35% solve the bat-and-ball problem; 21% get all three right; the famous 17% is 2005 US students.

The IQs of 301 geniuses: Cox's 1926 estimates, in full
Catharine Cox's 1926 IQ estimates for 301 historical geniuses, transcribed in full from her fold-out tables and checked: why the famous 180-plus figures are corrected numbers.
Key findingOnly 9 of 301 at 180+ before correction, 57 after; correction adds 20 points on average; Shakespeare unrated.

Which universities produce the most prize-winning scientists?
Where 1,571 winners of the Nobel, Fields, Turing and 15 other top prize categories took their first degree and their doctorate, 1901-2026.
Key findingHarvard 142, then Cambridge (101), Berkeley (81) and MIT (80); Harvard awarded the most doctorates; MIT second since 2000.

Which big employers use aptitude tests?
What the graduate and intern hiring pages of 200 big UK, European and US employers say about aptitude tests, video interviews, assessment centres and AI.
Key finding26% name a reasoning test; 16 name the type; 9 name the test company.

Smartest animals: neurons vs test scores in 222 species
Published neuron counts for 222 species set beside the one self-control test given the same way to dozens of species: who comes first depends on the measure.
Key findingElephant: most neurons (257 billion); pilot whale: most cortex neurons; ravens tie chimpanzees at 100%.

What teachers believe about the brain: neuromyths by country
Every published survey since 2012 of teachers' belief in brain myths, pooled myth by myth: 41 survey samples, 23,424 teachers, 25 countries.
Key finding93% of teachers believe in learning styles and 46% that we use only 10% of our brain; no clear decline since 2012.

The brain numbers everyone quotes, checked
Twelve viral brain statistics traced to their sources and checked against the best current study, with counts of the research papers that still repeat them.
Key findingOnly 1 of 12 holds up as usually stated; 4, including 60,000 thoughts a day, trace to no study.

Terman's Termites: what happened to 1,528 gifted children
Lewis Terman's 1921 study of 1,528 high-IQ California children, rebuilt from its published tables: how they were found, who was missed, and how their lives turned out to 1955.
Key findingYoungest in class beat the teacher's pick (88 vs 70); 121 boys per 100 girls; 70% of men with degrees by 1955.

The smartest places in the UK, 2026
All 361 UK council areas: England's ranked on adults' qualifications, GCSE and primary results; Wales, Scotland and Northern Ireland on adult qualifications.
Key findingRichmond upon Thames ranks first and Fenland last; 25 of the top 50 are in London.

The smartest cities in America, 2026: all 387 metros ranked on intellectual life
All 387 US metro areas ranked on bookstores, public libraries, museums, colleges and graduate degrees per person, with rank ranges, a rank within each size group and the 39 intellectual deserts.
Key findingAmherst-Northampton, MA ranks first; Boston, MA is the top big city; 39 metros are intellectual deserts.

Gifted students by US state, 2026
Every state ranked on the share of public-school students in gifted and talented programs (CRDC 2023-24), with access by school, poverty and place, and a comparison with NAEP Advanced scores.
Key finding7.0% nationally; Maryland 21.0%, Vermont 1 student; 2.3x the access in low-poverty schools.

The smartest countries in the world, 2026
86 countries ranked on PISA 2025 test scores and research output per person, with each country's change since 2012 and how its adults compare.
Key findingSingapore ranks first; 50 of 59 countries scored lower than in 2012.

Mensa by the numbers
Mensa membership by country and per person, the worldwide total its own websites disagree on, and 39 children who joined in two years of news.
Key findingSweden has the most members per person; the national counts add up to about 143,000.

AI and your brain: every study on AI use and thinking
56 studies of generative AI and thinking, each checked against the paper: memory, learning, critical thinking, creativity and brain activity, with what each found and its limits.
Key finding19 studies found worse results with AI, 16 better and 17 mixed; it depends on how the AI is used.

The smartest states in the US, 2026
All 50 states ranked on NAEP 2024 school test scores and the share of adults with a college degree, with income, school spending, adult skills and the change since 2006 beside the ranking.
Key findingMassachusetts ranks first with an index score of 79.1; 49 of 50 states scored lower on NAEP in 2024 than in 2019.

At what age is your brain sharpest?
Peak ages for 15 thinking skills from 756,948 adults: when each skill peaks, how fast it declines, and how education and the time of day relate to scores.
Key findingOverall performance peaks at 25; math reasoning peaks latest, at 36.

How IQ Metrics Research works: methods and standards
The rules behind every study: sources and licences, the eight-step build, own-data privacy rules, uncertainty, how to check a number, independence and corrections.
Key findingSources that forbid commercial reuse are refused; no study is sponsored; own-data groups under 100 people are never published.
No study matches those filters.
Download the data behind every chart
Each dataset is the full table a study was built from, one row per place or group, with a column dictionary in the study's method section.
| Dataset | From the study | Size | Licence | Updated | Download |
|---|---|---|---|---|---|
| Which IQ Test Do Scientists Use? Papers Naming 38 Tests in Two Indexes, 1990-2025 (2026)most-used-iq-tests-2026-11-05-iqmetrics.csv | Which IQ test do scientists use? | 38 rows × 20 columns | CC BY 4.0 | Nov 2026 | Download CSV |
| How Much of the Brain Have We Mapped? Published Connectome Reconstructions 1986-2026 (2026)how-much-of-the-brain-have-we-mapped-2026-iqmetrics.csv | How much of the brain is mapped? | 21 rows × 25 columns | CC BY 4.0 | Nov 2026 | Download CSV |
| How Fast Do Humans Think? 47 Human Activities in Bits per Second (2026)how-fast-do-humans-think-2026-iqmetrics.csv | How fast do humans think? | 47 rows × 17 columns | CC BY 4.0 | Nov 2026 | Download CSV |
| Exam-Day Heat in 41 National Exam Windows, 1981-2025, and a Ledger of Heat and Cognition Studies (2026)does-heat-affect-your-brain-2026-iqmetrics.csv | Heat and your brain | 41 rows × 25 columns | CC BY 4.0 | Nov 2026 | Download CSV |
| Organoid Intelligence: Every Experiment and Platform on Living Neurons, with Evidence Grades (2026)organoid-intelligence-2026-iqmetrics.csv | Organoid intelligence | 26 rows × 38 columns | CC BY 4.0 | Nov 2026 | Download CSV |
| Every Measured Skull, 7 Million Years: Endocranial Volumes of Hominins and Chimpanzees from Three Open Datasets (2026)are-human-brains-shrinking-2026-iqmetrics.csv | Are human brains shrinking? | 1223 rows × 25 columns | CC BY 4.0 | Nov 2026 | Download CSV |
| The Brain in Space: Every Peer-Reviewed Study of Astronauts' Brains and Thinking, 1998-2026brain-in-space-studies-2026-iqmetrics.csv | The brain in space | 59 rows × 22 columns | CC BY 4.0 | Nov 2026 | Download CSV |
| Dinosaur Brains: Every Published Brain and Neuron Estimate, with a Consistent Reptile Quotient (2026)dinosaur-brains-2026-iqmetrics.csv | Dinosaur brains | 115 rows × 23 columns | CC BY 4.0 | Nov 2026 | Download CSV |
| Memory World Records, 1973-2026: Every Record on the IAM, WMSC, Memory League and Pi Listsmemory-world-records-2026-iqmetrics.csv | Memory world records | 379 rows × 12 columns | CC BY 4.0 | Oct 2026 | Download CSV |
| Higher IQ Than Einstein? Every News Story Comparing a Child's IQ Score With Einstein or Hawking, 2007-2026higher-iq-than-einstein-2026-iqmetrics.csv | Higher IQ than Einstein? | 307 rows × 19 columns | CC BY 4.0 | Oct 2026 | Download CSV |
| Brain Implants Counted: Every Long-term Brain-Computer Interface Implant, 1998-2026brain-implant-count-2026-iqmetrics.csv | Brain implants counted | 138 rows × 12 columns | CC BY 4.0 | Oct 2026 | Download CSV |
| Math Olympiad and AI: Yearly Facts 1959-2026 and Score Counts 2024-2026ai-vs-math-olympiad-2026-iqmetrics.csv | AI vs Math Olympiad | 196 rows × 16 columns | CC BY 4.0 | Oct 2026 | Download CSV |
| Where Geniuses Are Born: 3,553 Great Minds by Birthplace, 1400-1999where-geniuses-are-born-2026-iqmetrics.csv | Where geniuses are born | 3553 rows × 18 columns | CC BY 4.0 | Oct 2026 | Download CSV |
| Age at the Breakthrough: Prize-Winning Scientists and Historical Geniuses, 1901-2026age-at-breakthrough-2026-iqmetrics.csv | Age at breakthrough | 812 rows × 17 columns | CC BY 4.0 | Oct 2026 | Download CSV |
| Famous Brains Weighed: Post-mortem Brain Weights of 136 Eminent People, 1828-1955famous-brains-weighed-iqmetrics.csv | Famous brains weighed | 136 rows × 24 columns | CC BY 4.0 | Oct 2026 | Download CSV |
| Replication scorecard: famous brain and cognition findings vs their largest replicationsreplication-scorecard-iqmetrics.csv | Replication scorecard | 56 rows × 35 columns | CC BY 4.0 | Oct 2026 | Download CSV |
| Cognitive Reflection Test (bat-and-ball problem) results: published samples 2003-2026worlds-shortest-iq-test-crt-samples-iqmetrics.csv | World's shortest IQ test | 91 rows × 23 columns | CC BY 4.0 | Oct 2026 | Download CSV |
| Cox (1926) IQ Estimates of 301 Historical Geniuses: Tables 12A and 12Biq-of-historical-geniuses-cox-1926-iqmetrics.csv | Cox's 301 geniuses | 312 rows × 25 columns | CC BY 4.0 | Oct 2026 | Download CSV |
| Top Science Prize Winners and Their Universities, 1901-2026universities-with-the-most-prize-winners-2026-iqmetrics.csv | Universities with the most prize winners | 1893 rows × 17 columns | CC BY 4.0 | Oct 2026 | Download CSV |
| Which Employers Use Aptitude Tests? Graduate Selection at 200 Big Employers, October 2026which-employers-use-aptitude-tests-2026-iqmetrics.csv | Which employers use aptitude tests | 200 rows × 30 columns | CC BY 4.0 | Oct 2026 | Download CSV |
| Smartest animals: neurons, brain size and test scores (2026)smartest-animals-neurons-tests-2026-iqmetrics.csv | Smartest animals | 250 rows × 25 columns | CC BY 4.0 | Oct 2026 | Download CSV |
| Neuromyths among teachers: every survey by country, 2012 to 2026 (one row per survey and myth)neuromyths-teachers-surveys-2026-iqmetrics.csv | Neuromyths by country | 229 rows × 25 columns | CC BY 4.0 | Oct 2026 | Download CSV |
| Brain numbers fact-check ledger 2026 (one row per claim)brain-statistics-fact-check-2026-iqmetrics.csv | Brain numbers checked | 12 rows × 13 columns | CC BY 4.0 | Oct 2026 | Download CSV |
| Terman Study of the Gifted: Published Tables 1925-1959terman-study-of-the-gifted-tables-1925-1959-iqmetrics.csv | Terman's gifted children study | 329 rows × 8 columns | CC BY 4.0 | Oct 2026 | Download CSV |
| Smartest Places in the UK 2026smartest-places-in-the-uk-2026-iqmetrics.csv | Smartest places in the UK | 361 rows × 32 columns | CC BY 4.0 | Oct 2026 | Download CSV |
| Intellectual Life Index 2026: US metropolitan areassmartest-cities-2026-acs2024-iqmetrics.csv | Smartest cities | 387 rows × 41 columns | CC BY 4.0 | Oct 2026 | Download CSV |
| Gifted Students by US State 2026gifted-students-by-state-2026-iqmetrics.csv | Gifted students by US state | 51 rows × 31 columns | CC BY 4.0 | Oct 2026 | Download CSV |
| Smartest Countries Index 2026smartest-countries-2026-iqmetrics.csv | Smartest countries | 91 rows × 20 columns | CC BY 4.0 | Oct 2026 | Download CSV |
| Mensa by the numbers 2026 (national membership)mensa-statistics-2026-iqmetrics.csv | Mensa statistics | 28 rows × 14 columns | CC BY 4.0 | Oct 2026 | Download CSV |
| AI and Your Brain study tracker 2026 (one row per study)ai-and-your-brain-studies-2026-iqmetrics.csv | AI and your brain | 56 rows × 22 columns | CC BY 4.0 | Oct 2026 | Download CSV |
| Smartest States Index 2026smartest-states-2026-iqmetrics.csv | Smartest States 2026 | 50 rows × 36 columns | CC BY 4.0 | Oct 2026 | Download CSV |
| Peak Brain Age 2026 (aggregate results)peak-brain-age-2026-iqmetrics.csv | Peak brain age | 19 rows × 12 columns | CC BY 4.0 | Oct 2026 | Download CSV |
Six rules every study follows
The same standards apply to a fifty-state index and to a two-page explainer. The full method, with the licences of every source we use and refuse, is published as its own report.
Named primary sources
Every figure traces to a named publisher: a national statistics agency, an international survey such as NAEP, PISA or PIAAC, or our own aggregated test results. Each one is linked.
The method is published
Each study explains, step by step, how the numbers were combined, with the weights and formulas, so anyone can rebuild the result from the same sources.
Uncertainty is shown
Where a source reports standard errors or margins of error, we carry them through. Close rankings are shown as likely-rank ranges, not single places.
Open data, open licence
Every study's table can be downloaded as a CSV under CC BY 4.0. Reuse it in your own work with a credit and a link to the study.
Privacy by design
Reports built on our own test results use totals only. Groups with fewer than 100 people are not published, and no personal data leaves our servers.
Dated corrections
Mistakes are fixed on the study page with a dated note in its version history. Studies are refreshed when their sources release new data.
Sources we use and refuse, the eight build steps, privacy rules and corrections.
What we are working on next
Studies in preparation. Each one follows the same rules, and each one ships with its data.
IQ test scores by country, 2026
Average scores on the IQ Metrics test by country, from first attempts only, for countries with at least 100 test takers.
- Planned
- Data
- Analysis
- Review
For writers, researchers and journalists
Cite IQ Metrics Research
Each study has its own citation in four styles at the foot of the page. To cite the research section as a whole:
IQ Metrics Research. (2026). IQ Metrics Research: Data studies and open data. IQ Metrics. https://iqmetrics.org/research/
IQ Metrics Research. "IQ Metrics Research: Data Studies and Open Data." IQ Metrics, 2026, iqmetrics.org/research/
IQ Metrics Research. "IQ Metrics Research: Data Studies and Open Data." IQ Metrics. Accessed 5 November 2026. https://iqmetrics.org/research/.
@misc{iqmetricsresearch, author = {{IQ Metrics Research}}, title = {IQ Metrics Research: Data Studies and Open Data}, year = {2026}, url = {https://iqmetrics.org/research/} }
Working on a story?
Everything on these pages is built to be reused with a credit and a link.
- The full data behind every chart, as a CSV
- Every chart as a print-ready PNG, and a share card with the credit built in
- Ready quotes under each study, attributable to the named analyst
- Corrections made in public, with a date
- Credit line
- "IQ Metrics Research" with a link to the study you used. On air or in print, "IQ Metrics" and the page address are enough.
- Embargoes
- None. A study is live and citable the day it is published, and stays at the same address when it is refreshed.
- Comment
- Ready quotes sit in every study's press kit. For a quote on a specific figure, or the breakdown behind any number, write to the desk.
- Reply time
- Usually within one working day. A reported error is checked the same day.
Who builds and checks the studies

Leon Falkner
Data & Research AnalystLeon owns the arithmetic on IQ Metrics: the percentile tables, the score converter and the figures in everyone else's drafts. On the research desk Leon pulls the data, builds each index and writes the method.
Profile and other work
Aarav Vardhan
Editor-in-ChiefAarav is the standing reviewer on every page that reports a score, a percentile or a research finding, and signs off each study before it is published. Aarav is also the named contact for corrections.
Profile and other workWhat changed, and when
- Version 2026.11
Which IQ test do scientists use?: First release. Next update due May 2027, or sooner when a new edition of a major test is released (WISC-V successor, WJ V uptake) or an index changes its coverage.
- Version 2026.11.1
Which IQ test do scientists use?: Corrected the UNIT2 edition year to 2016 and its publisher to PRO-ED (the first release said 2015 / Riverside; Buros record and PRO-ED catalogue). The dataset file now carries the date in its name. No count changed. Europe PMC counts and a precision check for every test will follow when the services are back.
- Version 2026.11
How much of the brain is mapped?: First release. Next update due May 2027, or sooner when a mouse or human block larger than MICrONS or H01 is published, the zebrafish whole-brain or the fly brain-and-cord preprints are peer reviewed, or the Wellcome Trust updates its mouse connectome estimates.
- Version 2026.11
How fast do humans think?: First release. Next update due May 2027, or sooner when the two 2025 preprints are published in journals, a memory or cube world record changes, or a brain chip passes 10 bits per second.
- Version 2026.11
Heat and your brain: First release. Next update due February 2027, after the 2026 exam seasons are complete in NASA POWER and new exam timetables are out; sooner if a study in the ledger is corrected or retracted.
- Version 2026.11
Organoid intelligence: First release. Next update due May 2027, or sooner when a second laboratory repeats a result or Cortical Labs or FinalSpark print a price or neuron count: 13 of the 23 experiments are from the last 22 months.
- Version 2026.11
Are human brains shrinking?: First release. Next update: when a paper re-tests the 3,000-year claim, or on 1 November 2027 with new data files.
- Version 2026.11
The brain in space: First release.
About IQ Metrics Research
What is IQ Metrics Research?
The research section of iqmetrics.org. It publishes data studies and indexes built from public sources, reports from our own aggregated test results, plain-English explainers of published research, and technical reports on how our test works.
Can I use your data and charts?
Yes. Studies and datasets are published under the Creative Commons Attribution 4.0 licence (CC BY 4.0). Credit IQ Metrics Research and link to the study page you used.
Is your research peer reviewed?
No. Each study is checked by our editor before it is published, and its method, sources and data are published so anyone can check the work. If you find an error, tell us through the contact page and we will correct it with a dated note.
Why don't you publish an IQ by country ranking?
School and adult skills surveys such as PISA and PIAAC measure skills, not IQ, and converting them into IQ points adds assumptions the data cannot support. We publish skills indexes and call them that.
How often are studies updated?
When the underlying source releases new data. Reports built on our own test results are refreshed every January at the same address, so links to them keep working.
Curious where your own score falls?
Take the IQ Metrics test and see how your own result compares.
Cite
Falkner, L. (2026). Which IQ test do scientists use? The Wechsler scales, in 16,721 papers (Version 2026.11.1) [Data set]. IQ Metrics Research. https://iqmetrics.org/research/most-used-iq-tests/ (DOI: 10.5281/zenodo.23973059)
Falkner, Leon. "Which IQ test do scientists use? The Wechsler scales, in 16,721 papers." IQ Metrics Research, 5 Nov. 2026, iqmetrics.org/research/most-used-iq-tests/. DOI: 10.5281/zenodo.23973059.
Falkner, Leon. "Which IQ test do scientists use? The Wechsler scales, in 16,721 papers." IQ Metrics Research. November 5, 2026. https://iqmetrics.org/research/most-used-iq-tests/. DOI: 10.5281/zenodo.23973059.
@misc{iqmetrics2026mostusediqtests, author = {Falkner, Leon}, title = {Which IQ test do scientists use? The Wechsler scales, in 16,721 papers}, institution = {IQ Metrics}, year = {2026}, version = {2026.11.1}, doi = {10.5281/zenodo.23973059}, url = {https://iqmetrics.org/research/most-used-iq-tests/} }
Source: Leon Falkner, "Which IQ test do scientists use? The Wechsler scales, in 16,721 papers." IQ Metrics Research, version 2026.11.1, https://iqmetrics.org/research/most-used-iq-tests/ (DOI 10.5281/zenodo.23973059)
Falkner, L. (2026). How much of the brain have we mapped? 21 connectomes, 1986 to 2026 (Version 2026.11) [Data set]. IQ Metrics Research. https://iqmetrics.org/research/how-much-of-the-brain-have-we-mapped/ (DOI: 10.5281/zenodo.23973005)
Falkner, Leon. "How much of the brain have we mapped? 21 connectomes, 1986 to 2026." IQ Metrics Research, 5 Nov. 2026, iqmetrics.org/research/how-much-of-the-brain-have-we-mapped/. DOI: 10.5281/zenodo.23973005.
Falkner, Leon. "How much of the brain have we mapped? 21 connectomes, 1986 to 2026." IQ Metrics Research. November 5, 2026. https://iqmetrics.org/research/how-much-of-the-brain-have-we-mapped/. DOI: 10.5281/zenodo.23973005.
@misc{iqmetrics2026howmuchofthebrainhavewemapped, author = {Falkner, Leon}, title = {How much of the brain have we mapped? 21 connectomes, 1986 to 2026}, institution = {IQ Metrics}, year = {2026}, version = {2026.11}, doi = {10.5281/zenodo.23973005}, url = {https://iqmetrics.org/research/how-much-of-the-brain-have-we-mapped/} }
Source: Leon Falkner, "How much of the brain have we mapped? 21 connectomes, 1986 to 2026." IQ Metrics Research, version 2026.11, https://iqmetrics.org/research/how-much-of-the-brain-have-we-mapped/ (DOI 10.5281/zenodo.23973005)
Falkner, L. (2026). How fast do humans think? 47 activities measured in bits per second (Version 2026.11) [Data set]. IQ Metrics Research. https://iqmetrics.org/research/how-fast-do-humans-think/ (DOI: 10.5281/zenodo.23939704)
Falkner, Leon. "How fast do humans think? 47 activities measured in bits per second." IQ Metrics Research, 4 Nov. 2026, iqmetrics.org/research/how-fast-do-humans-think/. DOI: 10.5281/zenodo.23939704.
Falkner, Leon. "How fast do humans think? 47 activities measured in bits per second." IQ Metrics Research. November 4, 2026. https://iqmetrics.org/research/how-fast-do-humans-think/. DOI: 10.5281/zenodo.23939704.
@misc{iqmetrics2026howfastdohumansthink, author = {Falkner, Leon}, title = {How fast do humans think? 47 activities measured in bits per second}, institution = {IQ Metrics}, year = {2026}, version = {2026.11}, doi = {10.5281/zenodo.23939704}, url = {https://iqmetrics.org/research/how-fast-do-humans-think/} }
Source: Leon Falkner, "How fast do humans think? 47 activities measured in bits per second." IQ Metrics Research, version 2026.11, https://iqmetrics.org/research/how-fast-do-humans-think/ (DOI 10.5281/zenodo.23939704)
Falkner, L. (2026). Does heat affect your brain? 36 studies and 41 exam windows, measured (Version 2026.11) [Data set]. IQ Metrics Research. https://iqmetrics.org/research/does-heat-affect-your-brain/ (DOI: 10.5281/zenodo.23939702)
Falkner, Leon. "Does heat affect your brain? 36 studies and 41 exam windows, measured." IQ Metrics Research, 4 Nov. 2026, iqmetrics.org/research/does-heat-affect-your-brain/. DOI: 10.5281/zenodo.23939702.
Falkner, Leon. "Does heat affect your brain? 36 studies and 41 exam windows, measured." IQ Metrics Research. November 4, 2026. https://iqmetrics.org/research/does-heat-affect-your-brain/. DOI: 10.5281/zenodo.23939702.
@misc{iqmetrics2026doesheataffectyourbrain, author = {Falkner, Leon}, title = {Does heat affect your brain? 36 studies and 41 exam windows, measured}, institution = {IQ Metrics}, year = {2026}, version = {2026.11}, doi = {10.5281/zenodo.23939702}, url = {https://iqmetrics.org/research/does-heat-affect-your-brain/} }
Source: Leon Falkner, "Does heat affect your brain? 36 studies and 41 exam windows, measured." IQ Metrics Research, version 2026.11, https://iqmetrics.org/research/does-heat-affect-your-brain/ (DOI 10.5281/zenodo.23939702)
Falkner, L. (2026). Can a dish of brain cells be intelligent? Organoid intelligence, every experiment counted (Version 2026.11) [Data set]. IQ Metrics Research. https://iqmetrics.org/research/organoid-intelligence/ (DOI: 10.5281/zenodo.23909340)
Falkner, Leon. "Can a dish of brain cells be intelligent? Organoid intelligence, every experiment counted." IQ Metrics Research, 3 Nov. 2026, iqmetrics.org/research/organoid-intelligence/. DOI: 10.5281/zenodo.23909340.
Falkner, Leon. "Can a dish of brain cells be intelligent? Organoid intelligence, every experiment counted." IQ Metrics Research. November 3, 2026. https://iqmetrics.org/research/organoid-intelligence/. DOI: 10.5281/zenodo.23909340.
@misc{iqmetrics2026organoidintelligence, author = {Falkner, Leon}, title = {Can a dish of brain cells be intelligent? Organoid intelligence, every experiment counted}, institution = {IQ Metrics}, year = {2026}, version = {2026.11}, doi = {10.5281/zenodo.23909340}, url = {https://iqmetrics.org/research/organoid-intelligence/} }
Source: Leon Falkner, "Can a dish of brain cells be intelligent? Organoid intelligence, every experiment counted." IQ Metrics Research, version 2026.11, https://iqmetrics.org/research/organoid-intelligence/ (DOI 10.5281/zenodo.23909340)
Falkner, L. (2026). Are human brains shrinking? Every measured skull, 7 million years (Version 2026.11) [Data set]. IQ Metrics Research. https://iqmetrics.org/research/are-human-brains-shrinking/ (DOI: 10.5281/zenodo.23909338)
Falkner, Leon. "Are human brains shrinking? Every measured skull, 7 million years." IQ Metrics Research, 3 Nov. 2026, iqmetrics.org/research/are-human-brains-shrinking/. DOI: 10.5281/zenodo.23909338.
Falkner, Leon. "Are human brains shrinking? Every measured skull, 7 million years." IQ Metrics Research. November 3, 2026. https://iqmetrics.org/research/are-human-brains-shrinking/. DOI: 10.5281/zenodo.23909338.
@misc{iqmetrics2026arehumanbrainsshrinking, author = {Falkner, Leon}, title = {Are human brains shrinking? Every measured skull, 7 million years}, institution = {IQ Metrics}, year = {2026}, version = {2026.11}, doi = {10.5281/zenodo.23909338}, url = {https://iqmetrics.org/research/are-human-brains-shrinking/} }
Source: Leon Falkner, "Are human brains shrinking? Every measured skull, 7 million years." IQ Metrics Research, version 2026.11, https://iqmetrics.org/research/are-human-brains-shrinking/ (DOI 10.5281/zenodo.23909338)
Falkner, L. (2026). What happens to the brain in space? Every astronaut brain study (Version 2026.11) [Data set]. IQ Metrics Research. https://iqmetrics.org/research/what-happens-to-the-brain-in-space/ (DOI: 10.5281/zenodo.23909534)
Falkner, Leon. "What happens to the brain in space? Every astronaut brain study." IQ Metrics Research, 2 Nov. 2026, iqmetrics.org/research/what-happens-to-the-brain-in-space/. DOI: 10.5281/zenodo.23909534.
Falkner, Leon. "What happens to the brain in space? Every astronaut brain study." IQ Metrics Research. November 2, 2026. https://iqmetrics.org/research/what-happens-to-the-brain-in-space/. DOI: 10.5281/zenodo.23909534.
@misc{iqmetrics2026whathappenstothebraininspace, author = {Falkner, Leon}, title = {What happens to the brain in space? Every astronaut brain study}, institution = {IQ Metrics}, year = {2026}, version = {2026.11}, doi = {10.5281/zenodo.23909534}, url = {https://iqmetrics.org/research/what-happens-to-the-brain-in-space/} }
Source: Leon Falkner, "What happens to the brain in space? Every astronaut brain study." IQ Metrics Research, version 2026.11, https://iqmetrics.org/research/what-happens-to-the-brain-in-space/ (DOI 10.5281/zenodo.23909534)
Falkner, L. (2026). How smart were dinosaurs? Every dinosaur brain measured (Version 2026.11) [Data set]. IQ Metrics Research. https://iqmetrics.org/research/how-smart-were-dinosaurs/ (DOI: 10.5281/zenodo.23909530)
Falkner, Leon. "How smart were dinosaurs? Every dinosaur brain measured." IQ Metrics Research, 2 Nov. 2026, iqmetrics.org/research/how-smart-were-dinosaurs/. DOI: 10.5281/zenodo.23909530.
Falkner, Leon. "How smart were dinosaurs? Every dinosaur brain measured." IQ Metrics Research. November 2, 2026. https://iqmetrics.org/research/how-smart-were-dinosaurs/. DOI: 10.5281/zenodo.23909530.
@misc{iqmetrics2026howsmartweredinosaurs, author = {Falkner, Leon}, title = {How smart were dinosaurs? Every dinosaur brain measured}, institution = {IQ Metrics}, year = {2026}, version = {2026.11}, doi = {10.5281/zenodo.23909530}, url = {https://iqmetrics.org/research/how-smart-were-dinosaurs/} }
Source: Leon Falkner, "How smart were dinosaurs? Every dinosaur brain measured." IQ Metrics Research, version 2026.11, https://iqmetrics.org/research/how-smart-were-dinosaurs/ (DOI 10.5281/zenodo.23909530)
Falkner, L. (2026). How far can human memory go? Memory world records, 1993-2026 (Version 2026.10) [Data set]. IQ Metrics Research. https://iqmetrics.org/research/memory-world-records/ (DOI: 10.5281/zenodo.23909526)
Falkner, Leon. "How far can human memory go? Memory world records, 1993-2026." IQ Metrics Research, 30 Oct. 2026, iqmetrics.org/research/memory-world-records/. DOI: 10.5281/zenodo.23909526.
Falkner, Leon. "How far can human memory go? Memory world records, 1993-2026." IQ Metrics Research. October 30, 2026. https://iqmetrics.org/research/memory-world-records/. DOI: 10.5281/zenodo.23909526.
@misc{iqmetrics2026memoryworldrecords, author = {Falkner, Leon}, title = {How far can human memory go? Memory world records, 1993-2026}, institution = {IQ Metrics}, year = {2026}, version = {2026.10}, doi = {10.5281/zenodo.23909526}, url = {https://iqmetrics.org/research/memory-world-records/} }
Source: Leon Falkner, "How far can human memory go? Memory world records, 1993-2026." IQ Metrics Research, version 2026.10, https://iqmetrics.org/research/memory-world-records/ (DOI 10.5281/zenodo.23909526)
Falkner, L. (2026). Higher IQ than Einstein? Every "162" Mensa child in the news, counted (Version 2026.10) [Data set]. IQ Metrics Research. https://iqmetrics.org/research/higher-iq-than-einstein/ (DOI: 10.5281/zenodo.23909518)
Falkner, Leon. "Higher IQ than Einstein? Every "162" Mensa child in the news, counted." IQ Metrics Research, 30 Oct. 2026, iqmetrics.org/research/higher-iq-than-einstein/. DOI: 10.5281/zenodo.23909518.
Falkner, Leon. "Higher IQ than Einstein? Every "162" Mensa child in the news, counted." IQ Metrics Research. October 30, 2026. https://iqmetrics.org/research/higher-iq-than-einstein/. DOI: 10.5281/zenodo.23909518.
@misc{iqmetrics2026higheriqthaneinstein, author = {Falkner, Leon}, title = {Higher IQ than Einstein? Every "162" Mensa child in the news, counted}, institution = {IQ Metrics}, year = {2026}, version = {2026.10}, doi = {10.5281/zenodo.23909518}, url = {https://iqmetrics.org/research/higher-iq-than-einstein/} }
Source: Leon Falkner, "Higher IQ than Einstein? Every "162" Mensa child in the news, counted." IQ Metrics Research, version 2026.10, https://iqmetrics.org/research/higher-iq-than-einstein/ (DOI 10.5281/zenodo.23909518)
Falkner, L. (2026). How many people have a brain chip? Every implant counted, 1998-2026 (Version 2026.10) [Data set]. IQ Metrics Research. https://iqmetrics.org/research/brain-implant-count/ (DOI: 10.5281/zenodo.23760884)
Falkner, Leon. "How many people have a brain chip? Every implant counted, 1998-2026." IQ Metrics Research, 29 Oct. 2026, iqmetrics.org/research/brain-implant-count/. DOI: 10.5281/zenodo.23760884.
Falkner, Leon. "How many people have a brain chip? Every implant counted, 1998-2026." IQ Metrics Research. October 29, 2026. https://iqmetrics.org/research/brain-implant-count/. DOI: 10.5281/zenodo.23760884.
@misc{iqmetrics2026brainimplantcount, author = {Falkner, Leon}, title = {How many people have a brain chip? Every implant counted, 1998-2026}, institution = {IQ Metrics}, year = {2026}, version = {2026.10}, doi = {10.5281/zenodo.23760884}, url = {https://iqmetrics.org/research/brain-implant-count/} }
Source: Leon Falkner, "How many people have a brain chip? Every implant counted, 1998-2026." IQ Metrics Research, version 2026.10, https://iqmetrics.org/research/brain-implant-count/ (DOI 10.5281/zenodo.23760884)
Falkner, L. (2026). AI vs the world's best teen mathematicians (Version 2026.10) [Data set]. IQ Metrics Research. https://iqmetrics.org/research/ai-vs-math-olympiad/ (DOI: 10.5281/zenodo.23760888)
Falkner, Leon. "AI vs the world's best teen mathematicians." IQ Metrics Research, 29 Oct. 2026, iqmetrics.org/research/ai-vs-math-olympiad/. DOI: 10.5281/zenodo.23760888.
Falkner, Leon. "AI vs the world's best teen mathematicians." IQ Metrics Research. October 29, 2026. https://iqmetrics.org/research/ai-vs-math-olympiad/. DOI: 10.5281/zenodo.23760888.
@misc{iqmetrics2026aivsmatholympiad, author = {Falkner, Leon}, title = {AI vs the world's best teen mathematicians}, institution = {IQ Metrics}, year = {2026}, version = {2026.10}, doi = {10.5281/zenodo.23760888}, url = {https://iqmetrics.org/research/ai-vs-math-olympiad/} }
Source: Leon Falkner, "AI vs the world's best teen mathematicians." IQ Metrics Research, version 2026.10, https://iqmetrics.org/research/ai-vs-math-olympiad/ (DOI 10.5281/zenodo.23760888)
Falkner, L. (2026). Where were history's great minds born? (Version 2026.10) [Data set]. IQ Metrics Research. https://iqmetrics.org/research/where-geniuses-are-born/ (DOI: 10.5281/zenodo.23723875)
Falkner, Leon. "Where were history's great minds born?" IQ Metrics Research, 28 Oct. 2026, iqmetrics.org/research/where-geniuses-are-born/. DOI: 10.5281/zenodo.23723875.
Falkner, Leon. "Where were history's great minds born?" IQ Metrics Research. October 28, 2026. https://iqmetrics.org/research/where-geniuses-are-born/. DOI: 10.5281/zenodo.23723875.
@misc{iqmetrics2026wheregeniusesareborn, author = {Falkner, Leon}, title = {Where were history's great minds born?}, institution = {IQ Metrics}, year = {2026}, version = {2026.10}, doi = {10.5281/zenodo.23723875}, url = {https://iqmetrics.org/research/where-geniuses-are-born/} }
Source: Leon Falkner, "Where were history's great minds born?" IQ Metrics Research, version 2026.10, https://iqmetrics.org/research/where-geniuses-are-born/ (DOI 10.5281/zenodo.23723875)
Falkner, L. (2026). How old were history's great minds at their breakthrough? (Version 2026.10) [Data set]. IQ Metrics Research. https://iqmetrics.org/research/age-at-breakthrough/ (DOI: 10.5281/zenodo.23723883)
Falkner, Leon. "How old were history's great minds at their breakthrough?" IQ Metrics Research, 28 Oct. 2026, iqmetrics.org/research/age-at-breakthrough/. DOI: 10.5281/zenodo.23723883.
Falkner, Leon. "How old were history's great minds at their breakthrough?" IQ Metrics Research. October 28, 2026. https://iqmetrics.org/research/age-at-breakthrough/. DOI: 10.5281/zenodo.23723883.
@misc{iqmetrics2026ageatbreakthrough, author = {Falkner, Leon}, title = {How old were history's great minds at their breakthrough?}, institution = {IQ Metrics}, year = {2026}, version = {2026.10}, doi = {10.5281/zenodo.23723883}, url = {https://iqmetrics.org/research/age-at-breakthrough/} }
Source: Leon Falkner, "How old were history's great minds at their breakthrough?" IQ Metrics Research, version 2026.10, https://iqmetrics.org/research/age-at-breakthrough/ (DOI 10.5281/zenodo.23723883)
Falkner, L. (2026). Famous brains weighed: did history's great minds have bigger brains? (Version 2026.10) [Data set]. IQ Metrics Research. https://iqmetrics.org/research/famous-brains-weighed/ (DOI: 10.5281/zenodo.23688443)
Falkner, Leon. "Famous brains weighed: did history's great minds have bigger brains?" IQ Metrics Research, 27 Oct. 2026, iqmetrics.org/research/famous-brains-weighed/. DOI: 10.5281/zenodo.23688443.
Falkner, Leon. "Famous brains weighed: did history's great minds have bigger brains?" IQ Metrics Research. October 27, 2026. https://iqmetrics.org/research/famous-brains-weighed/. DOI: 10.5281/zenodo.23688443.
@misc{iqmetrics2026famousbrainsweighed, author = {Falkner, Leon}, title = {Famous brains weighed: did history's great minds have bigger brains?}, institution = {IQ Metrics}, year = {2026}, version = {2026.10}, doi = {10.5281/zenodo.23688443}, url = {https://iqmetrics.org/research/famous-brains-weighed/} }
Source: Leon Falkner, "Famous brains weighed: did history's great minds have bigger brains?" IQ Metrics Research, version 2026.10, https://iqmetrics.org/research/famous-brains-weighed/ (DOI 10.5281/zenodo.23688443)
Falkner, L. (2026). Which famous brain and intelligence findings held up? (Version 2026.10) [Data set]. IQ Metrics Research. https://iqmetrics.org/research/replication-scorecard/ (DOI: 10.5281/zenodo.23688461)
Falkner, Leon. "Which famous brain and intelligence findings held up?" IQ Metrics Research, 27 Oct. 2026, iqmetrics.org/research/replication-scorecard/. DOI: 10.5281/zenodo.23688461.
Falkner, Leon. "Which famous brain and intelligence findings held up?" IQ Metrics Research. October 27, 2026. https://iqmetrics.org/research/replication-scorecard/. DOI: 10.5281/zenodo.23688461.
@misc{iqmetrics2026replicationscorecard, author = {Falkner, Leon}, title = {Which famous brain and intelligence findings held up?}, institution = {IQ Metrics}, year = {2026}, version = {2026.10}, doi = {10.5281/zenodo.23688461}, url = {https://iqmetrics.org/research/replication-scorecard/} }
Source: Leon Falkner, "Which famous brain and intelligence findings held up?" IQ Metrics Research, version 2026.10, https://iqmetrics.org/research/replication-scorecard/ (DOI 10.5281/zenodo.23688461)
Falkner, L. (2026). The world's shortest IQ test: how many people really pass it? (Version 2026.10) [Data set]. IQ Metrics Research. https://iqmetrics.org/research/worlds-shortest-iq-test/ (DOI: 10.5281/zenodo.23664398)
Falkner, Leon. "The world's shortest IQ test: how many people really pass it?" IQ Metrics Research, 26 Oct. 2026, iqmetrics.org/research/worlds-shortest-iq-test/. DOI: 10.5281/zenodo.23664398.
Falkner, Leon. "The world's shortest IQ test: how many people really pass it?" IQ Metrics Research. October 26, 2026. https://iqmetrics.org/research/worlds-shortest-iq-test/. DOI: 10.5281/zenodo.23664398.
@misc{iqmetrics2026worldsshortestiqtest, author = {Falkner, Leon}, title = {The world's shortest IQ test: how many people really pass it?}, institution = {IQ Metrics}, year = {2026}, version = {2026.10}, doi = {10.5281/zenodo.23664398}, url = {https://iqmetrics.org/research/worlds-shortest-iq-test/} }
Source: Leon Falkner, "The world's shortest IQ test: how many people really pass it?" IQ Metrics Research, version 2026.10, https://iqmetrics.org/research/worlds-shortest-iq-test/ (DOI 10.5281/zenodo.23664398)
Falkner, L. (2026). The IQs of 301 geniuses: Cox's 1926 estimates, in full (Version 2026.10) [Data set]. IQ Metrics Research. https://iqmetrics.org/research/iq-of-historical-geniuses/ (DOI: 10.5281/zenodo.23664396)
Falkner, Leon. "The IQs of 301 geniuses: Cox's 1926 estimates, in full." IQ Metrics Research, 26 Oct. 2026, iqmetrics.org/research/iq-of-historical-geniuses/. DOI: 10.5281/zenodo.23664396.
Falkner, Leon. "The IQs of 301 geniuses: Cox's 1926 estimates, in full." IQ Metrics Research. October 26, 2026. https://iqmetrics.org/research/iq-of-historical-geniuses/. DOI: 10.5281/zenodo.23664396.
@misc{iqmetrics2026iqofhistoricalgeniuses, author = {Falkner, Leon}, title = {The IQs of 301 geniuses: Cox's 1926 estimates, in full}, institution = {IQ Metrics}, year = {2026}, version = {2026.10}, doi = {10.5281/zenodo.23664396}, url = {https://iqmetrics.org/research/iq-of-historical-geniuses/} }
Source: Leon Falkner, "The IQs of 301 geniuses: Cox's 1926 estimates, in full." IQ Metrics Research, version 2026.10, https://iqmetrics.org/research/iq-of-historical-geniuses/ (DOI 10.5281/zenodo.23664396)
Falkner, L. (2026). Which universities produce the most prize-winning scientists? (Version 2026.10) [Data set]. IQ Metrics Research. https://iqmetrics.org/research/universities-with-the-most-prize-winners/ (DOI: 10.5281/zenodo.23589566)
Falkner, Leon. "Which universities produce the most prize-winning scientists?" IQ Metrics Research, 23 Oct. 2026, iqmetrics.org/research/universities-with-the-most-prize-winners/. DOI: 10.5281/zenodo.23589566.
Falkner, Leon. "Which universities produce the most prize-winning scientists?" IQ Metrics Research. October 23, 2026. https://iqmetrics.org/research/universities-with-the-most-prize-winners/. DOI: 10.5281/zenodo.23589566.
@misc{iqmetrics2026universitieswiththemostprizewinners, author = {Falkner, Leon}, title = {Which universities produce the most prize-winning scientists?}, institution = {IQ Metrics}, year = {2026}, version = {2026.10}, doi = {10.5281/zenodo.23589566}, url = {https://iqmetrics.org/research/universities-with-the-most-prize-winners/} }
Source: Leon Falkner, "Which universities produce the most prize-winning scientists?" IQ Metrics Research, version 2026.10, https://iqmetrics.org/research/universities-with-the-most-prize-winners/ (DOI 10.5281/zenodo.23589566)
Falkner, L. (2026). Which big employers use aptitude tests? (Version 2026.10) [Data set]. IQ Metrics Research. https://iqmetrics.org/research/which-employers-use-aptitude-tests/ (DOI: 10.5281/zenodo.23589583)
Falkner, Leon. "Which big employers use aptitude tests?" IQ Metrics Research, 23 Oct. 2026, iqmetrics.org/research/which-employers-use-aptitude-tests/. DOI: 10.5281/zenodo.23589583.
Falkner, Leon. "Which big employers use aptitude tests?" IQ Metrics Research. October 23, 2026. https://iqmetrics.org/research/which-employers-use-aptitude-tests/. DOI: 10.5281/zenodo.23589583.
@misc{iqmetrics2026whichemployersuseaptitudetests, author = {Falkner, Leon}, title = {Which big employers use aptitude tests?}, institution = {IQ Metrics}, year = {2026}, version = {2026.10}, doi = {10.5281/zenodo.23589583}, url = {https://iqmetrics.org/research/which-employers-use-aptitude-tests/} }
Source: Leon Falkner, "Which big employers use aptitude tests?" IQ Metrics Research, version 2026.10, https://iqmetrics.org/research/which-employers-use-aptitude-tests/ (DOI 10.5281/zenodo.23589583)
Falkner, L. (2026). Smartest animals: neurons vs test scores in 222 species (Version 2026.10) [Data set]. IQ Metrics Research. https://iqmetrics.org/research/smartest-animals/ (DOI: 10.5281/zenodo.23589593)
Falkner, Leon. "Smartest animals: neurons vs test scores in 222 species." IQ Metrics Research, 23 Oct. 2026, iqmetrics.org/research/smartest-animals/. DOI: 10.5281/zenodo.23589593.
Falkner, Leon. "Smartest animals: neurons vs test scores in 222 species." IQ Metrics Research. October 23, 2026. https://iqmetrics.org/research/smartest-animals/. DOI: 10.5281/zenodo.23589593.
@misc{iqmetrics2026smartestanimals, author = {Falkner, Leon}, title = {Smartest animals: neurons vs test scores in 222 species}, institution = {IQ Metrics}, year = {2026}, version = {2026.10}, doi = {10.5281/zenodo.23589593}, url = {https://iqmetrics.org/research/smartest-animals/} }
Source: Leon Falkner, "Smartest animals: neurons vs test scores in 222 species." IQ Metrics Research, version 2026.10, https://iqmetrics.org/research/smartest-animals/ (DOI 10.5281/zenodo.23589593)
Falkner, L. (2026). What teachers believe about the brain: neuromyths by country (Version 2026.10) [Data set]. IQ Metrics Research. https://iqmetrics.org/research/neuromyths-by-country/ (DOI: 10.5281/zenodo.23559576)
Falkner, Leon. "What teachers believe about the brain: neuromyths by country." IQ Metrics Research, 22 Oct. 2026, iqmetrics.org/research/neuromyths-by-country/. DOI: 10.5281/zenodo.23559576.
Falkner, Leon. "What teachers believe about the brain: neuromyths by country." IQ Metrics Research. October 22, 2026. https://iqmetrics.org/research/neuromyths-by-country/. DOI: 10.5281/zenodo.23559576.
@misc{iqmetrics2026neuromythsbycountry, author = {Falkner, Leon}, title = {What teachers believe about the brain: neuromyths by country}, institution = {IQ Metrics}, year = {2026}, version = {2026.10}, doi = {10.5281/zenodo.23559576}, url = {https://iqmetrics.org/research/neuromyths-by-country/} }
Source: Leon Falkner, "What teachers believe about the brain: neuromyths by country." IQ Metrics Research, version 2026.10, https://iqmetrics.org/research/neuromyths-by-country/ (DOI 10.5281/zenodo.23559576)
Falkner, L. (2026). The brain numbers everyone quotes, checked (Version 2026.10) [Data set]. IQ Metrics Research. https://iqmetrics.org/research/brain-statistics-fact-check/ (DOI: 10.5281/zenodo.23559582)
Falkner, Leon. "The brain numbers everyone quotes, checked." IQ Metrics Research, 22 Oct. 2026, iqmetrics.org/research/brain-statistics-fact-check/. DOI: 10.5281/zenodo.23559582.
Falkner, Leon. "The brain numbers everyone quotes, checked." IQ Metrics Research. October 22, 2026. https://iqmetrics.org/research/brain-statistics-fact-check/. DOI: 10.5281/zenodo.23559582.
@misc{iqmetrics2026brainstatisticsfactcheck, author = {Falkner, Leon}, title = {The brain numbers everyone quotes, checked}, institution = {IQ Metrics}, year = {2026}, version = {2026.10}, doi = {10.5281/zenodo.23559582}, url = {https://iqmetrics.org/research/brain-statistics-fact-check/} }
Source: Leon Falkner, "The brain numbers everyone quotes, checked." IQ Metrics Research, version 2026.10, https://iqmetrics.org/research/brain-statistics-fact-check/ (DOI 10.5281/zenodo.23559582)
Falkner, L. (2026). Terman's Termites: what happened to 1,528 gifted children (Version 2026.10) [Data set]. IQ Metrics Research. https://iqmetrics.org/research/terman-study-of-the-gifted/ (DOI: 10.5281/zenodo.23559586)
Falkner, Leon. "Terman's Termites: what happened to 1,528 gifted children." IQ Metrics Research, 22 Oct. 2026, iqmetrics.org/research/terman-study-of-the-gifted/. DOI: 10.5281/zenodo.23559586.
Falkner, Leon. "Terman's Termites: what happened to 1,528 gifted children." IQ Metrics Research. October 22, 2026. https://iqmetrics.org/research/terman-study-of-the-gifted/. DOI: 10.5281/zenodo.23559586.
@misc{iqmetrics2026termanstudyofthegifted, author = {Falkner, Leon}, title = {Terman's Termites: what happened to 1,528 gifted children}, institution = {IQ Metrics}, year = {2026}, version = {2026.10}, doi = {10.5281/zenodo.23559586}, url = {https://iqmetrics.org/research/terman-study-of-the-gifted/} }
Source: Leon Falkner, "Terman's Termites: what happened to 1,528 gifted children." IQ Metrics Research, version 2026.10, https://iqmetrics.org/research/terman-study-of-the-gifted/ (DOI 10.5281/zenodo.23559586)
Falkner, L. (2026). The smartest places in the UK, 2026 (Version 2026.10) [Data set]. IQ Metrics Research. https://iqmetrics.org/research/smartest-places-in-the-uk/ (DOI: 10.5281/zenodo.23559568)
Falkner, Leon. "The smartest places in the UK, 2026." IQ Metrics Research, 19 Oct. 2026, iqmetrics.org/research/smartest-places-in-the-uk/. DOI: 10.5281/zenodo.23559568.
Falkner, Leon. "The smartest places in the UK, 2026." IQ Metrics Research. October 19, 2026. https://iqmetrics.org/research/smartest-places-in-the-uk/. DOI: 10.5281/zenodo.23559568.
@misc{iqmetrics2026smartestplacesintheuk, author = {Falkner, Leon}, title = {The smartest places in the UK, 2026}, institution = {IQ Metrics}, year = {2026}, version = {2026.10}, doi = {10.5281/zenodo.23559568}, url = {https://iqmetrics.org/research/smartest-places-in-the-uk/} }
Source: Leon Falkner, "The smartest places in the UK, 2026." IQ Metrics Research, version 2026.10, https://iqmetrics.org/research/smartest-places-in-the-uk/ (DOI 10.5281/zenodo.23559568)
Falkner, L. (2026). The smartest cities in America, 2026: all 387 metros ranked on intellectual life (Version 2026.10) [Data set]. IQ Metrics Research. https://iqmetrics.org/research/smartest-cities-in-america/ (DOI: 10.5281/zenodo.23559574)
Falkner, Leon. "The smartest cities in America, 2026: all 387 metros ranked on intellectual life." IQ Metrics Research, 19 Oct. 2026, iqmetrics.org/research/smartest-cities-in-america/. DOI: 10.5281/zenodo.23559574.
Falkner, Leon. "The smartest cities in America, 2026: all 387 metros ranked on intellectual life." IQ Metrics Research. October 19, 2026. https://iqmetrics.org/research/smartest-cities-in-america/. DOI: 10.5281/zenodo.23559574.
@misc{iqmetrics2026smartestcitiesinamerica, author = {Falkner, Leon}, title = {The smartest cities in America, 2026: all 387 metros ranked on intellectual life}, institution = {IQ Metrics}, year = {2026}, version = {2026.10}, doi = {10.5281/zenodo.23559574}, url = {https://iqmetrics.org/research/smartest-cities-in-america/} }
Source: Leon Falkner, "The smartest cities in America, 2026: all 387 metros ranked on intellectual life." IQ Metrics Research, version 2026.10, https://iqmetrics.org/research/smartest-cities-in-america/ (DOI 10.5281/zenodo.23559574)
Falkner, L. (2026). Gifted students by US state, 2026 (Version 2026.10) [Data set]. IQ Metrics Research. https://iqmetrics.org/research/gifted-students-by-state-usa/ (DOI: 10.5281/zenodo.23559562)
Falkner, Leon. "Gifted students by US state, 2026." IQ Metrics Research, 19 Oct. 2026, iqmetrics.org/research/gifted-students-by-state-usa/. DOI: 10.5281/zenodo.23559562.
Falkner, Leon. "Gifted students by US state, 2026." IQ Metrics Research. October 19, 2026. https://iqmetrics.org/research/gifted-students-by-state-usa/. DOI: 10.5281/zenodo.23559562.
@misc{iqmetrics2026giftedstudentsbystateusa, author = {Falkner, Leon}, title = {Gifted students by US state, 2026}, institution = {IQ Metrics}, year = {2026}, version = {2026.10}, doi = {10.5281/zenodo.23559562}, url = {https://iqmetrics.org/research/gifted-students-by-state-usa/} }
Source: Leon Falkner, "Gifted students by US state, 2026." IQ Metrics Research, version 2026.10, https://iqmetrics.org/research/gifted-students-by-state-usa/ (DOI 10.5281/zenodo.23559562)
Falkner, L. (2026). The smartest countries in the world, 2026 (Version 2026.10) [Data set]. IQ Metrics Research. https://iqmetrics.org/research/smartest-countries-in-the-world/ (DOI: 10.5281/zenodo.23418294)
Falkner, Leon. "The smartest countries in the world, 2026." IQ Metrics Research, 16 Oct. 2026, iqmetrics.org/research/smartest-countries-in-the-world/. DOI: 10.5281/zenodo.23418294.
Falkner, Leon. "The smartest countries in the world, 2026." IQ Metrics Research. October 16, 2026. https://iqmetrics.org/research/smartest-countries-in-the-world/. DOI: 10.5281/zenodo.23418294.
@misc{iqmetrics2026smartestcountriesintheworld, author = {Falkner, Leon}, title = {The smartest countries in the world, 2026}, institution = {IQ Metrics}, year = {2026}, version = {2026.10}, doi = {10.5281/zenodo.23418294}, url = {https://iqmetrics.org/research/smartest-countries-in-the-world/} }
Source: Leon Falkner, "The smartest countries in the world, 2026." IQ Metrics Research, version 2026.10, https://iqmetrics.org/research/smartest-countries-in-the-world/ (DOI 10.5281/zenodo.23418294)
Falkner, L. (2026). Mensa by the numbers (Version 2026.10) [Data set]. IQ Metrics Research. https://iqmetrics.org/research/mensa-statistics/ (DOI: 10.5281/zenodo.23418288)
Falkner, Leon. "Mensa by the numbers." IQ Metrics Research, 16 Oct. 2026, iqmetrics.org/research/mensa-statistics/. DOI: 10.5281/zenodo.23418288.
Falkner, Leon. "Mensa by the numbers." IQ Metrics Research. October 16, 2026. https://iqmetrics.org/research/mensa-statistics/. DOI: 10.5281/zenodo.23418288.
@misc{iqmetrics2026mensastatistics, author = {Falkner, Leon}, title = {Mensa by the numbers}, institution = {IQ Metrics}, year = {2026}, version = {2026.10}, doi = {10.5281/zenodo.23418288}, url = {https://iqmetrics.org/research/mensa-statistics/} }
Source: Leon Falkner, "Mensa by the numbers." IQ Metrics Research, version 2026.10, https://iqmetrics.org/research/mensa-statistics/ (DOI 10.5281/zenodo.23418288)
Falkner, L. (2026). AI and your brain: every study on AI use and thinking (Version 2026.10). IQ Metrics Research. https://iqmetrics.org/research/ai-and-your-brain/ (DOI: 10.5281/zenodo.23418304)
Falkner, Leon. "AI and your brain: every study on AI use and thinking." IQ Metrics Research, 16 Oct. 2026, iqmetrics.org/research/ai-and-your-brain/. DOI: 10.5281/zenodo.23418304.
Falkner, Leon. "AI and your brain: every study on AI use and thinking." IQ Metrics Research. October 16, 2026. https://iqmetrics.org/research/ai-and-your-brain/. DOI: 10.5281/zenodo.23418304.
@misc{iqmetrics2026aiandyourbrain, author = {Falkner, Leon}, title = {AI and your brain: every study on AI use and thinking}, institution = {IQ Metrics}, year = {2026}, version = {2026.10}, doi = {10.5281/zenodo.23418304}, url = {https://iqmetrics.org/research/ai-and-your-brain/} }
Source: Leon Falkner, "AI and your brain: every study on AI use and thinking." IQ Metrics Research, version 2026.10, https://iqmetrics.org/research/ai-and-your-brain/ (DOI 10.5281/zenodo.23418304)
Falkner, L. (2026). The smartest states in the US, 2026 (Version 2026.10) [Data set]. IQ Metrics Research. https://iqmetrics.org/research/smartest-states-in-america/ (DOI: 10.5281/zenodo.23417337)
Falkner, Leon. "The smartest states in the US, 2026." IQ Metrics Research, 15 Oct. 2026, iqmetrics.org/research/smartest-states-in-america/. DOI: 10.5281/zenodo.23417337.
Falkner, Leon. "The smartest states in the US, 2026." IQ Metrics Research. October 15, 2026. https://iqmetrics.org/research/smartest-states-in-america/. DOI: 10.5281/zenodo.23417337.
@misc{iqmetrics2026smarteststatesinamerica, author = {Falkner, Leon}, title = {The smartest states in the US, 2026}, institution = {IQ Metrics}, year = {2026}, version = {2026.10}, doi = {10.5281/zenodo.23417337}, url = {https://iqmetrics.org/research/smartest-states-in-america/} }
Source: Leon Falkner, "The smartest states in the US, 2026." IQ Metrics Research, version 2026.10, https://iqmetrics.org/research/smartest-states-in-america/ (DOI 10.5281/zenodo.23417337)
Falkner, L. (2026). At what age is your brain sharpest? (Version 2026.10) [Data set]. IQ Metrics Research. https://iqmetrics.org/research/peak-brain-age/ (DOI: 10.5281/zenodo.23418278)
Falkner, Leon. "At what age is your brain sharpest?" IQ Metrics Research, 15 Oct. 2026, iqmetrics.org/research/peak-brain-age/. DOI: 10.5281/zenodo.23418278.
Falkner, Leon. "At what age is your brain sharpest?" IQ Metrics Research. October 15, 2026. https://iqmetrics.org/research/peak-brain-age/. DOI: 10.5281/zenodo.23418278.
@misc{iqmetrics2026peakbrainage, author = {Falkner, Leon}, title = {At what age is your brain sharpest?}, institution = {IQ Metrics}, year = {2026}, version = {2026.10}, doi = {10.5281/zenodo.23418278}, url = {https://iqmetrics.org/research/peak-brain-age/} }
Source: Leon Falkner, "At what age is your brain sharpest?" IQ Metrics Research, version 2026.10, https://iqmetrics.org/research/peak-brain-age/ (DOI 10.5281/zenodo.23418278)
Falkner, L. (2026). How IQ Metrics Research works: methods and standards (Version 2026.10). IQ Metrics Research. https://iqmetrics.org/research/methods/
Falkner, Leon. "How IQ Metrics Research works: methods and standards." IQ Metrics Research, 15 Oct. 2026, iqmetrics.org/research/methods/.
Falkner, Leon. "How IQ Metrics Research works: methods and standards." IQ Metrics Research. October 15, 2026. https://iqmetrics.org/research/methods/.
@techreport{iqmetrics2026methods, author = {Falkner, Leon}, title = {How IQ Metrics Research works: methods and standards}, institution = {IQ Metrics}, year = {2026}, version = {2026.10}, url = {https://iqmetrics.org/research/methods/} }
Source: Leon Falkner, "How IQ Metrics Research works: methods and standards." IQ Metrics Research, version 2026.10, https://iqmetrics.org/research/methods/