



The smartest states
in the US, 2026
We ranked every state on two things that are measured the same way everywhere: how well children read and do math on the federal NAEP tests, and how many adults hold a college degree. SAT and ACT results sit beside the ranking, together with the share of students who took them.
Six things the numbers show
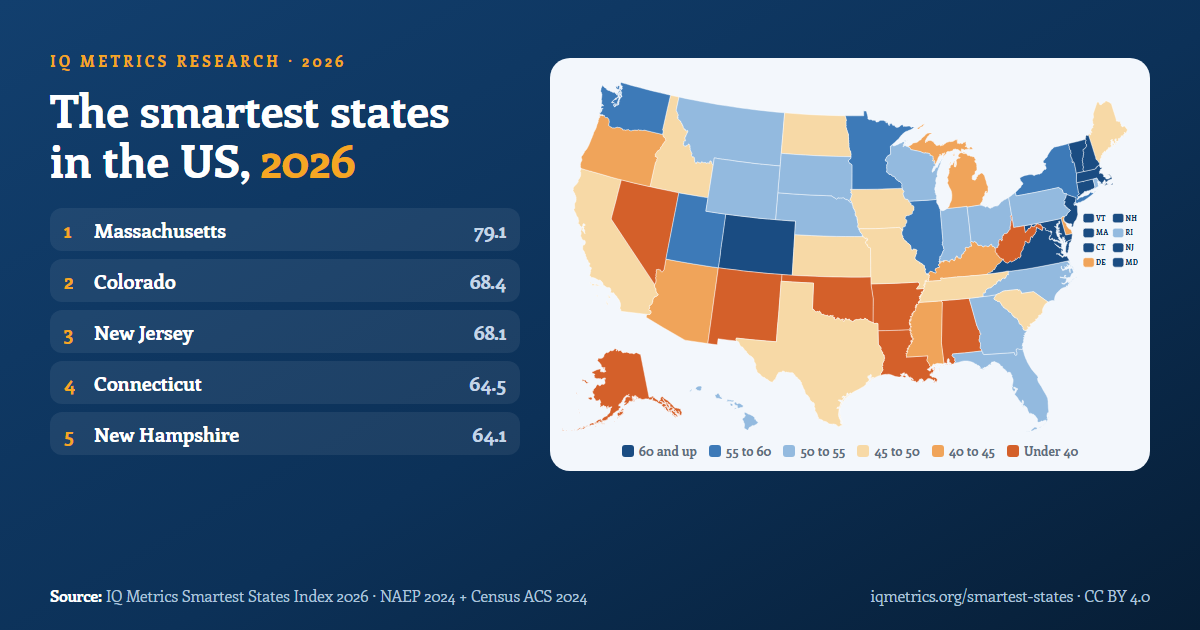
Massachusetts is the smartest state in the US in 2026, according to the IQ Metrics Smartest States Index. It ranks first on both NAEP 2024 school test scores and the share of adults with a college degree. Colorado, New Jersey, Connecticut and New Hampshire complete the top five, and West Virginia ranks 50th.
- Massachusetts is the smartest state in 2026 on our measure, with an index score of 79.1. It ranks first on NAEP school scores and first on adult degrees: 48.3% of its adults hold a bachelor’s degree or higher, against 36.9% nationally.NAEP 2024; US Census Bureau, ACS 2024
- The top five are Massachusetts, Colorado, New Jersey, Connecticut and New Hampshire. West Virginia ranks last, after New Mexico (49th) and Alaska (48th).IQ Metrics index, October 2026
- School scores fell almost everywhere. 49 of the 50 states scored lower on NAEP in 2024 than in 2019, averaged over four tests, and public schools nationwide fell −5.5 points. NAEP’s own significance tests confirm a real drop on at least one test in every state, and on all four tests in 16 states. Only Louisiana’s average rose (+0.9 points).NAEP 2019 and 2024, grades 4 and 8, math and reading; NAEP significance tests
- Only four states beat the national average on every test. Massachusetts, New Hampshire, Utah and Wyoming score significantly above US public schools on all four NAEP tests. Alaska, Delaware, New Mexico, Oklahoma and West Virginia score significantly below on all four.NAEP 2024, significance tests against national public schools
- Kids and adults often tell different stories. Indiana’s students rank 7th but its adults rank 43rd for degrees. Maryland’s adults rank 2nd but its students rank 33rd.NAEP 2024; ACS 2024
- Raw SAT and ACT averages mislead. The share of graduates who took the SAT runs from 1% to 100%. Among states that test nearly every student, Colorado leads on the SAT (994) and Utah on the ACT (20.0).College Board, class of 2026; ACT, class of 2025
- Money explains about half of the gap between states, and school spending almost none of it. Median household income accounts for 49% of the differences in the index, about 5.7 index points for every $10,000. Per-pupil spending explains 2% of the differences in NAEP scores: Utah spends the second-least per pupil ($10,333) and ranks 5th on school skills, while New York spends the most ($30,012) and ranks 32nd.ACS 2024 (B19013); Census Annual Survey of School System Finances, FY2023; NAEP 2024
- The state map has moved since 2006. Against the IQ-style state estimates published in 2006, Hawaii climbed 27 places and Maryland 26, while Iowa fell 26 and Maine 25. Only five of the 2006 top ten are still in the top ten.McDaniel (2006), Intelligence 34(6); IQ Metrics index 2026
21 numbers from this study, ready to cite
Each line is one fact from the IQ Metrics Smartest States Index 2026, with its source. Select the copy button to take the sentence and the credit line together.
- Massachusetts is the smartest state in the US in 2026, with an index score of 79.1; it ranks first on both NAEP 2024 school scores and adult college degrees.NAEP 2024; ACS 2024
- West Virginia ranks 50th with an index score of 27.8: 48th on school scores and 50th on adult degrees.NAEP 2024; ACS 2024
- 49 of the 50 states scored lower on NAEP in 2024 than in 2019, averaged over four tests; only Louisiana rose (+0.9 points).NAEP 2019 and 2024
- Every state fell significantly on at least one NAEP test between 2019 and 2024, and 16 states fell on all four.NAEP significance tests
- Only four states score significantly above US public schools on all four NAEP tests: Massachusetts, New Hampshire, Utah and Wyoming.NAEP 2024 significance tests
- 48.3% of Massachusetts adults hold a bachelor’s degree or higher, against 24.4% of West Virginia adults and 36.9% nationally.ACS 2024, table B15003
- Median household income explains 49% of the differences between states in the index; each $10,000 goes with about 5.7 more index points.ACS 2024, table B19013; IQ Metrics index
- Alaska scores 25.1 index points below what its income predicts, the largest shortfall of any state; Massachusetts scores 15.4 points above its prediction, the largest surplus.ACS 2024; IQ Metrics index
- Per-pupil school spending explains 2% of the differences between states in NAEP results (correlation 0.15 across the 50 states).Census school finances FY2023; NAEP 2024
- Utah spends $10,333 per pupil, 49th of 50, and ranks 5th on school skills; New York spends $30,012, the most, and ranks 32nd.Census school finances FY2023; NAEP 2024
- Spending per pupil rose 31.6% nationally from 2018 to 2023 ($12,559 to $16,526) while NAEP scores fell 5.5 points from 2019 to 2024.Census school finances; NAEP
- New Hampshire and Minnesota have the most skilled adults on the PIAAC literacy and numeracy estimates; Louisiana, Mississippi and New Mexico have the least, with about four adults in ten at or below numeracy level 1.NCES PIAAC Skills Map, 2017 state estimates
- Alaska is 4th on adult skills but 48th in the index; adult skills and the index agree only moderately (correlation 0.53).NCES PIAAC; IQ Metrics index
- Hawaii has climbed 27 places and Maryland 26 since the 2006 “average IQ by state” list; Iowa has fallen 26 places and Maine 25.McDaniel (2006); IQ Metrics index 2026
- Only 5 of the 2006 top ten states are in the 2026 top ten; the rank correlation between the two lists is 0.62.McDaniel (2006); IQ Metrics index 2026
- The average American lives in a state scoring 51.1, and 54% of Americans live in a state at or above the average state.ACS 2024, table B01003; IQ Metrics index
- The Northeast averages 60.9 on the index and the South 45.0; the Midwest averages 50.3 and the West 48.3.IQ Metrics index; Census regions
- Massachusetts ranked first in all 10,000 re-runs of the index, with every NAEP score and degree share redrawn within its margin of error; for the ten states ranked 21st to 30th, the likely rank spans 10 or more places.IQ Metrics index; NAEP 2024 and ACS 2024 standard errors
- Indiana’s students rank 7th but its adults rank 43rd for degrees; Maryland’s adults rank 2nd but its students rank 33rd.NAEP 2024; ACS 2024
- Among states that test nearly every graduate, Colorado has the highest SAT average (994) and Utah the highest ACT average (20.0); raw averages elsewhere mostly reflect who took the test.College Board, class of 2026; ACT, class of 2025
- Nebraska has the highest SAT average of any state (1270), but only 2% of its graduates took the SAT.College Board, class of 2026
All figures are version 2026.10 of the index, published 15 October 2026. Reuse them under CC BY 4.0 with credit to IQ Metrics and a link to this page. The citation formats and the CSV are further down.
The smartest states, on the map
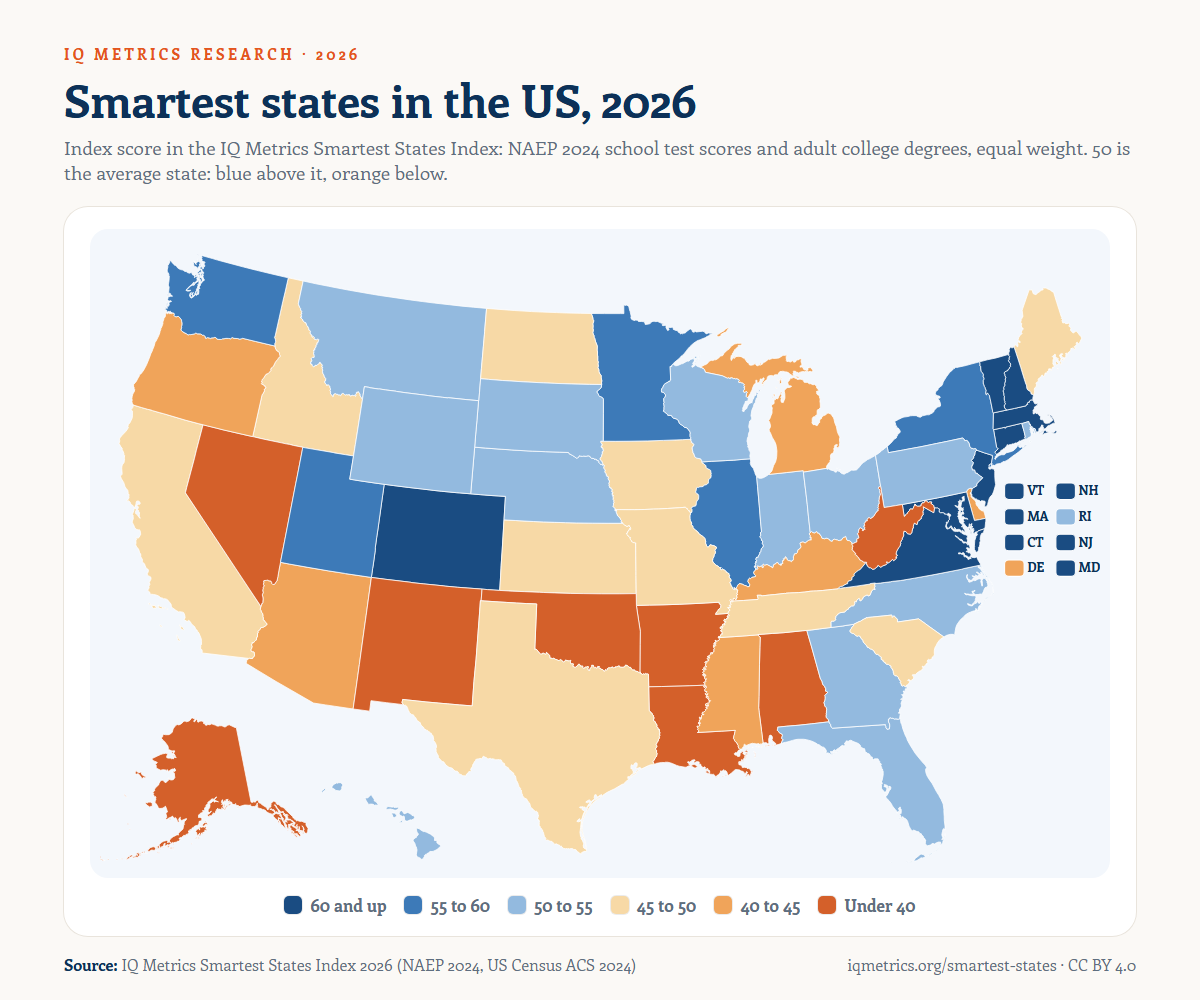
Blue states score above the average state and orange states below it. Hover over or tap a state to see its rank and scores.
IQ Metrics Smartest States Index 2026, all 50 states
NAEP 2024 school test scores and adult college degrees (Census ACS 2024), equal weight
Index score: 50 is the average state. Small northeastern states are repeated as boxes on the right so they can be seen and tapped. Every number is also in the full table.
Your state, in one sentence
Pick a state to see where it stands, with a sentence you can quote and a link straight to its row in the table.
Your state’s rank says nothing about you. See where your own reasoning stands: take the IQ test
Which are the smartest states? All 50, ranked
The index gives equal weight to school skills (NAEP 2024) and adult degrees (Census 2024). An index score of 50 is the average state; each 10 points is one standard deviation between states. Scores less than about one point apart are effectively tied.
| 1 | Massachusetts | 79.1 | 1 | 1 | 1 | 48.3% | −5.8 (3/4) | 1128 (57%) | 26.4 (7%) |
| 2 | Colorado | 68.4 | 2–3 | 6 | 3 | 47.8% | −4.0 (2/4) | 994 (92%) | 24.7 (8%) |
| 3 | New Jersey | 68.1 | 2–3 | 2 | 7 | 44.5% | −6.5 (3/4) | 1069 (68%) | 24.6 (9%) |
| 4 | Connecticut | 64.5 | 4–5 | 8 | 6 | 42.6% | −6.4 (4/4) | 992 (94%) | 27.1 (6%) |
| 5 | New Hampshire | 64.1 | 4–5 | 3 | 9 | 41.5% | −4.3 (3/4) | 1025 (83%) | 25.9 (3%) |
| 6 | Maryland | 61.0 | 6–8 | 33 | 2 | 44.7% | −6.7 (4/4) | 1012 (74%) | 24.9 (6%) |
| 7 | Vermont | 60.2 | 6–9 | 29 | 4 | 45.1% | −8.8 (4/4) | 1107 (50%) | 23.9 (6%) |
| 8 | Virginia | 60.2 | 6–9 | 23 | 5 | 43.3% | −9.0 (4/4) | 1113 (50%) | 25.2 (6%) |
| 9 | Utah | 58.9 | 7–11 | 5 | 17 | 39.1% | −4.4 (3/4) | 1242 (2%) | 20.0 (91%) |
| 10 | Minnesota | 57.6 | 9–12 | 9 | 13 | 40.0% | −7.0 (4/4) | 1231 (4%) | 20.6 (68%) |
| 11 | Washington | 57.3 | 9–13 | 20 | 10 | 41.0% | −6.3 (3/4) | 1103 (37%) | 24.8 (5%) |
| 12 | Illinois | 56.4 | 10–14 | 18 | 12 | 39.2% | −3.4 (1/4) | 1215 (15%) | 23.1 (16%) |
| 13 | New York | 55.9 | 10–15 | 32 | 8 | 41.2% | −5.5 (2/4) | 1053 (63%) | 25.9 (8%) |
| 14 | Rhode Island | 54.4 | 13–17 | 27 | 11 | 39.0% | −4.0 (3/4) | 946 (100%) | 25.4 (4%) |
| 15 | Pennsylvania | 54.0 | 13–18 | 17 | 18 | 36.4% | −6.8 (4/4) | 1092 (46%) | 24.5 (5%) |
| 16 | Wyoming | 53.4 | 14–20 | 4 | 38 | 32.3% | −5.0 (4/4) | 1239 (2%) | 19.1 (100%) |
| 17 | Montana | 52.9 | 14–21 | 11 | 28 | 36.3% | −4.1 (3/4) | 1213 (5%) | 19.4 (98%) |
| 18 | Wisconsin | 52.4 | 15–22 | 10 | 34 | 34.6% | −5.0 (3/4) | 1244 (2%) | 19.4 (95%) |
| 19 | North Carolina | 52.0 | 16–24 | 24 | 20 | 37.1% | −6.5 (3/4) | 1177 (23%) | 18.3 (91%) |
| 20 | Hawaii | 51.6 | 17–25 | 26 | 22 | 37.8% | −1.8 (1/4) | 1132 (31%) | 17.5 (68%) |
| 21 | Ohio | 50.9 | 18–28 | 13 | 35 | 32.4% | −5.3 (3/4) | 1034 (22%) | 18.8 (72%) |
| 22 | South Dakota | 50.8 | 18–29 | 12 | 37 | 34.2% | −4.6 (3/4) | 1208 (2%) | 21.0 (60%) |
| 23 | Indiana | 50.5 | 19–29 | 7 | 43 | 30.7% | −4.5 (3/4) | 952 (100%) | 23.5 (6%) |
| 24 | Florida | 50.3 | 20–29 | 25 | 24 | 35.8% | −7.7 (3/4) | 983 (86%) | 19.6 (39%) |
| 25 | Georgia | 50.3 | 20–30 | 31 | 21 | 36.3% | −4.8 (1/4) | 1041 (60%) | 21.4 (23%) |
| 26 | Nebraska | 50.3 | 20–29 | 21 | 26 | 35.4% | −7.3 (4/4) | 1270 (2%) | 19.2 (100%) |
| 27 | North Dakota | 49.7 | 21–31 | 14 | 40 | 34.0% | −4.7 (3/4) | 1211 (1%) | 19.4 (82%) |
| 28 | Kansas | 49.5 | 22–31 | 30 | 23 | 36.0% | −5.9 (3/4) | 1236 (2%) | 19.1 (73%) |
| 29 | Idaho | 49.4 | 22–31 | 15 | 39 | 33.0% | −6.0 (4/4) | 1010 (67%) | 23.3 (8%) |
| 30 | Tennessee | 49.3 | 22–32 | 16 | 36 | 32.4% | −2.9 (1/4) | 1189 (5%) | 18.8 (100%) |
| 31 | California | 47.9 | 27–34 | 40 | 14 | 38.1% | −4.4 (2/4) | 1108 (30%) | 26.4 (4%) |
| 32 | Maine | 47.8 | 28–34 | 38 | 19 | 37.1% | −9.8 (4/4) | 1087 (39%) | 25.4 (1%) |
| 33 | Texas | 46.8 | 31–36 | 34 | 27 | 35.2% | −5.2 (2/4) | 972 (75%) | 19.3 (22%) |
| 34 | Iowa | 46.7 | 31–36 | 19 | 41 | 32.0% | −4.5 (3/4) | 1227 (2%) | 21.0 (41%) |
| 35 | South Carolina | 45.6 | 33–39 | 35 | 32 | 33.3% | −3.5 (2/4) | 1021 (54%) | 18.7 (35%) |
| 36 | Missouri | 45.3 | 34–40 | 37 | 29 | 33.5% | −7.0 (4/4) | 1187 (4%) | 19.8 (70%) |
| 37 | Kentucky | 44.6 | 35–41 | 22 | 44 | 27.9% | −4.2 (2/4) | 1147 (4%) | 18.4 (100%) |
| 38 | Oregon | 44.6 | 34–41 | 45 | 16 | 37.8% | −9.7 (4/4) | 1136 (26%) | 20.8 (13%) |
| 39 | Michigan | 44.0 | 36–41 | 39 | 31 | 33.3% | −7.0 (3/4) | 959 (100%) | 24.6 (5%) |
| 40 | Delaware | 43.9 | 36–41 | 46 | 15 | 36.0% | −9.5 (4/4) | 929 (98%) | 25.2 (3%) |
| 41 | Arizona | 43.8 | 35–42 | 42 | 25 | 34.7% | −7.1 (4/4) | 1186 (10%) | 17.7 (99%) |
| 42 | Mississippi | 41.6 | 41–43 | 28 | 48 | 27.0% | −2.5 (1/4) | 1029 (2%) | 17.7 (100%) |
| 43 | Louisiana | 39.7 | 42–44 | 36 | 46 | 27.8% | +0.9 (1/4) | 1198 (3%) | 18.3 (100%) |
| 44 | Alabama | 38.2 | 43–45 | 43 | 42 | 29.9% | −0.6 (1/4) | 1175 (3%) | 18.0 (100%) |
| 45 | Nevada | 36.8 | 44–46 | 41 | 47 | 28.5% | −5.1 (3/4) | 1189 (7%) | 17.2 (100%) |
| 46 | Arkansas | 34.5 | 46–48 | 44 | 49 | 27.1% | −5.1 (3/4) | 1187 (3%) | 18.5 (92%) |
| 47 | Oklahoma | 33.9 | 46–48 | 47 | 45 | 29.3% | −8.8 (4/4) | 1183 (3%) | 17.5 (100%) |
| 48 | Alaska | 33.3 | 46–48 | 49 | 33 | 32.8% | −6.4 (3/4) | 1093 (27%) | 19.7 (9%) |
| 49 | New Mexico | 29.8 | 49–50 | 50 | 30 | 31.8% | −8.3 (4/4) | 876 (100%) | 20.6 (8%) |
| 50 | West Virginia | 27.8 | 49–50 | 48 | 50 | 24.4% | −6.8 (3/4) | 918 (98%) | 20.2 (19%) |
Massachusetts is first in all 10,000 re-runs. The middle of the table is a crowd.
Every NAEP score and every Census degree share is an estimate from a sample, with a published margin of error. We redrew each one within its own error, rebuilt the index and ranked the states again, 10,000 times. The bar shows the middle 90% of the ranks each state landed on; the dot is its rank in the table. Eight states stay in the top ten in at least 95% of runs, and New Mexico and West Virginia stay in the last two. For the ten states ranked 21st to 30th, the likely range spans 10 or more places: Ohio, 21st in the table, could be anywhere from 18th to 28th. The typical state’s range spans 6 places, so a gap of two or three ranks between neighbours is usually not a real difference.
- 1Massachusetts1
- 2Colorado2–3
- 3New Jersey2–3
- 4Connecticut4–5
- 5New Hampshire4–5
- 6Maryland6–8
- 7Vermont6–9
- 8Virginia6–9
- 9Utah7–11
- 10Minnesota9–12
- 11Washington9–13
- 12Illinois10–14
- 13New York10–15
- 14Rhode Island13–17
- 15Pennsylvania13–18
- 16Wyoming14–20
- 17Montana14–21
- 18Wisconsin15–22
- 19North Carolina16–24
- 20Hawaii17–25
- 21Ohio18–28
- 22South Dakota18–29
- 23Indiana19–29
- 24Florida20–29
- 25Georgia20–30
- 26Nebraska20–29
- 27North Dakota21–31
- 28Kansas22–31
- 29Idaho22–31
- 30Tennessee22–32
- 31California27–34
- 32Maine28–34
- 33Texas31–36
- 34Iowa31–36
- 35South Carolina33–39
- 36Missouri34–40
- 37Kentucky35–41
- 38Oregon34–41
- 39Michigan36–41
- 40Delaware36–41
- 41Arizona35–42
- 42Mississippi41–43
- 43Louisiana42–44
- 44Alabama43–45
- 45Nevada44–46
- 46Arkansas46–48
- 47Oklahoma46–48
- 48Alaska46–48
- 49New Mexico49–50
- 50West Virginia49–50
Range = 5th to 95th percentile of each state’s rank across 10,000 simulations. Errors: NAEP 2024 standard errors of each state mean (NAEP Data Service) and ACS 2024 margins of error for the two degree shares (Census Bureau). The index formula is unchanged.
Where students and adults disagree
A state’s school scores and its share of college graduates move together only loosely (correlation 0.39). They measure different people: today’s students, and adults, many of whom went to school in another state.
Students rank far above adults
High NAEP scores, fewer adults with degrees.
| State | School rank | Degrees rank |
|---|---|---|
| Indiana | 7 | 43 |
| Wyoming | 4 | 38 |
| North Dakota | 14 | 40 |
| South Dakota | 12 | 37 |
| Wisconsin | 10 | 34 |
Adults rank far above students
Many adults with degrees, lower NAEP scores.
| State | School rank | Degrees rank |
|---|---|---|
| Delaware | 46 | 15 |
| Maryland | 33 | 2 |
| Oregon | 45 | 16 |
| California | 40 | 14 |
| Vermont | 29 | 4 |
School scores fell in 49 states
Average change in NAEP scale points across the four tests (grades 4 and 8, math and reading), 2019 to 2024. Public schools nationwide fell −5.5 points. These are the states that held up best and the ones that fell furthest. “Significant drops” counts the tests on which NAEP’s own statistical test confirms the fall.
Held up best
| State | Change | Significant drops |
|---|---|---|
| Louisiana | +0.9 | 1 of 4 |
| Alabama | −0.6 | 1 of 4 |
| Hawaii | −1.8 | 1 of 4 |
| Mississippi | −2.5 | 1 of 4 |
| Tennessee | −2.9 | 1 of 4 |
Fell furthest
| State | Change | Significant drops |
|---|---|---|
| Maine | −9.8 | 4 of 4 |
| Oregon | −9.7 | 4 of 4 |
| Delaware | −9.5 | 4 of 4 |
| Virginia | −9.0 | 4 of 4 |
| Oklahoma | −8.8 | 4 of 4 |
How do states compare on the SAT and ACT?
A raw state average says more about who took the test than about the state. Nebraska has the highest SAT average of any state (1270), but only 2% of its graduates took the SAT; Nebraska gives every student the ACT instead. The fair comparison is between states that test nearly everyone, so the lists below only include states where 90% or more of graduates took the test.
SAT: states that test nearly everyone
Class of 2026. Total score out of 1600.
| State | Average | Tested |
|---|---|---|
| Colorado | 994 | 92% |
| Connecticut | 992 | 94% |
| Michigan | 959 | 100% |
| Indiana | 952 | 100% |
| Rhode Island | 946 | 100% |
| Delaware | 929 | 98% |
| West Virginia | 918 | 98% |
| New Mexico | 876 | 100% |
ACT: states that test nearly everyone
Class of 2025. Composite score out of 36.
| State | Average | Tested |
|---|---|---|
| Utah | 20.0 | 91% |
| Montana | 19.4 | 98% |
| Wisconsin | 19.4 | 95% |
| Nebraska | 19.2 | 100% |
| Wyoming | 19.1 | 100% |
| Tennessee | 18.8 | 100% |
| Arkansas | 18.5 | 92% |
| Kentucky | 18.4 | 100% |
| Louisiana | 18.3 | 100% |
| North Carolina | 18.3 | 91% |
| Alabama | 18.0 | 100% |
| Arizona | 17.7 | 99% |
| Mississippi | 17.7 | 100% |
| Oklahoma | 17.5 | 100% |
| Nevada | 17.2 | 100% |
The two lists cannot be merged into one ranking: SAT and ACT are different tests, and 27 states test fewer than 90% of graduates on either one. That is why neither test is part of the index. For converting a single score, see what the class of 2026 SAT average means and ACT national ranks.
Money, spending, adult skills, 2006 and regions
The ranking answers one question: which states score highest. These five readings of the same 50 states, built from three more public sources, answer the questions that usually follow it: does money buy the result, which states beat their circumstances, do the adults match the children, what has changed in twenty years, and where do most Americans actually live.
Richer states score higher, but not all of them
Each dot is a state. The line is what household income alone would predict; states above it do better than their income suggests.
Swipe sideways on a phone to see the whole chart. Median household income: US Census Bureau, ACS 2024 1-year, table B19013. Correlation 0.70 (income explains 49% of the variation in the index). Every $10,000 of median income goes with about 5.7 more index points.
Score more than their income predicts
Index points above the line in Fig 6.
| State | Income | Index | Expected | Gap |
|---|---|---|---|---|
| Massachusetts | $104,828 | 79.1 | 63.7 | +15.4 |
| Vermont | $82,730 | 60.2 | 51.0 | +9.2 |
| Colorado | $97,113 | 68.4 | 59.3 | +9.1 |
| Wyoming | $75,532 | 53.4 | 46.9 | +6.5 |
| Montana | $75,340 | 52.9 | 46.8 | +6.1 |
| North Carolina | $73,958 | 52.0 | 46.0 | +6.0 |
Score less than their income predicts
Index points below the line in Fig 6.
| State | Income | Index | Expected | Gap |
|---|---|---|---|---|
| Alaska | $95,665 | 33.3 | 58.4 | −25.1 |
| Nevada | $81,134 | 36.8 | 50.1 | −13.3 |
| California | $100,149 | 47.9 | 61.0 | −13.1 |
| New Mexico | $67,816 | 29.8 | 42.5 | −12.7 |
| West Virginia | $60,798 | 27.8 | 38.5 | −10.7 |
| Delaware | $87,534 | 43.9 | 53.8 | −9.9 |
Spending per pupil explains 2% of the NAEP gap between states
Per-pupil current spending in public schools, fiscal year 2023, ranges from $10,291 (Idaho) to $30,012 (New York); the US figure is $16,526. Across the 50 states, spending and NAEP results barely move together (correlation 0.15). The table shows the states that get the most and the least out of what they spend: their NAEP composite compared with what their spending level would predict. Nationally, spending per pupil rose 31.6% from 2018 to 2023 while NAEP scores fell 5.5 points.
Most results for the money
NAEP composite above what spending predicts, in student standard deviations.
| State | Per pupil | Spend rank | School rank | Above expected |
|---|---|---|---|---|
| Massachusetts | $22,947 | 5 | 1 | +0.24 |
| Utah | $10,333 | 49 | 5 | +0.17 |
| Colorado | $14,858 | 27 | 6 | +0.14 |
| New Hampshire | $21,731 | 6 | 3 | +0.14 |
| New Jersey | $26,280 | 3 | 2 | +0.14 |
| Indiana | $13,121 | 37 | 7 | +0.14 |
Least results for the money
NAEP composite below what spending predicts.
| State | Per pupil | Spend rank | School rank | Below expected |
|---|---|---|---|---|
| New Mexico | $15,693 | 24 | 50 | -0.34 |
| Alaska | $20,340 | 9 | 49 | -0.29 |
| West Virginia | $14,575 | 31 | 48 | -0.21 |
| Delaware | $21,340 | 7 | 46 | -0.18 |
| Oklahoma | $11,155 | 48 | 47 | -0.15 |
| Oregon | $17,161 | 19 | 45 | -0.15 |
Degrees count credentials. PIAAC measures what adults can actually do.
The National Center for Education Statistics publishes state estimates of adult literacy and numeracy from the PIAAC survey, the only direct test of adult skills given across the whole country (latest state estimates: 2017). We rank the states on the two averages combined. The result agrees with our index only moderately (correlation 0.53), and some states look very different through this lens: Alaska is 48th in the index but 4th on adult skills, while Massachusetts, first in the index, is 8th.
Most skilled adults
PIAAC averages (scale 0 to 500) and the share of adults at or below numeracy level 1.
| State | Literacy | Numeracy | Low numeracy | Index rank |
|---|---|---|---|---|
| New Hampshire | 279 | 268 | 19% | 5 |
| Minnesota | 279 | 268 | 20% | 10 |
| Vermont | 277 | 265 | 21% | 7 |
| Alaska | 277 | 264 | 21% | 48 |
| North Dakota | 276 | 264 | 21% | 27 |
| Washington | 275 | 262 | 23% | 11 |
Least skilled adults
In the lowest states, about four adults in ten are at or below numeracy level 1.
| State | Literacy | Numeracy | Low numeracy | Index rank |
|---|---|---|---|---|
| Louisiana | 252 | 233 | 42% | 43 |
| Mississippi | 252 | 234 | 43% | 42 |
| New Mexico | 252 | 235 | 40% | 49 |
| Texas | 254 | 238 | 39% | 33 |
| Nevada | 255 | 240 | 36% | 45 |
| California | 257 | 244 | 36% | 31 |
Twenty years on: who climbed and who fell
The “average IQ by state” figures that circulate online come from one 2006 paper, which estimated them from NAEP 2003 scores. Ranking the states on those estimates and on our 2026 index gives a rank correlation of 0.62: the broad picture holds, but five of the 2006 top ten are still in the top ten. The states that moved most are below. We print the 2006 values as the paper gave them; they are estimates, not test results, and our article on the state IQ lists explains why.
Climbed the most
| State | 2006 estimate | 2006 rank | 2026 rank | Places |
|---|---|---|---|---|
| Hawaii | 95.6 | 47 | 20 | +27 |
| Maryland | 99.7 | 32 | 6 | +26 |
| Illinois | 99.9 | 31 | 12 | +19 |
| Rhode Island | 99.5 | 33 | 14 | +19 |
| Colorado | 101.6 | 20 | 2 | +18 |
| California | 95.5 | 48 | 31 | +17 |
Fell the most
| State | 2006 estimate | 2006 rank | 2026 rank | Places |
|---|---|---|---|---|
| Iowa | 103.2 | 8 | 34 | −26 |
| Maine | 103.4 | 7 | 32 | −25 |
| North Dakota | 103.8 | 4 | 27 | −23 |
| Oregon | 101.2 | 23 | 38 | −15 |
| Kansas | 102.8 | 13 | 28 | −15 |
| West Virginia | 98.7 | 37 | 50 | −13 |
The average American lives in a state scoring 51.1
Every state counts once in the index, so California and Wyoming weigh the same. Weighting the states by population instead gives the score of the state where the typical American lives: 51.1, and 54% of Americans live in a state at or above the average state. By Census region, the Northeast leads and the South trails, on school scores and on degrees alike.
| Region | States | Average index | Weighted by population | Highest | Lowest | NAEP change 2019 to 2024 | Bachelor’s or higher |
|---|---|---|---|---|---|---|---|
| Northeast | 9 | 60.9 | 60.9 | Massachusetts (1) | Maine (32) | −6.4 | 41.7% |
| Midwest | 12 | 50.3 | 50.8 | Minnesota (10) | Michigan (39) | −5.5 | 34.6% |
| South | 16 | 45.0 | 48.1 | Maryland (6) | West Virginia (50) | −5.2 | 33.0% |
| West | 13 | 48.3 | 49.4 | Colorado (2) | New Mexico (49) | −5.6 | 36.2% |
Regions as defined by the Census Bureau. Average index: the simple mean of the states in the region. NAEP change and degree share are also simple means of the states. Population: ACS 2024 1-year, table B01003.
How we built the index
Two measured inputs, equal weight, one score per state. Every number on this page can be checked against the public source it came from.
01School skills
We took each state’s average score on the four main NAEP tests of 2024: math and reading in grades 4 and 8, public school students. For each test we measured how far the state sits from the national public school average, in units of the national spread of student scores, and averaged the four results. NAEP is the only test given the same way in every state, which is why we use it instead of state exams.
02Adult degrees
From the Census Bureau’s American Community Survey 2024 (1-year estimates, table B15003), we took the share of adults aged 25 and over with a bachelor’s degree or higher and the share with a graduate or professional degree. Each was compared with the 50-state average, and the two were averaged.
03The index score
Index score = 50 + 10 × (that distance, in standard deviations between states).
So 50 is the average state, 60 is one standard deviation above it and 40 is one below. Every state counts once, whatever its size. Ranks use the unrounded score.
04What is not in the index
SAT and ACT. Participation runs from 1% to 100% of graduates, so raw averages reward states where few students take the test. We show them beside the index, with the share tested, and compare them only among states that test nearly everyone.
IQ. This is not an IQ ranking. No one has given an IQ test to a representative sample in every state. If you want the IQ-style estimates other sites print, and why they are shaky, read average IQ by US state: what the numbers rest on.
05Checks
The NAEP figures were pulled from the NAEP Data Service and match the state composite in our earlier state article to the decimal (Massachusetts first and New Mexico last on all four tests). Statements about real differences use NAEP’s own significance tests: 2019 against 2024 for each state, and every state against national public schools and against every other state. Every SAT average was checked against the female and male averages in the same College Board report. The page is rebuilt by script from the data, and the build fails if any number in the text no longer matches it.
06Rank ranges
Each input to the index is a sample estimate. NAEP publishes a standard error for every state mean, and the Census Bureau publishes a 90% margin of error for every count in table B15003, from which we computed standard errors for the two degree shares with the Bureau’s own formulas. We redrew all 200 NAEP means and all 100 degree shares at random within their errors, rebuilt the index with the same formula, ranked the 50 states, and repeated this 10,000 times. A state’s likely rank is the middle 90% of the ranks it landed on (5th to 95th percentile). The national average is held fixed, because shifting it moves every state equally. The ranges show how far the published rank could move through sampling error alone; they do not test the choice of inputs or weights.
07Limits
- NAEP covers public school students in grades 4 and 8 only.
- Census figures are survey estimates; in small states the margin of error is around one percentage point.
- A state average hides large differences between districts and between groups of students.
- Ranks that are close together often reflect differences smaller than the error in the data. On NAEP’s own tests, Ohio’s grade 4 math rank could be anywhere from 3rd to 34th; Massachusetts is significantly ahead of at least 40 of the other 49 states on every test. Fig 2b gives every state’s likely rank range.
- The index describes states, not people. It says nothing about any one resident.
08The five lenses
Income. A straight line fitted to the 50 index scores against median household income (ACS 2024, table B19013). “Expected” is the point on that line; the gap is the state’s score minus it. Spending. The same fit of each state’s NAEP composite (in student standard deviations against US public schools) on per-pupil current spending (Census Annual Survey of School System Finances, fiscal year 2023, Table 20); the gap is in student standard deviations. Adult skills. The PIAAC Skills Map state estimates of average literacy and numeracy (NCES, 2017 model-based estimates), each standardised across the 50 states and averaged. 2006. The state estimates in McDaniel (2006), ranked, against the 2026 index rank; the correlation is Spearman’s. Regions. Census regions; the population-weighted figures use ACS 2024 state populations (table B01003). None of the five changes the index itself.
09How this differs from other state lists
“Most educated states” lists rank credentials: degrees held, school enrolment, sometimes school quality grades from a third party. “Average IQ by state” lists reprint estimates from a 2006 paper that were themselves modelled from NAEP 2003. This index uses measured results from both ends of life, children tested in 2024 and adults counted in 2024, gives them equal weight, publishes the formula and the input file, states which differences are statistically real, and reports the five lenses so a reader can see what money, spending, adult skills, time and geography each add. It is rebuilt whenever a source updates, under a version number.
10Versions and updates
This is version 2026.10 of the index, published 15 October 2026. When NAEP, the Census Bureau, the College Board, ACT or NCES publishes new state results, we rebuild the index, give it a new version number and list the change here. Cite the version you used so readers can find the same numbers.
Sources
- National Center for Education Statistics, NAEP (The Nation’s Report Card), 2019 and 2024 state results, standard errors and significance tests, via the NAEP Data Service.
- US Census Bureau, American Community Survey 2024 1-year: tables B15003 (educational attainment), B19013 (median household income) and B01003 (population), from the public summary file.
- US Census Bureau, Annual Survey of School System Finances, fiscal year 2023, summary Table 20 (per pupil current spending, 2018 to 2023).
- National Center for Education Statistics, PIAAC Skills Map: state estimates of adult literacy and numeracy (2017).
- College Board, SAT Suite of Assessments annual reports by state, class of 2026.
- ACT, average ACT scores by state, class of 2025 (the latest state table we could find).
- McDaniel, M. A. (2006). Estimating state IQ: Measurement challenges and preliminary correlates. Intelligence, 34(6), 607-619. State values as republished by World Population Review.
Share it, cite it, download it
You may reuse everything on this page under CC BY 4.0: in articles, reports, lessons and posts. The one condition is credit to IQ Metrics with a link to this page.
Cite this data set
Version 2026.10. Citing the version lets readers find the exact numbers.
IQ Metrics. (2026). Smartest States Index 2026: All 50 US states ranked on school scores and adult degrees (Version 2026.10) [Data set]. https://iqmetrics.org/research/smartest-states-in-america/
IQ Metrics. Smartest States Index 2026: All 50 US States Ranked on School Scores and Adult Degrees. Version 2026.10, 15 Oct. 2026, iqmetrics.org/smartest-states/.
IQ Metrics. Smartest States Index 2026: All 50 US States Ranked on School Scores and Adult Degrees. Version 2026.10. October 15, 2026. https://iqmetrics.org/research/smartest-states-in-america/.
@misc{iqmetrics_smartest_states_2026,
  author = {{IQ Metrics}},
  title  = {Smartest States Index 2026: All 50 US States Ranked on School Scores and Adult Degrees},
  year   = {2026},
  note   = {Version 2026.10. Data set, CC BY 4.0},
  url    = {https://iqmetrics.org/research/smartest-states-in-america/}
}
Source: IQ Metrics Smartest States Index 2026 (version 2026.10), https://iqmetrics.org/research/smartest-states-in-america/
Embed the top ten
Paste this into your page or post. It shows the top ten states and credits the source.
Get the data
One row per state: the index, its two parts, and the NAEP and Census figures behind them.
| Column | What it holds |
|---|---|
| index_score | Smartest States Index score; 50 = the average state, 10 points = one standard deviation |
| school_rank, degree_rank | Rank of 50 on each half of the index |
| naep_2024_gap_vs_us_public_sd | Average of the four NAEP 2024 tests, as distance from the US public school average in student standard deviations |
| naep_change_2019_2024_points | Average change in NAEP scale points across the four tests |
| naep_math4, naep_math8, naep_read4, naep_read8 | NAEP 2024 average scale scores, public schools, by test |
| pct_bachelors_or_higher, pct_graduate_degree, pct_high_school_or_higher | Share of adults 25 and over, ACS 2024 1-year, table B15003 |
| naep_tests_significant_drop_2019_2024 | Of the four NAEP tests, how many show a statistically significant drop (NAEP’s own test) |
| naep_tests_significantly_above_us, naep_tests_significantly_below_us | Of the four NAEP tests, how many are significantly above or below US public schools |
| median_household_income_2024, index_expected_from_income, index_vs_income_expected, rank_vs_income | ACS 2024 table B19013; the index score predicted from income; the gap; rank on the gap (1 = beats income most) |
| per_pupil_spending_fy2023, per_pupil_spending_rank, naep_vs_spending_expected_sd, rank_results_per_dollar | Census school finances FY2023, Table 20; spending rank (1 = most); NAEP composite above or below what spending predicts, in student SDs; rank on that gap |
| adult_literacy_piaac, adult_numeracy_piaac, pct_adults_numeracy_level1_or_below, adult_skills_rank | NCES PIAAC Skills Map state estimates (2017); rank on literacy and numeracy combined |
| mcdaniel_2006_iq_estimate, rank_2006, rank_change_2006_to_2026 | McDaniel (2006) state estimate; its rank; places climbed (positive) or fallen against the 2026 index |
| region, population_2024 | Census region; ACS 2024 table B01003 |
| rank_likely_low, rank_likely_high | Likely rank range: 5th and 95th percentile of the state’s rank in 10,000 re-runs of the index within the NAEP and ACS margins of error |
SAT figures belong to the College Board and ACT figures to ACT Education Corp. They are shown on this page with credit and are not in the CSV.
For journalists, researchers and teachers
Everything on this page may be quoted, charted and republished with credit. No embargo, no permission needed, no sign-up. If you need something that is not here, ask.
Summary you can paste
Three sentences in plain news style. Edit freely; keep the credit.
Massachusetts is the smartest state in the US in 2026, according to the IQ Metrics Smartest States Index, which ranks all 50 states on NAEP 2024 school test scores and the share of adults with college degrees. Colorado, New Jersey, Connecticut and New Hampshire complete the top five; West Virginia ranks last. The study also finds that 49 of 50 states scored lower on NAEP than in 2019, that household income explains about half of the gap between states, and that per-pupil school spending explains almost none of it. Source: IQ Metrics, https://iqmetrics.org/research/smartest-states-in-america/
Angles for a local story
- Where your state ranks, and whether its rank is statistically different from its neighbours (pick the state; the card gives the one-paragraph version).
- Your state’s school scores since 2019, and on how many of the four NAEP tests the fall is statistically real (Fig 4).
- Whether your state does better or worse than its household income predicts (Fig 6).
- What your state gets for its spending per pupil, against the states that spend less and score higher (Fig 7).
- Whether your state’s adults are as skilled as its degree count suggests (Fig 8).
- How far your state has moved since the 2006 “average IQ by state” list that still circulates (Fig 9).
Files
- (CC BY 4.0)
- Share card, 1200 x 630 PNG (the top five, with the credit line)
- Map, 1200 x 1000 PNG (all 50 states, index bands)
- A card for any single state, 1200 x 630 PNG, generated on the page
- Citations in APA, MLA, Chicago, BibTeX and plain text; embed code for the top ten
Terms, contact and corrections
Credit: “IQ Metrics Smartest States Index 2026” with a link to this page. On air or in print, “IQ Metrics” and the page address are enough.
What we can provide: the full breakdown for any state, the four NAEP scores behind each composite, the significance tests for any pair of states, and a short written comment from the analyst on the method.
Contact: the research team, through the contact page. Corrections are made on this page with a dated note under “Versions and updates”.
Please do not describe the index as an IQ test result or as a measure of any individual. It describes states.
The smartest states, answered
What is the smartest state in the US?
Massachusetts, with an index score of 79.1. It ranks first on NAEP 2024 school scores and first on adult degrees, with 48.3% of adults holding a bachelor’s degree or higher. Colorado, New Jersey, Connecticut and New Hampshire complete the top five.
Which state ranks last?
West Virginia ranks 50th, with an index score of 27.8. It is 48th on school scores and 50th on adult degrees: 24.4% of its adults hold a bachelor’s degree or higher. New Mexico is 49th and Alaska 48th.
What are the 10 smartest states in the US?
In order: Massachusetts (1), Colorado (2), New Jersey (3), Connecticut (4), New Hampshire (5), Maryland (6), Vermont (7), Virginia (8), Utah (9), Minnesota (10). The ranking gives equal weight to NAEP 2024 school test scores and the share of adults with college degrees.
Which states rank lowest (the so-called dumbest states)?
The ten lowest, from 41st to 50th: Arizona (41), Mississippi (42), Louisiana (43), Alabama (44), Nevada (45), Arkansas (46), Oklahoma (47), Alaska (48), New Mexico (49), West Virginia (50). A low rank means lower average school test scores and fewer adults with degrees than other states. It says nothing about any one person who lives there.
Are the differences between states real, or just noise?
Many are real, but not all. Using NAEP’s own significance tests, only Massachusetts, New Hampshire, Utah and Wyoming score significantly above US public schools on all four tests, and Massachusetts is significantly ahead of at least 40 of the other 49 states on every test. In the middle of the table, states a few places apart are often statistically tied, which is why we show index scores and not only ranks.
Is this a ranking of average IQ by state?
No. No IQ test has been given to a representative sample in every state, so any “average IQ by state” list is an estimate built from other data. This ranking uses the measured data directly: NAEP school test scores and Census degree figures. Our article on average IQ by US state explains how the IQ-style lists are made.
How certain are the ranks?
Certain at the top and bottom, much less in the middle. We re-ran the index 10,000 times with every NAEP score and degree share redrawn within its published margin of error. Massachusetts was first every time, and New Mexico and West Virginia stayed in the last two. The ten states ranked 21st to 30th each have a likely range of 10 or more places; Ohio, 21st, could be anywhere from 18th to 28th. The table and Fig 2b show each state’s range.
Why are SAT and ACT scores not part of the ranking?
Because participation is too uneven. Some states give the SAT or ACT to every student, while in others only 1% to 5% of graduates take it, mostly students aiming for selective colleges. Their averages are much higher for that reason alone. We show both tests beside the index and compare them only among states that test 90% or more of graduates.
How much did school scores change since 2019?
Averaged over the four NAEP tests, 49 of 50 states scored lower in 2024 than in 2019. Public schools nationwide fell −5.5 points. Louisiana was the only state to rise (+0.9 points); Maine (−9.8) and Oregon (−9.7) fell the most.
Can I use these numbers in my article or report?
Yes. The index and the CSV are under CC BY 4.0: reuse them with credit and a link to this page. The citation and download are above. For NAEP and Census figures you can also cite the original sources listed in the method section.
Does spending more per pupil buy higher school scores?
Not across states, on this data. Per-pupil current spending (fiscal year 2023) explains 2% of the differences in NAEP 2024 results between states. Utah spends $10,333 per pupil, 49th of 50, and ranks 5th on school skills; New York spends $30,012, the most of any state, and ranks 32nd. Spending still matters within a state, for particular schools and students; this is a comparison between state averages only.
Which states do better than their income would predict?
Massachusetts, Vermont, Colorado, Wyoming and Montana score furthest above the line that median household income alone would predict. Alaska, Nevada, California and New Mexico score furthest below it. Household income explains about 49% of the variation in the index across the 50 states.
Which states have the most skilled adults?
On the NCES PIAAC state estimates of adult literacy and numeracy, New Hampshire and Minnesota lead, followed by Vermont, Alaska and North Dakota. Louisiana, Mississippi and New Mexico have the lowest averages, with about four adults in ten at or below numeracy level 1. Adult skills and the index agree only moderately (correlation 0.53), because a degree count and a skills test measure different things.
Is the Northeast the smartest region?
Yes, on the index. The nine Northeastern states average 60.9, the Midwest 50.3, the West 48.3 and the South 45.0 (50 is the average state). The Northeast also has the highest share of adults with a bachelor’s degree. Weighting every state by population, the typical American lives in a state scoring 51.1.
How often is the ranking updated?
Once a year, and whenever a source publishes new state results: NAEP, the Census Bureau’s American Community Survey, the College Board or ACT. The page keeps the same address, and the date at the top shows the latest update.
States are averages.
Your score is your own.
A state ranking says nothing about any one person. If you want to know where your own reasoning stands, the IQ Metrics assessment reports your score, your percentile and a breakdown by ability.
Take the IQ test →