
How to Read an IQ Test Report: FSIQ, Indexes and Confidence Intervals
An IQ report puts numbers on at least three different scales and almost never explains which of them matters. Here is what FSIQ, the index scores, the subtest scaled scores, the percentile rank and that bracketed range each mean, and when the headline number should not be read at all.
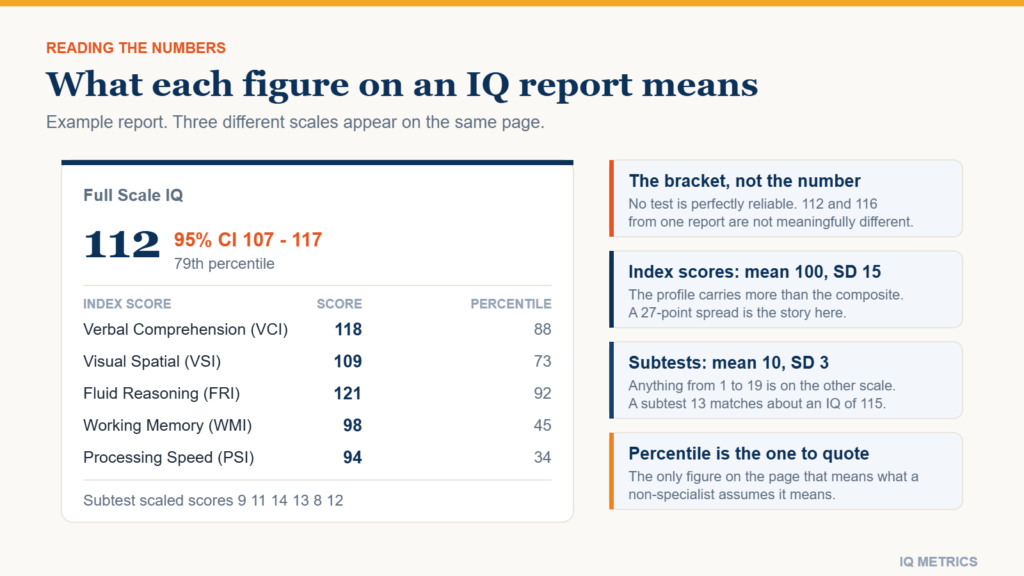
An IQ test report puts numbers on at least three different scales on the same page, and it rarely says so. The Full Scale IQ and the index scores use a mean of 100. The subtest scores use a mean of 10. The percentile rank is on a scale of 1 to 99 and is not a percentage of anything. Read them as though they were comparable and you will draw the wrong conclusion within about thirty seconds.
This guide walks the report from the top down: what each number is, what a normal amount of variation looks like, and the one circumstance in which the headline figure should be set aside entirely. It covers the Wechsler family — the WAIS for adults and the WISC for children — because those account for the large majority of reports people are handed.
Full Scale IQ, and the bracket after it
The Full Scale IQ (FSIQ) is the composite: a single figure derived from the subtests, scaled so that the population average is 100 and the standard deviation is 15. Around two-thirds of people fall between 85 and 115, and about 95 per cent between 70 and 130. Our IQ bell curve page shows the distribution these figures come from.
Immediately after it you will usually see something like 112 (95% CI: 107–117). That bracket is a confidence interval, and it is the most informative and most ignored item on the page. It exists because no test is perfectly reliable: retest the same person and the score moves a little. The interval is the band within which the true score most plausibly sits. For the FSIQ on a modern Wechsler battery it is typically around plus or minus four to five points.
The practical consequence: a 112 and a 116 from the same report are not meaningfully different, and neither are two people three points apart. Treating a single point as informative is the single most common misreading of these reports, and it is the reason our article on what an IQ score really means leads with the range rather than the point estimate.
Index scores: the four or five numbers that matter more
Beneath the FSIQ sit the index scores, also on a mean of 100 and a standard deviation of 15. Each summarises one broad domain. The current Wechsler scales for children and the newest adult edition use five:
- Verbal Comprehension (VCI) — word knowledge, verbal concepts, acquired verbal reasoning.
- Visual Spatial (VSI) — construction and analysis of visual material, block-design style tasks.
- Fluid Reasoning (FRI) — inferring rules from novel patterns, closest to the matrix items on an online test.
- Working Memory (WMI) — holding and manipulating information over short intervals.
- Processing Speed (PSI) — how quickly simple, well-defined visual tasks are completed.
Older reports, including those using the WAIS-IV, combine the second and third into a single Perceptual Reasoning Index, giving four rather than five. If your report shows PRI instead of VSI and FRI, that is which edition was administered, not an omission. The domains map closely onto the ability structure described on our page about how IQ tests work.
For most purposes the index profile is more useful than the FSIQ. A single composite averages away exactly the pattern that a referral question usually turns on — strong verbal ability alongside weak working memory says something specific, and it disappears entirely once it is folded into one number.
Descriptors, and strengths that are only relative
Most reports attach a word to each score — Average, High Average, Superior and so on. These are labels for bands on the same scale, they vary between publishers and editions, and newer manuals have deliberately moved away from the older, more stigmatising terminology at the low end. Read the number and the percentile; treat the adjective as shorthand. Our article on IQ classifications sets out how the bands are drawn and why they differ.
One further distinction causes constant confusion. A normative strength means high compared with the general population. A personal or relative strength means high compared with the rest of your own profile. Someone can have a personal strength in verbal comprehension that is still below the population average, and a personal weakness in processing speed that is comfortably above it. Good reports say which sense they mean; not all of them do.
Scaled scores: the numbers between 1 and 19
Individual subtests are reported as scaled scores on a completely different metric: a mean of 10, a standard deviation of 3, and a practical range of 1 to 19. A scaled score of 10 is exactly average. 13 is one standard deviation above; 7 is one below.
The trap is obvious once stated. A subtest score of 12 is a good result, and an index score of 12 would be impossible. If a number in the report is between 1 and 19 it is a subtest and it lives on the mean-of-10 scale — multiply the distance from 10 by five and add 100 for a rough IQ-scale equivalent, so a 13 is roughly the same standing as a 115.
Subtest scores are also the least reliable figures on the page. Individual subtests have narrower reliability than composites, so their confidence intervals are proportionally wider. Modern practice discourages interpreting a single low subtest in isolation, which does not stop people doing it.
Where would your own score land?
Take the IIF-certified assessment and get your score with the scale it was measured on, the percentile it corresponds to and the confidence range around it — the three figures most online tests leave out.
Percentile rank: the number to quote
The percentile rank says what share of the reference group scored at or below that level. An FSIQ of 100 is the 50th percentile. 115 is roughly the 84th; 130 is roughly the 98th. It is not a percentage score and has nothing to do with how many items were answered correctly.
If you plan to explain a result to anyone, the percentile is the figure to use. It is the one number on the report that means what a non-specialist assumes it means. Our IQ percentile calculator converts in either direction, and the score converter handles the other complication — some tests use a standard deviation of 16 rather than 15, so the same percentile carries a different IQ number.
When the Full Scale IQ should not be reported
There is one genuinely technical rule that reports often apply without explaining. If the index scores differ from each other sufficiently — a large gap between the highest and lowest — the FSIQ is describing an average of things that are not behaving alike, and psychologists will say it should be interpreted with caution or not at all.
In that situation many reports substitute the General Ability Index (GAI), a composite built from the verbal and reasoning indices only, leaving out working memory and processing speed. It is used when those two are depressed by something that is not general ability — attention difficulties, anxiety, motor slowing. Because processing speed is the least g-loaded index, a low PSI can pull an FSIQ down several points while telling you very little about reasoning.
A large split of this kind is common in the profiles discussed in our article on ADHD, autism, dyslexia and IQ scores, which is exactly why the GAI exists.
What else belongs in a real report
A competent report is not just a score table. Look for all of these; their absence is informative:
- The referral question — what the assessment was actually asked to establish.
- The test edition and date. Norms age, and an obsolete edition inflates scores.
- Behavioural observations during testing — effort, attention, fatigue, whether the result is considered a valid estimate.
- A statement of validity. A report that never says whether the examiner believed the result is not finished.
- Recommendations tied to the profile rather than to the headline number.
And one thing that should not be there: a diagnosis derived from scores alone. An IQ report describes cognitive performance on a given day. Anything beyond that requires other evidence.
If your report came from an online test
Online tests, ours included, produce a much simpler output and should be read more cautiously. There is no examiner, no behavioural observation and no validity judgement, so the result is an estimate of where you sit rather than a clinical finding. We set out what that does and does not support on our IQ test accuracy page, and what a well-built online test should disclose.
Used for what it is — a normed benchmark rather than an assessment — it is a reasonable starting point. Our free IQ test reports a score against age norms with the percentile alongside it, which is the same pair of numbers you should be reading first on any report.
Keep reading
 Research & Evidence
Does School Raise IQ?
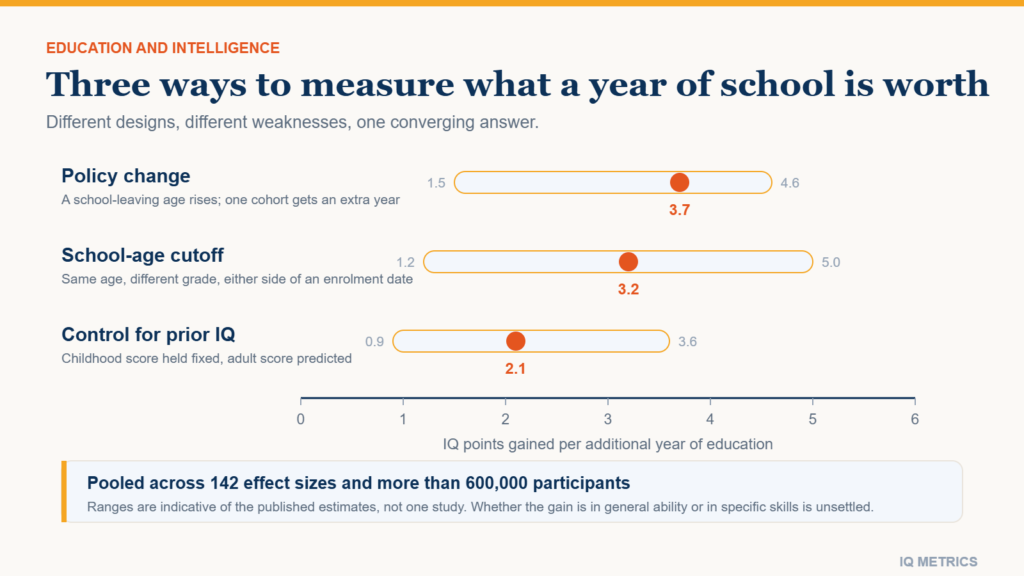
Education is the environmental factor with the strongest evidence for actually raising IQ scores, and the effect is bigger than most people expect. Three independent study designs, pooled across more than 600,000 participants, point the same way. Here is the size of it, and the caveat that gets dropped.
 Taking a Test
Professional IQ Tests
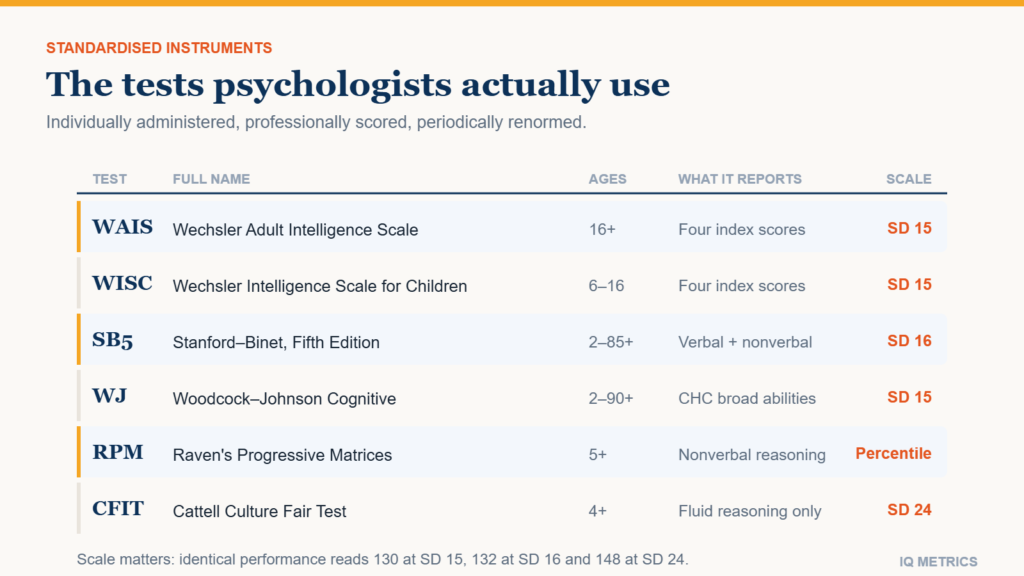
When a psychologist measures intelligence, they reach for one of a small number of standardised instruments. This guide covers what the Wechsler scales, Stanford-Binet, Woodcock-Johnson and Raven’s Progressive Matrices each measure, who each one is for, and where an online test genuinely fits.
 Scores & Scales
What Your IQ Test Score Really Means?
IQ scores measure intelligence and problem-solving. IQ tests can reveal intellectual abilities, but they should be taken cautiously and with knowledge of their limitations. Because intelligence is multidimensional, no single test can measure it.