Gifted Cutoff Scores: Why a Single Number Misses Children
Most gifted programmes draw their line at an IQ of 130. The number is a statistical convention rather than a boundary in nature, and three well-documented features of how the score is produced and used mean a strict cutoff reliably excludes children who belong on the other side of it.
An IQ of 130 is the usual entry requirement for a gifted programme, and it is a convention, not a discovery. It marks two standard deviations above the mean on the scales most tests use, which places it at roughly the 98th percentile. Nothing changes at that point in the distribution. There is no cognitive category boundary there; there is a round number chosen because it is convenient.
That would matter less if the number the cutoff is applied to were exact. It is not, and the gap between an obtained score and the quantity it estimates is large enough to change the answer for a great many children. Three separate features of the process compound: measurement error, the choice of comparison group, and who gets tested in the first place.
Where 130 comes from
Modern tests are scored so that the population mean is 100 and the standard deviation is 15. Two standard deviations up is 130, which leaves about 2.3 per cent of the population above it. That is the entire derivation. The choice of two standard deviations mirrors the convention on the other side of the distribution, where a similar cutoff has historically been used in defining intellectual disability.
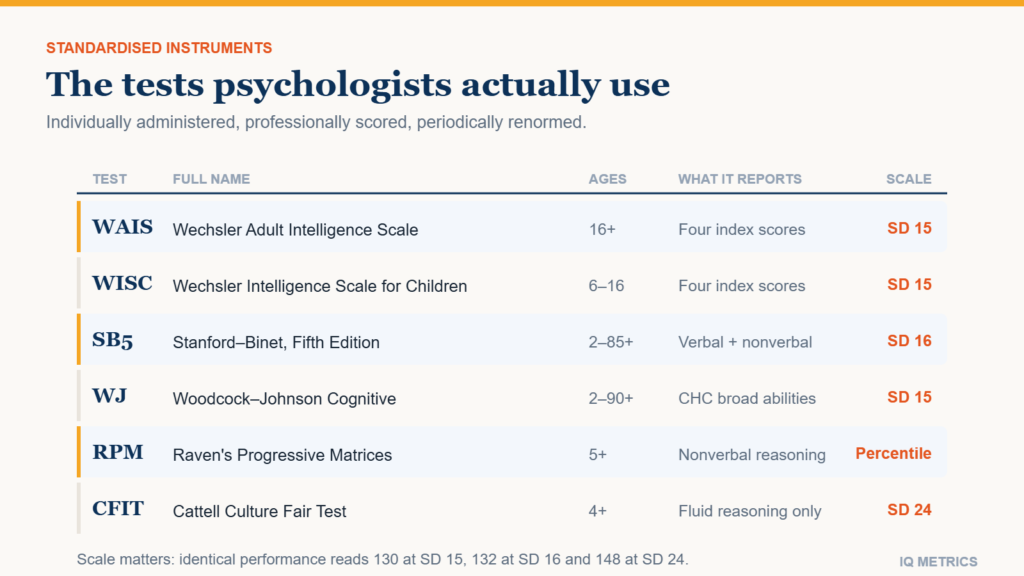
Because it is a percentile in disguise, the same label means different things on different instruments. A test standardised with a standard deviation of 16 rather than 15 puts the same percentile at a different number, and older scales computed scores in ways that do not map cleanly onto percentiles at all. Comparing a reported 132 from one instrument with a 129 from another is not a meaningful comparison — the underlying scales differ, as IQ classifications sets out.
The measurement error nobody applies
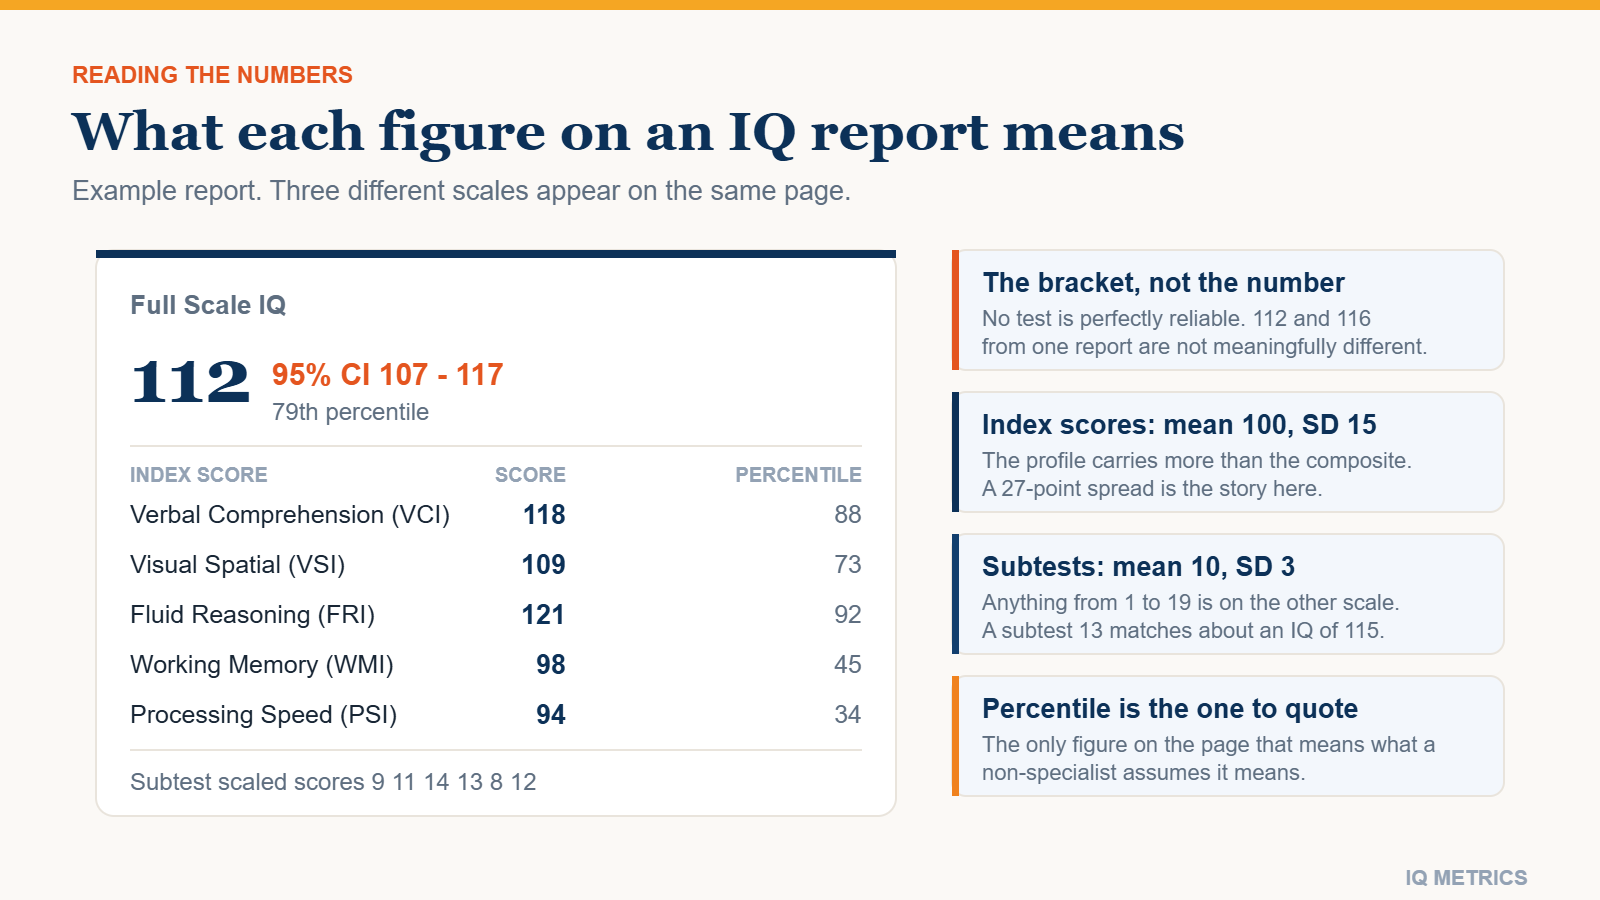
Every well-constructed test reports a standard error of measurement, and every properly written report expresses the result as an interval rather than a point. On the major individually administered scales, the ninety-five per cent interval around a full-scale score is usually about five points either side.
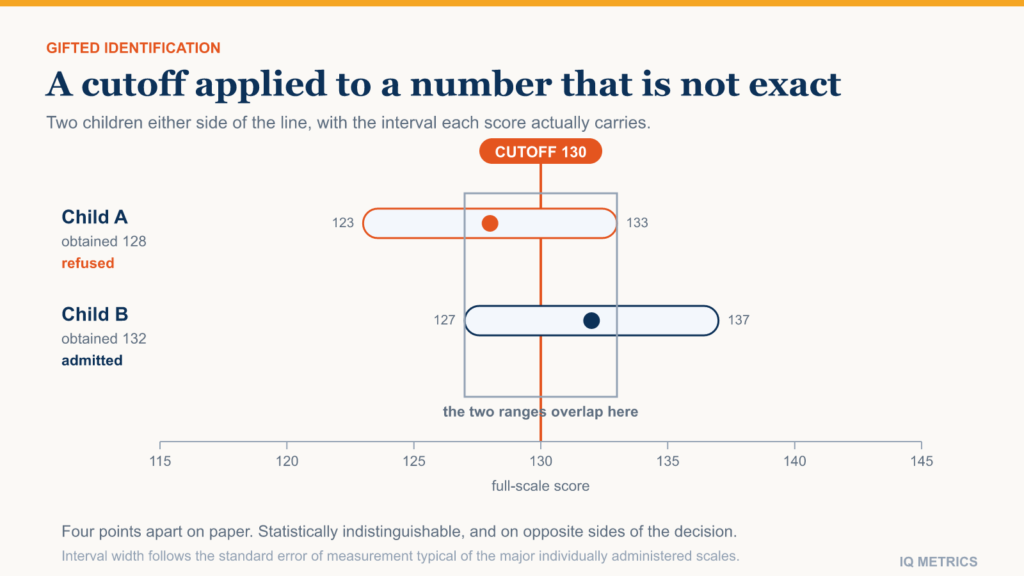
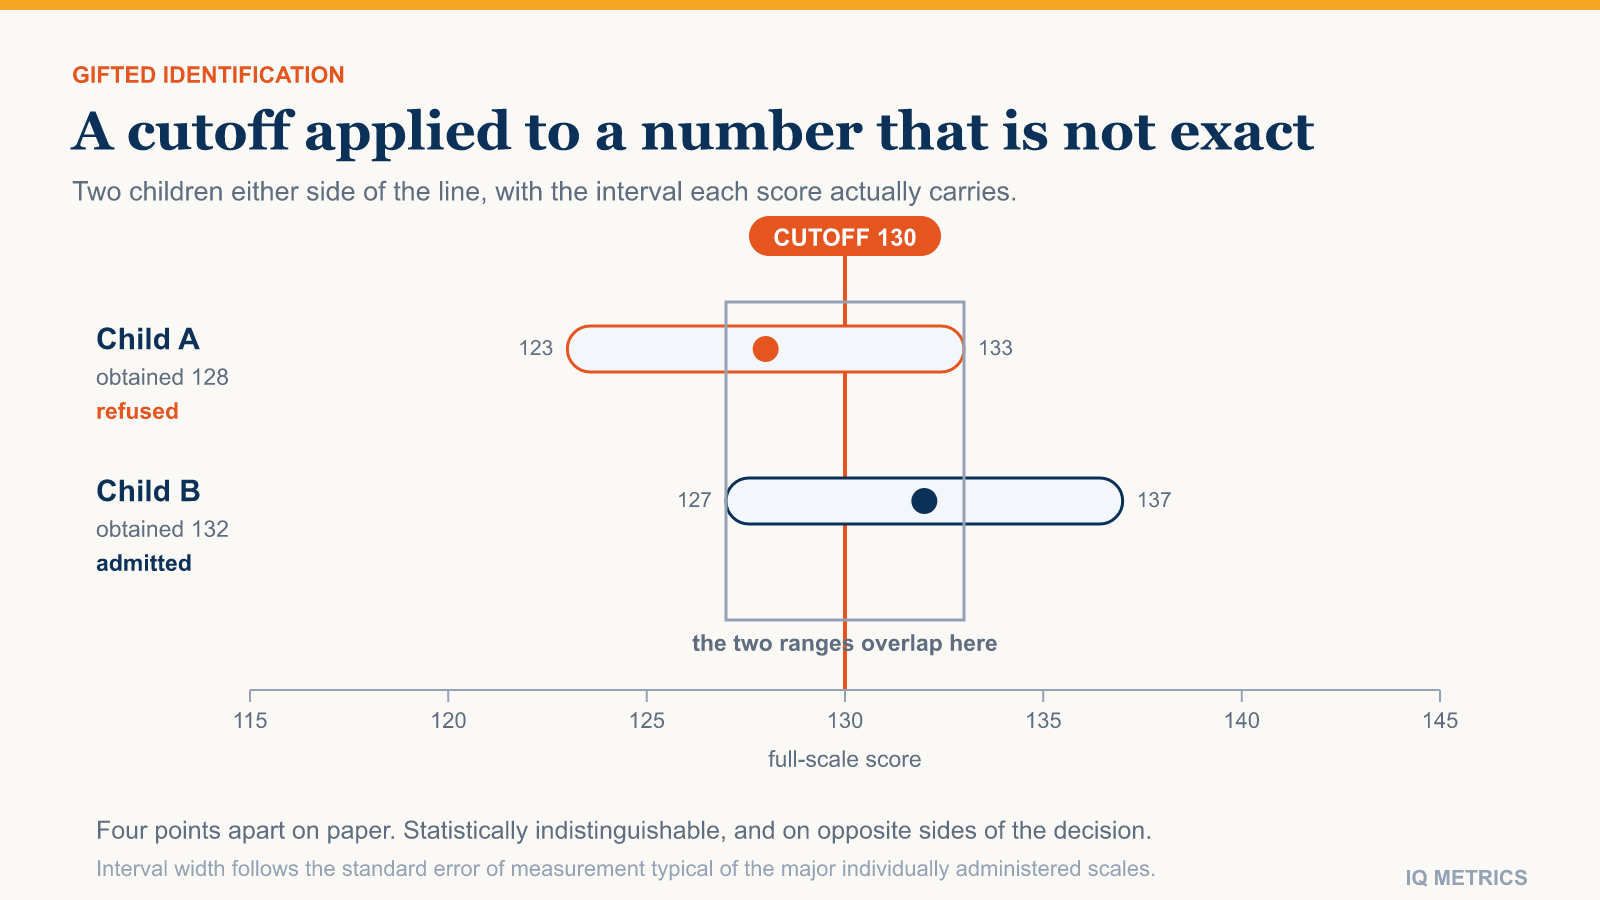
Work through what that does to a cutoff. A child who obtains 128 has a plausible range running from roughly 123 to 133. A child who obtains 132 has a range from roughly 127 to 137. Those ranges overlap across most of their width. The two children are not meaningfully different on the thing the test estimates, and yet a strict cutoff admits one and refuses the other.
The same arithmetic explains why retesting produces so many reversals. A child who scores 127 in March and 133 in October has not become more able; a second draw from the same distribution came out differently, which is what the interval was warning about. Reading an interval correctly is the single most useful skill for anyone handling one of these reports, and it is covered in how to read an IQ test report.
National norms against local norms
A standard score compares a child to a nationally representative sample. For deciding whether that child needs a different level of instruction than their classmates are getting, the relevant comparison is often the classmates.
The two diverge sharply in schools whose intake is not representative. In a high-achieving school, a large fraction of pupils may clear a national cutoff, so the cutoff stops discriminating and the programme becomes oversubscribed. In a school serving a disadvantaged catchment, almost nobody clears it, so a child who is dramatically ahead of everyone around them and plainly under-challenged is not identified — the label is reporting the catchment rather than the child.
Local norms address this by ranking within the school. They are not a softer standard; they answer a different and more relevant question, namely whether this child is being taught at the right level given the class they are actually in. The two criteria are best used together.
Where would your own score land?
Take the IIF-certified assessment and get your score with the scale it was measured on, the percentile it corresponds to and the confidence range around it — the three figures most online tests leave out.
The bigger leak: who gets tested at all
Measurement error and norm choice both assume a test happened. In many systems, identification begins with a nomination from a teacher or a parent, and only nominated children are assessed. Every child never nominated is outside the process before any cutoff is applied.
Research on districts that switched from referral-based identification to universal screening — testing every child in a given year group rather than waiting for a nomination — has found substantial increases in the number of children identified from groups that were previously underrepresented, including children from low-income households and those whose first language is not the language of instruction. The children were there; the referral step was not finding them.
This is the largest of the three effects and the easiest to fix, and it is worth being precise about what it shows. It is not a claim that the test was biased against those children. It is a claim that the step before the test decided who would be measured, and that step was not neutral. The instructions given around an assessment can matter as much as the assessment, a theme that also runs through stereotype threat.
The children a cutoff is worst at finding
Two groups are missed so consistently that the pattern is a known feature of the system rather than an accident of any one district.
The first is children whose ability and difficulty coexist — a strong reasoner who is also dyslexic, has attention difficulties, or is autistic. A full-scale score is an average across indexes, and averaging a very high reasoning index with a much lower processing speed or working memory index produces a middling composite that describes neither. The composite is the number the cutoff reads, so the child is refused on the strength of a figure that no clinician would treat as meaningful. Where the index scores are far apart, the full-scale figure should be set aside and the profile read instead — ADHD, autism, dyslexia and IQ test scores covers what those profiles look like.
The second is children still acquiring the language of the test. Verbal subtests measure vocabulary and verbal reasoning in a specific language, and a child two years into learning it will score below their reasoning ability on those subtests and much closer to it on the non-verbal ones. Averaging the two produces a composite that mostly reports language exposure. The gap between the two kinds of subtest is set out in verbal and non-verbal IQ scores.
In both cases the test is doing what it was built to do. The failure is in reducing its output to one number and comparing that number to a line.
What a parent can reasonably do with this
None of this means the score is worthless. It means a single number compared against a single line is a weak decision rule built on top of a reasonable measurement.
- Ask for the interval, not the number. A proper report gives one. If a decision rests on a point estimate a few points from the line, the interval is the relevant fact.
- Ask what the comparison group was. National norms and local norms answer different questions, and which one was used should be stated rather than inferred.
- Ask whether screening is universal. If identification depends on nomination, then not being nominated is not evidence about a child.
- Treat one session as one session. Attention, sleep and rapport with the examiner all move a result, which is why the same child produces different numbers on different days.
The useful question is not whether a child crosses a line. It is whether they are being taught at a level that fits them, which a score can inform and cannot settle. For what the high end of the scale does and does not mean, see what is genius IQ level; for how age affects the interpretation of a childhood score, see what age is most accurate to take an IQ test.
Keep reading
 Scores & Scales
How to Read an IQ Test Report
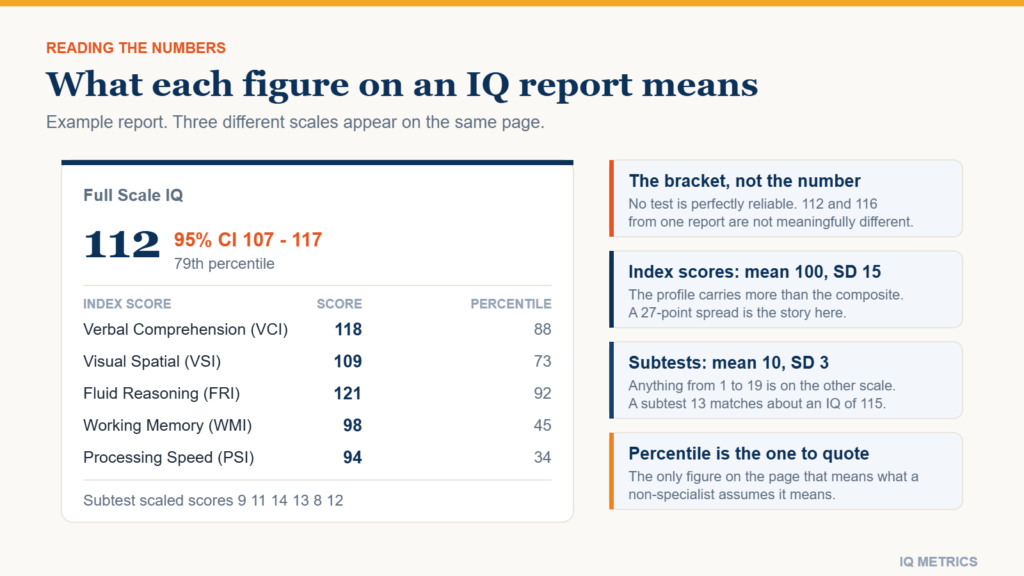
An IQ report puts numbers on at least three different scales and almost never explains which of them matters. Here is what FSIQ, the index scores, the subtest scaled scores, the percentile rank and that bracketed range each mean, and when the headline number should not be read at all.
 Taking a Test
Stereotype Threat and Test Scores
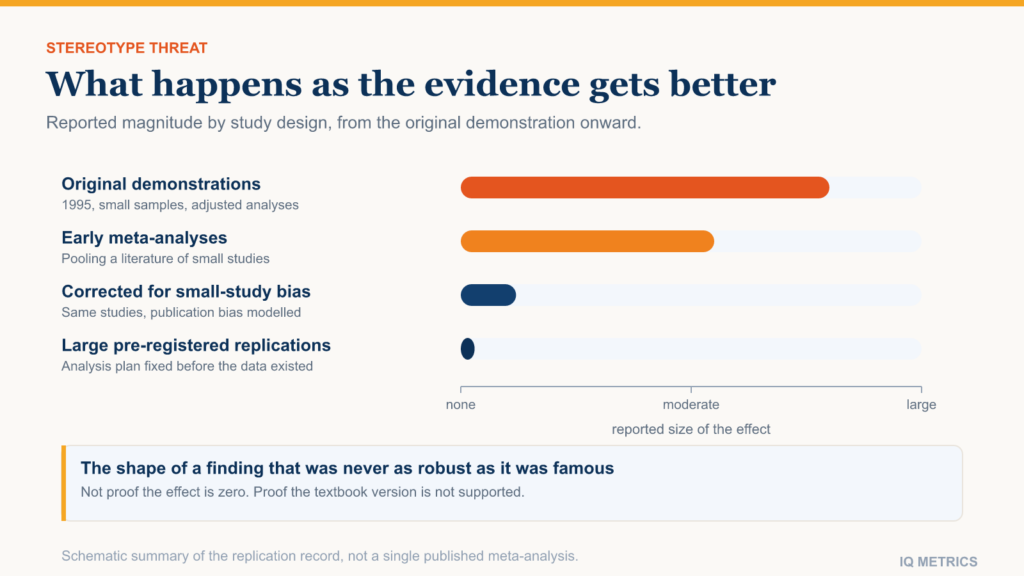
Few findings in psychology have been cited as widely, or held up as poorly, as stereotype threat. The original experiments were elegant and the idea is intuitive. Two decades of replication attempts have left a much smaller and more uncertain effect than the textbook version suggests.
 Scores & Scales
What Is Genius IQ Level
It is highly recommended that you seek out the assistance of a psychologist or educational specialist who can boost your IQ to the level of a genius