IQ Metrics
IIF Certified Assessment Start IQ Test
IIF Certified Assessment

Does IQ Predict School Success?

Research & Evidence

Does IQ Predict School Success? What Fifty Years of Data Show

IQ predicts school achievement better than any other single measure psychologists have found, and still leaves roughly three-quarters of the variation unexplained. Both halves of that sentence get ignored by somebody. Here are the actual correlations, what they mean for one child, and what accounts for the rest.
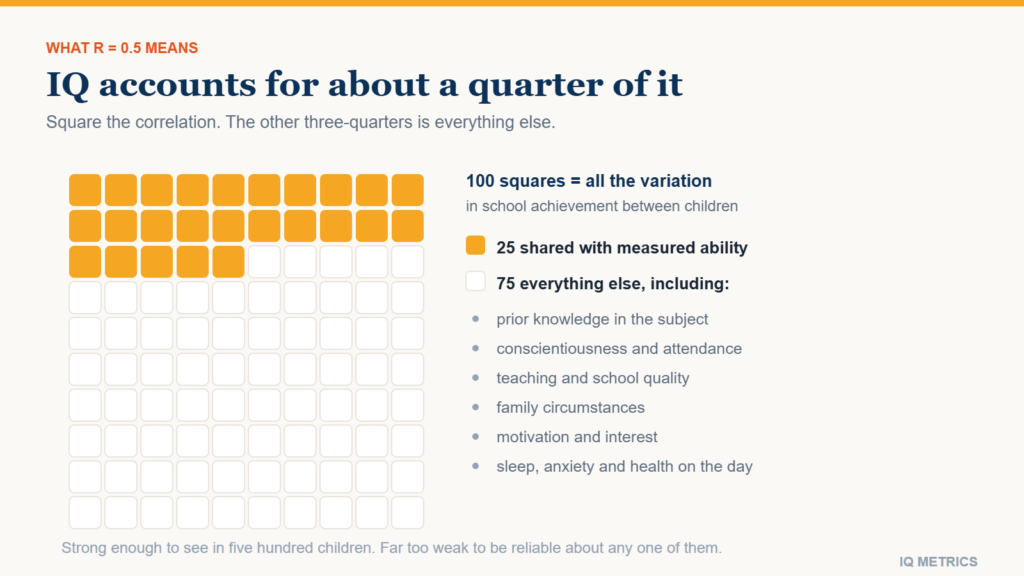
Chart showing that a correlation of 0.5 between IQ and school achievement accounts for about 25 per cent of the variation, with the remaining 75 per cent attributed to prior knowledge, conscientiousness, motivation, teaching quality and circumstance

IQ predicts school success better than any other single measure psychologists have found, and it still leaves most of the variation unexplained. Correlations between cognitive ability scores and school achievement usually land around 0.5, sometimes as high as 0.7 for standardised achievement tests in younger samples. That is a strong result by the standards of social science. It also means roughly three-quarters of the differences between children are about something else.

Almost every argument about testing in schools comes from taking one half of that sentence and dropping the other. Advocates quote the strength of the correlation to justify selecting children by it; critics quote the unexplained remainder to argue the measure is worthless. Both are reading a real number as though it answered a question it does not address.

What a correlation of 0.5 actually means

Square it. A correlation of 0.5 corresponds to about 25 per cent of the variance in the outcome being statistically associated with the predictor. Three-quarters is not.

Concretely: among children with the same IQ score, school achievement still varies enormously. The relationship is strong enough to be visible in a group of five hundred and far too weak to be reliable about any one of them. This is the single most common misreading of the literature — treating a solid group-level correlation as an individual-level forecast.
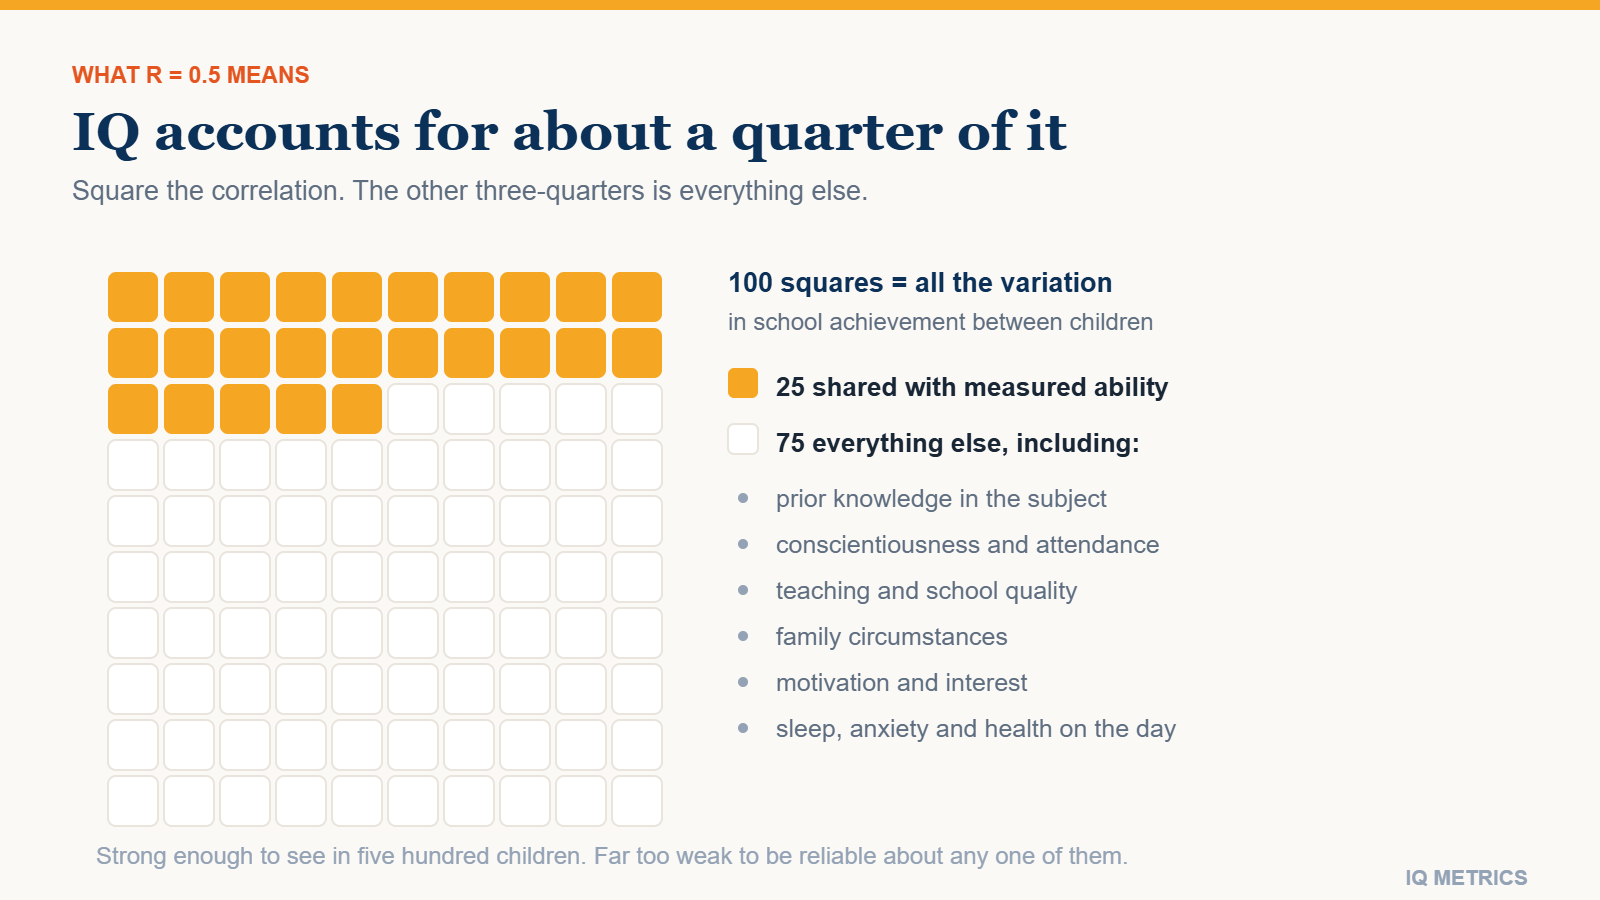
Chart showing that a correlation of 0.5 between IQ and school achievement accounts for about 25 per cent of the variation, with the remaining 75 per cent attributed to prior knowledge, conscientiousness, motivation, teaching quality and circumstance

The numbers, outcome by outcome

The correlation is not one figure. It depends heavily on what is being predicted.

  • Standardised achievement tests: about 0.5 to 0.7. The strongest relationship, and unsurprising — achievement tests and ability tests share format, timing and reasoning demands.
  • School grades: about 0.4 to 0.5. Consistently lower, for reasons worth a section of their own.
  • Years of education completed: around 0.5. Reasonably strong, but heavily entangled with family circumstances.
  • Performance within a selective university: weak. Once a group has been filtered on ability, the remaining range is narrow and the correlation shrinks accordingly.

Age matters too, and in a direction that surprises people. The correlation between measured ability and achievement tends to be strongest in the primary years and to weaken through secondary school and beyond. Part of that is restriction of range as cohorts get filtered; part is that accumulated subject knowledge, study habit and choice of subject increasingly dominate as the material gets more specialised. A reasoning test predicts best when there is least to have already learned.

That last point is restriction of range, and it explains a great deal of apparently contradictory research. A predictor always looks weaker inside an already-selected group. The same effect appears when cognitive tests are used in hiring, where the candidate pool has usually been screened already.

Why grades track IQ less closely than test scores

A grade is not a measurement of what a student knows. It is a composite of what they know, whether they handed it in, whether they attended, how they behaved, and a teacher’s judgment of all of that.

The best-known study on this point followed eighth-graders and found that a measure of self-discipline outpredicted IQ for report card grades by a substantial margin — while IQ remained the better predictor of standardised achievement test scores in the same children. Both findings are in the same paper, and quoting either one alone misrepresents it. Conscientiousness wins where sustained daily compliance is measured; ability wins where a single unfamiliar reasoning task is measured.

What accounts for the other three-quarters

  • Prior knowledge. The strongest predictor of learning something new is usually how much of the surrounding subject you already know.
  • Conscientiousness and self-discipline. Homework completion, attendance, deadline behaviour.
  • Teaching and school quality. Large effects, unevenly distributed.
  • Family circumstances. Books, quiet space, illness, stability, adult time.
  • Motivation and interest. Also partly a consequence of earlier success, which makes the causal arrows circular.
  • Test conditions on the day. Sleep, anxiety and illness all move scores, as the evidence on test anxiety shows.

A word on grit specifically, since it is often offered as the answer. Meta-analytic work suggests grit is largely a relabelling of conscientiousness and adds modest incremental prediction of academic performance beyond it. The broader point survives; the specific construct is weaker than its popularity implies.

Your own number

Where would your own score land?

Take the IIF-certified assessment and get your score with the scale it was measured on, the percentile it corresponds to and the confidence range around it — the three figures most online tests leave out.

Find your IQ score now!

Secure & encryptedInstant results10–20 minutes

The confound that will not go away

Socioeconomic status correlates with measured ability and with school achievement independently, which makes every simple comparison ambiguous. A family with more resources supplies more books, quieter study space, better nutrition, more adult conversation, less disruption from moving house or illness, and more experience of the conventions a test is written in. All of that raises the score and the achievement at once.

Studies control for it statistically, and controlling is not the same as removing it. The variables available in a dataset — parental income, parental education, an area deprivation index — are crude stand-ins for a diffuse advantage, so residual confounding is the norm rather than the exception. Treat any estimate of the ability-achievement link as an upper bound on the causal contribution of ability, not a measurement of it.

There is one finding worth flagging because it is frequently over-read in both directions: several studies report that the heritability of cognitive ability appears lower in more deprived environments, which would imply that circumstance constrains what ability can express. The result has replicated in some samples and failed to in others, and it should be held loosely. The wider evidence on inheritance is set out in what twin studies actually show.

Causation runs both ways

It is tempting to read all this as ability causing achievement. The arrow is not one-directional.

Natural experiments exploiting changes in compulsory schooling laws find that additional years of education raise IQ scores, with estimates commonly in the range of one to five points per year. Schooling does not merely reveal ability; it partly builds the thing the test measures. That is consistent with the twentieth century’s rising scores described in why IQ norms expire, and with the careful account of what can and cannot be changed in whether you can improve your IQ. It also sits alongside the genetic evidence rather than against it: heritability describes variation in a population under given conditions, and says nothing about how much a score would move if the conditions changed.

The practical consequence is that a low score in a child who has missed a great deal of school is not a stable trait measurement. It is a reading taken partly on the schooling. Repeating the assessment after a period of consistent attendance is not redundant — it is the only way to separate the two.

What this means for one child

Four things follow, and they are the practical payoff of everything above.

  • A single score is a snapshot with an error band. Childhood scores are less stable than adult ones, as how scores change over time sets out.
  • Extreme scores drift toward the average on retesting, for statistical reasons rather than psychological ones — regression to the mean is the mechanism.
  • A test taken in a second language, or under an unfamiliar format, measures partly those things — the practical upshot of cultural bias in IQ tests.
  • Predicting a group is not forecasting a person. A 25 per cent variance share is a headwind or a tailwind, not a destination.

What follows for schools

The prediction is good enough to be useful for allocating support and poor enough to be dangerous for allocating opportunity. Those two uses look similar and are not. Using a score to decide which children get extra reading help is a low-cost decision that is easily reversed if wrong. Using the same score to decide which children enter an academic track at eleven is a high-cost decision that is difficult to reverse and that compounds over years.

The historical case against selection by test at a fixed age was built on exactly this asymmetry rather than on the tests being meaningless, and how testing has been used in education and employment traces where that argument went.

The defensible summary

Cognitive ability is a real and useful predictor of school achievement, the best single one available, and a poor basis for deciding what any individual child will do. Those statements are consistent, and holding all three at once is the whole skill.

If you want a score read the way this article argues it should be — with its scale, its percentile and its confidence range stated rather than a bare number — that is what our IQ test reports, and the version for children is normed against age-matched peers rather than adults.

Share this article

Know someone who keeps seeing these numbers quoted without the scale they were measured on? Send it to them.

Cultural Bias in IQ Tests

Research & Evidence

Are IQ Tests Culturally Biased? What the Evidence Shows

Ask whether IQ tests are culturally biased and you get two confident, opposite answers. Both are partly right, because the word means something far narrower to a psychometrician than it does in ordinary use. Here is what the item-level evidence shows, and where culture really does get into a score.
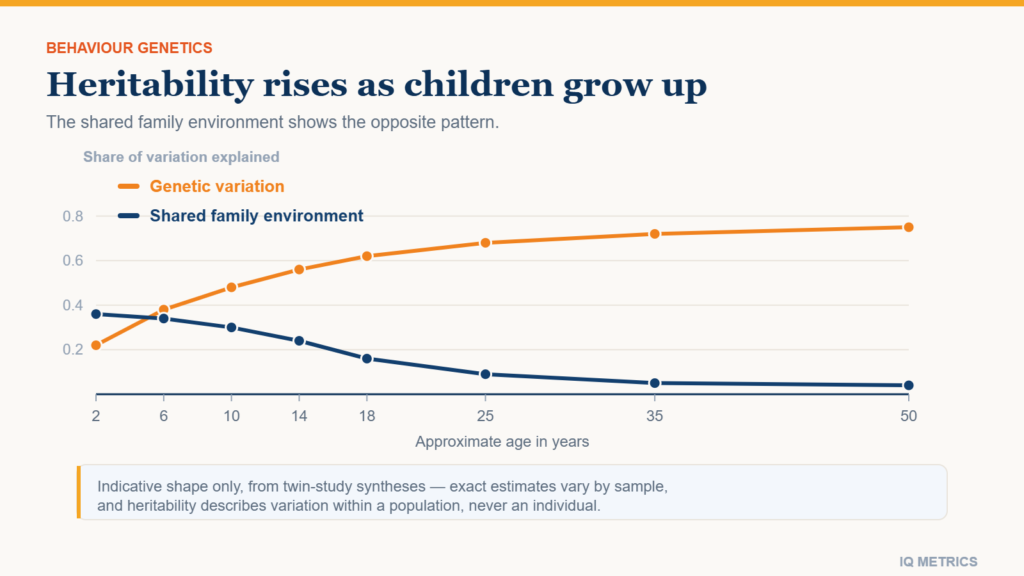
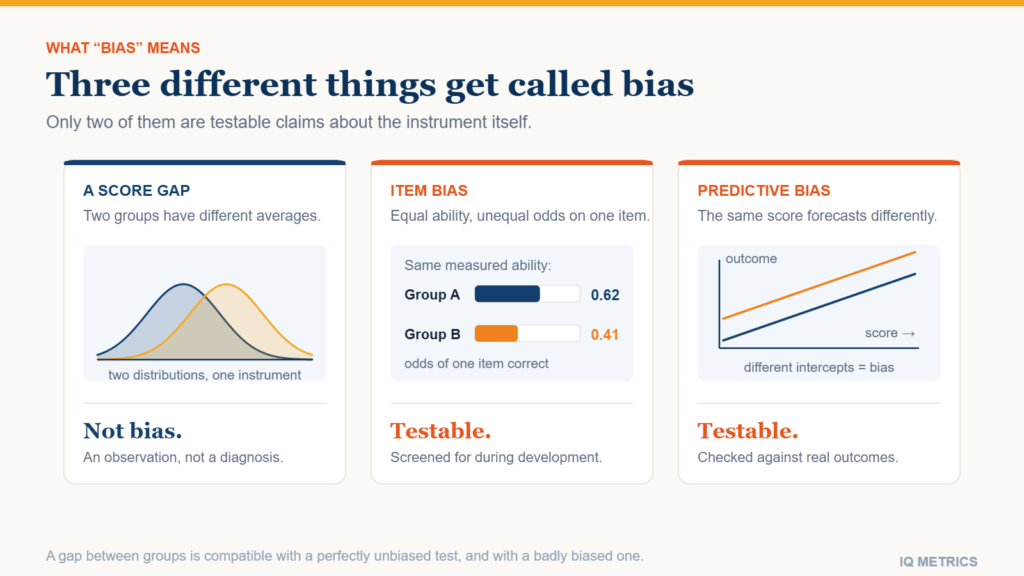
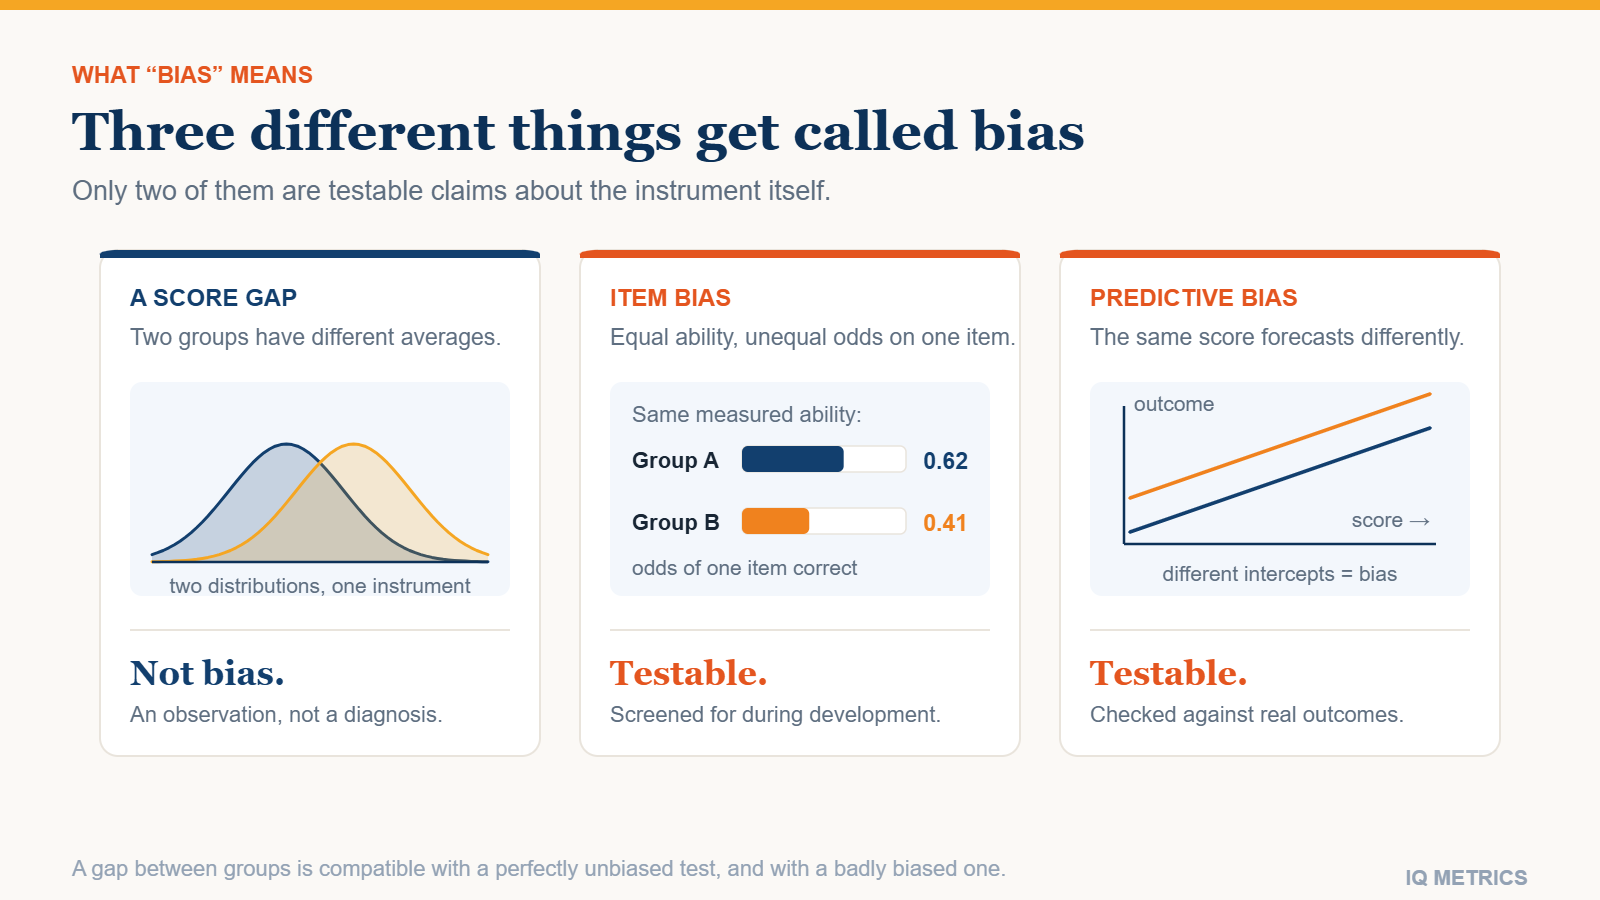
Diagram separating three things often confused under the word bias: a score gap between groups, item bias where equally able test-takers answer differently, and predictive bias where a score forecasts an outcome differently by group

Cultural bias in IQ tests is real, but it is narrower and stranger than the phrase suggests. When psychometricians test for bias in modern batteries they usually find little of it in the technical sense they mean — and that finding does almost nothing to settle the question most people are actually asking. The confusion is not carelessness on either side. The word bias has a narrow statistical meaning in test development and a broad, moral one in ordinary use, and the two answers to “are IQ tests culturally biased” are answers to two different questions.

This article separates them. First what bias means to the people who build the tests, then what their own studies find, then the four places culture genuinely does get into a score — most of which are not in the questions at all.

Three different things get called bias

Almost every argument about this topic is two people using one word for three separate claims.

  • A score gap. Two groups have different average scores. This is an observation, not an explanation. A thermometer is not biased because two cities differ.
  • Measurement bias. Two people of genuinely equal ability have different chances of getting an item right, because of something about the item other than the ability it is meant to tap. This is testable, and it is what test developers screen for.
  • Predictive bias. The same score forecasts a real-world outcome — a grade, a job rating — differently depending on which group the test-taker belongs to. Also testable, using regression slopes and intercepts.

Only the last two are bias in the technical sense. A gap on its own is compatible with a perfectly unbiased instrument, and equally compatible with a badly biased one. That is why the existence of group differences settles nothing on its own, and why national IQ rankings cannot support the conclusions drawn from them regardless of which direction the numbers point.

The regatta question, and why it was removed

The most-cited example of a culturally loaded item is real. An SAT analogy question asked test-takers to complete runner is to marathon as oarsman is to ___, with regatta as the answer. The word belongs to a leisure activity distributed very unevenly across social classes, and the item behaved exactly as you would predict. It was dropped, and analogy items were eventually dropped from the SAT altogether.

This is worth dwelling on for a reason people usually skip: the item was identified and removed by the statistical screening process. It is evidence that the screening works, not that it does not. But it also shows where the danger sits. Vocabulary and general-knowledge subtests are the most culturally loaded parts of any battery, and they are loaded by design, because they measure acquired knowledge rather than novel reasoning. That is the distinction between crystallized and fluid ability covered in our guide to how IQ tests work, and it is exactly why a verbal reasoning section cannot be culture-free even in principle.

What the item-level studies actually find

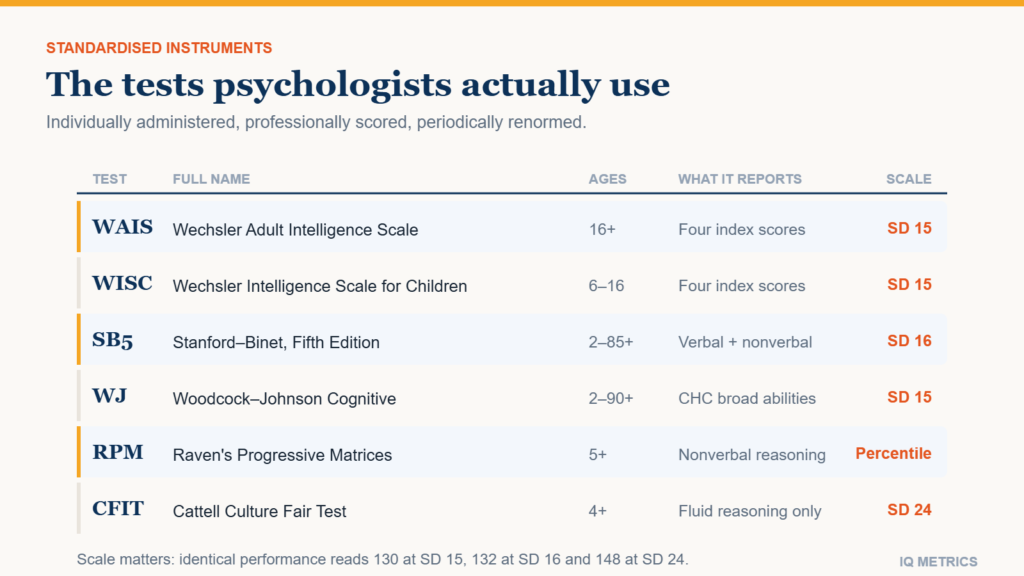
Major batteries such as the Wechsler scales and the Stanford-Binet run differential item functioning analyses during development. An item is flagged when test-takers matched on overall ability still differ in their odds of answering it correctly, and flagged items are revised or cut before publication. Expert review panels screen content separately.

The published result is consistent and, to many people, counter-intuitive: within a single country and language, residual differential item functioning in well-constructed batteries tends to be small, and measurement invariance broadly holds across major demographic groups. Reviews of predictive bias reach a similar place — where tests are validated against school or job outcomes, they generally do not under-predict performance for lower-scoring groups.

Two honest caveats belong with that finding. Invariance within a country is a much weaker claim than invariance across countries and languages, where translation, adaptation and separate norming samples make the comparison far shakier. And invariance means the test measures the same construct in the same way for everyone; it says nothing about whether the construct itself was shaped by unequal opportunity long before test day.

Diagram separating three things often confused under the word bias: a score gap between groups, item bias where equally able test-takers answer differently, and predictive bias where a score forecasts an outcome differently by group
Your own number

Where would your own score land?

Take the IIF-certified assessment and get your score with the scale it was measured on, the percentile it corresponds to and the confidence range around it — the three figures most online tests leave out.

Find your IQ score now!

Secure & encryptedInstant results10–20 minutes

Where culture actually gets into a score

If the items are largely clean, the interesting question is what is left. Four things, none of them a question on the page.

The culture of test-taking itself

Sitting alone with a stranger, working fast, guessing when unsure rather than staying silent, treating an obviously artificial puzzle as worth serious effort — these are learned conventions, and they are learned unevenly. Someone taught that admitting ignorance is more honest than guessing will lose real points on a scored-right test. Familiarity with the format is itself worth points, which is the same mechanism behind the practice effect on repeated testing.

The language of administration

A bilingual test-taker assessed in their second language is being measured partly on that language. This is the single largest and least controversial source of cultural distortion in practice, and it is why a large verbal-nonverbal split is a flag for a clinician rather than a finding — see what a gap between your verbal and non-verbal scores means.

Stereotype threat

The proposal is that awareness of a negative stereotype about your group consumes working memory during the test itself. The original laboratory demonstrations were striking. The picture since has become genuinely contested: several large replications have found much smaller effects than the early studies, and meta-analyses report evidence consistent with publication bias. The fair summary is that the mechanism is plausible and probably real in some settings, and that its size in a routine testing session is unresolved. Ordinary test anxiety, which is better established, points the same way.

The norm group your score is compared against

An IQ score is not a count of correct answers. It is a position relative to a standardisation sample, so who was in that sample is part of the measurement. A score from a sample that under-represents you is a comparison you did not consent to. This is also why the same raw performance yields different numbers on scales with different spreads, as our percentile calculator and the note on standard deviation 15 versus 16 both show.

Content bias versus construct bias

There is one more distinction worth having, because it is where the two sides of this argument genuinely disagree rather than merely talk past each other.

Content bias is an item behaving unfairly. It is what the screening catches, and modern batteries are reasonably good at it. Construct bias is a deeper claim: that the ability being measured is itself a culturally particular thing — that valuing speed over deliberation, abstraction over context, and the lone solver over the group is a set of choices about what counts as intelligent, made by a particular tradition.

Cross-cultural work gives this some support. Studies of everyday cognition have documented people performing complex practical reasoning fluently in their own setting — market arithmetic, navigation, agricultural planning — while scoring poorly on the formal-school version of the same operations. Whether that makes the test biased or simply narrow is partly a question about words. What is not in dispute is that it makes a low score, on its own, a weak claim about a person’s reasoning.

Culture-fair tests: what they fix and what they do not

The response to all this, from the 1930s onward, was to strip out language and acquired knowledge. Raven’s Progressive Matrices and the Cattell Culture Fair scales present abstract visual patterns with a rule to be found. Our own culture-fair IQ test is built on the same principle, and these instruments do remove the most obvious problem.

They do not remove culture. Reading a two-dimensional grid as a representation, scanning left-to-right and top-to-bottom, accepting that an abstract puzzle has exactly one defensible answer — all of these are schooled habits. The decisive evidence is the Flynn effect: across the twentieth century the largest score gains were on Raven’s-type tests, the ones designed to be culture-free. Whatever changed in those decades, it was not the human genome. A test that gains twenty points in fifty years is exquisitely sensitive to environment, which is the opposite of culture-free. Our note on why IQ norms expire covers what happened next.

What to do with your own score

None of this makes a score meaningless. It makes it a measurement with conditions attached, which is what every measurement is. Three habits follow.

  • Read the confidence interval, not the point. A single number hides a band of several points either side, as test accuracy and error explains.
  • Ask what the score is being used for. Prediction of school achievement is well evidenced; ranking human worth is not a use the instrument supports, and what a score predicts about school is narrower than most people expect.
  • Treat a low score in an unfamiliar language or format as uninformative until it is repeated under better conditions.

The short answer to the question in the title: modern tests are far less biased at the item level than their critics assume, and far less culture-free than their defenders imply. Both halves of that sentence are load-bearing.

Share this article

Know someone who keeps seeing these numbers quoted without the scale they were measured on? Send it to them.

Verbal vs Non-Verbal IQ Scores

Scores & Scales

When One Half of Your IQ Score Is 15 Points Higher Than the Other

Two people can hold the same IQ number and have completely different profiles, and a split between the verbal and non-verbal indexes is far commoner than most test-takers expect. Here is what base-rate tables and compounding measurement error say about how large a gap has to be before it means anything.

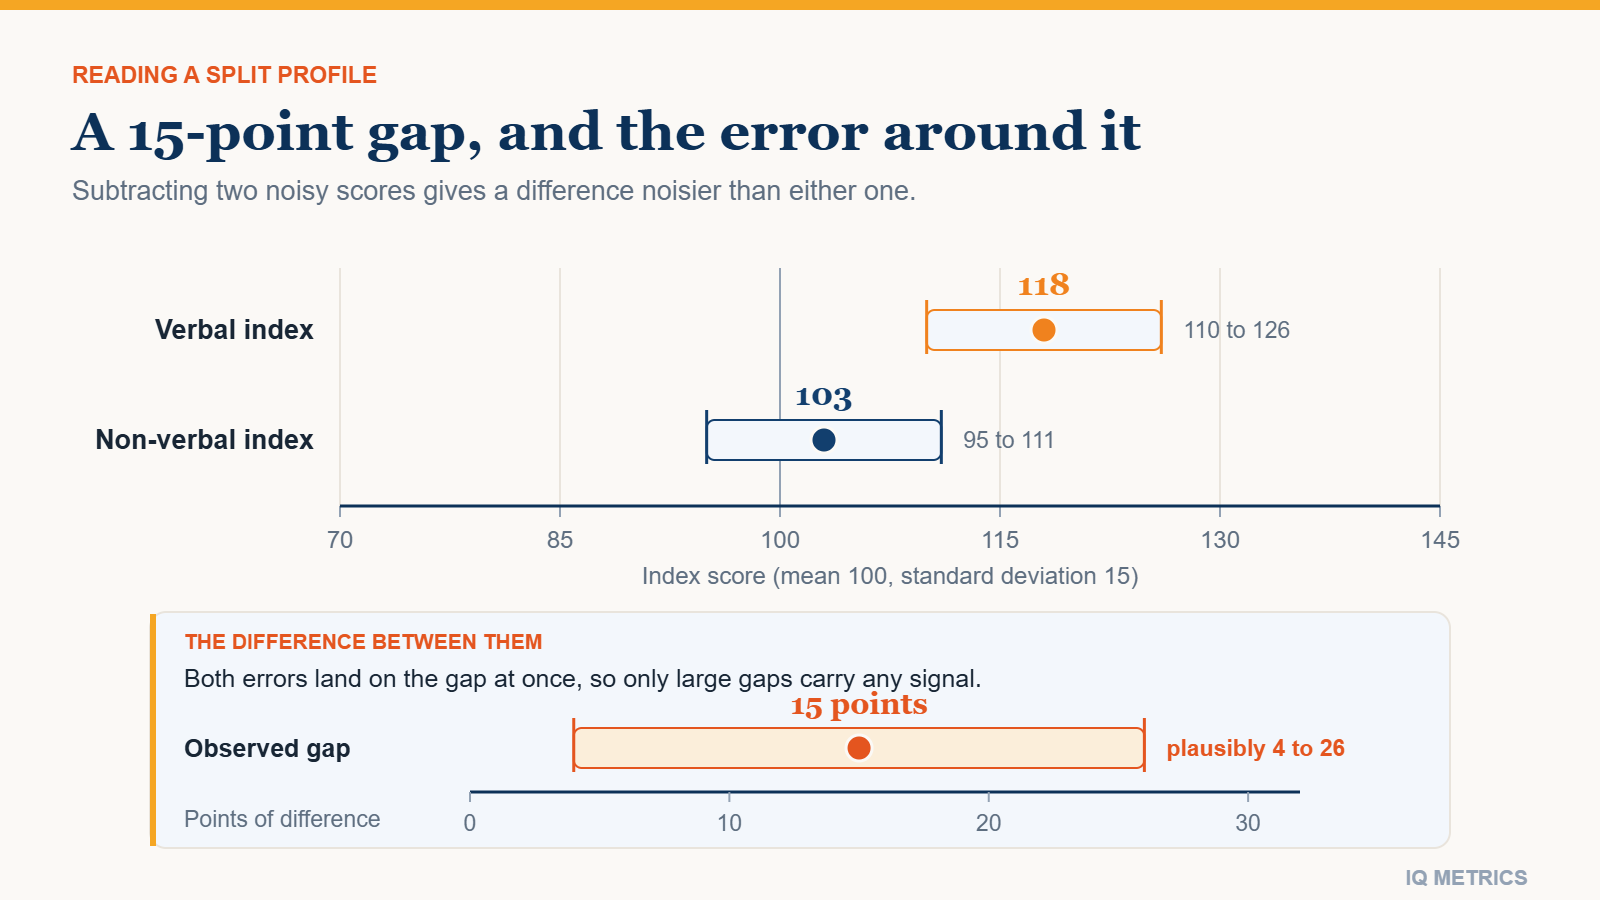
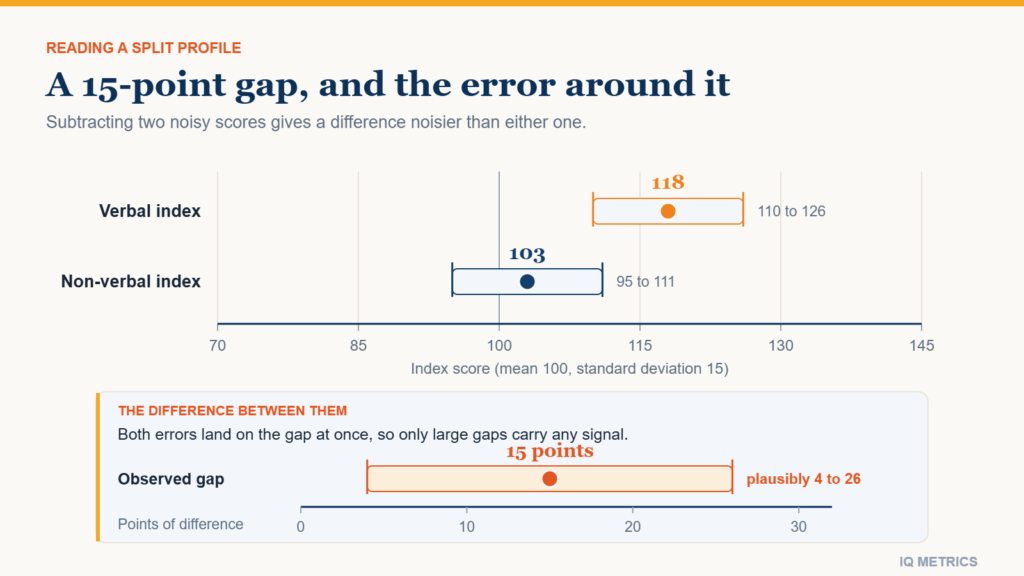
Chart showing a verbal index of 118 and a non-verbal index of 103, each with its measurement error band, and the 15-point gap between them carrying a much wider band of roughly 4 to 26 points

A gap between your verbal and your non-verbal scores is far more common than most people assume. Published base-rate tables from the major batteries show index splits of 10 to 15 points turning up in a substantial minority of the standardisation sample, so a verbal vs non-verbal IQ score difference of that size is usually unremarkable. The useful question is not whether you have a split, but whether yours is big enough to survive the measurement error sitting on both sides of the subtraction.

One number is an average, and averages destroy shape

A full-scale score is a weighted average of several index scores, and averaging is a lossy operation. Two people can arrive at the same 112 by completely different routes: one of them even across every domain, the other with a strong verbal index dragging a weaker visual-spatial one up to the mean. The composite is identical; the profiles are not.

That is why psychologists read the indexes before the total, and sometimes decline to interpret the total at all when the indexes disagree sharply. If the parts of a measure point in different directions, their average summarises something that does not really exist as a single quantity.

The two directions a split can run

Index score discrepancies are not symmetrical in what they suggest. A verbal score sitting above a non-verbal one keeps different company from the reverse pattern, and neither is a diagnosis. Treat the two shapes described here as typical associations, nothing stronger.

Chart showing a verbal index of 118 and a non-verbal index of 103, each with its measurement error band, and the 15-point gap between them carrying a much wider band of roughly 4 to 26 points

Verbal sitting above non-verbal

This shape is common in people with long formal education, heavy reading habits and verbally loaded work: teaching, law, journalism, anything whose day is made of words. Vocabulary and general knowledge keep accumulating with exposure, while timed matrix and pattern tasks do not reward exposure in the same way, so the pattern tends to flatter older test-takers.

That asymmetry between accumulated knowledge and reasoning on the spot has a standard name in the literature, and how IQ tests are built and scored sets it out. The point here is only that a verbal edge is often a record of practice rather than a difference in raw horsepower.

Non-verbal sitting above verbal

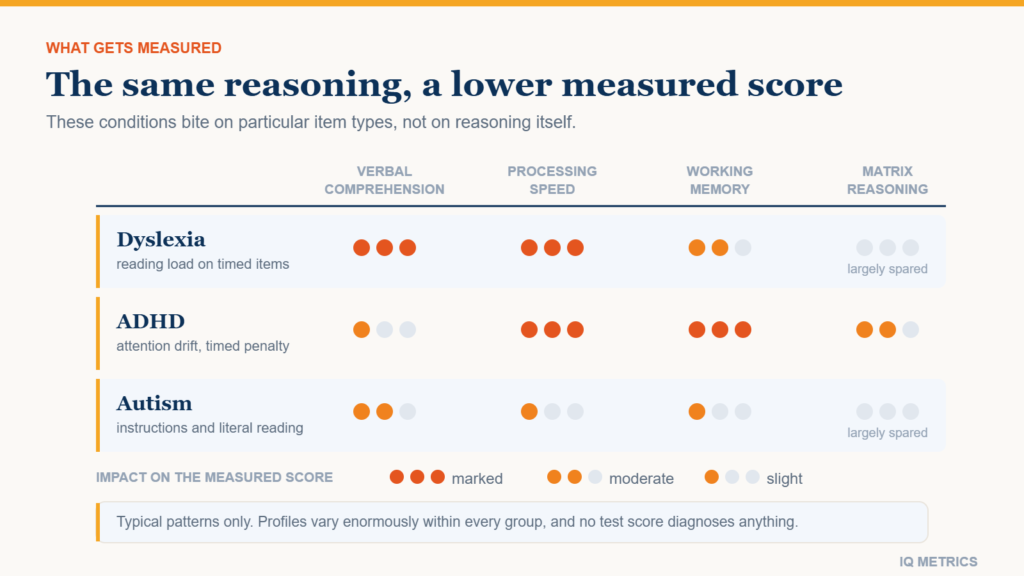
The reverse split is common among people testing in a second language, people whose schooling was interrupted or happened in a different system, and younger adults, who have simply had fewer years to accumulate the vocabulary and general knowledge the verbal side rewards. Reading and language difficulties can also hold down verbally loaded scores without that implying a matching limit on reasoning, which is a clinical question rather than a scoring one and is handled in the piece on ADHD, autism, dyslexia and test scores.

Language load is the obvious confound in this direction, and batteries differ in how much of it they carry; those differences are compared in the guide to professionally administered IQ tests.

How big does a gap have to be before it is signal?

Two things have to hold before a split is worth interpreting. It has to be unusual relative to the population, and it has to be larger than the combined error of the two measurements that produced it. Most of the gaps people worry about fail both tests.

Base rates: lopsided profiles are ordinary

Test manuals publish base-rate tables showing how often each size of index difference occurred in the standardisation sample. The consistent finding is that double-digit splits are common among entirely typical people: published tables put differences of roughly 10 to 15 points in a substantial minority of the sample. The exact percentage depends on the battery and on which pair of indexes you are comparing, so treat any single figure you see quoted as specific to one test rather than universal.

The practical consequence is deflating. A 12-point split is not a finding. Differences of that order turn up often enough in the standardisation samples that seeing one tells you almost nothing about the person holding the score. Gaps only start to look genuinely uncommon well beyond the double-digit range, and where that line sits is decided by the table for that specific index pair on that specific battery, not by any single number that carries across tests.

Why subtracting two noisy numbers widens the error

Every score carries measurement error. A well-built battery with a reliability near 0.90 has a standard error of measurement of roughly 4 to 5 points, which is why a score of 115 is honestly reported as a roughly 95 per cent band of about 106 to 124 rather than as a single point; that arithmetic is worked through in the piece on how accurate IQ tests really are. Index scores rest on fewer items than the full scale, so their bands are if anything a little wider than that.

Now subtract one of those bands from another. Uncertainties do not cancel when you take a difference, they accumulate: the gap between two index scores is a noisier quantity than either index on its own, so its error band is wider than the band on either score you started with. Two errors of 4 to 5 points combine into an error on the difference of roughly 6 to 7 points, which puts a band of something like 12 or 13 points either side of any gap you measure. A difference has to clear a higher bar than a score does before it can be told apart from zero.

Said plainly: if each of two scores can land several points either side of your true standing, a gap of 8 or 10 points between them can be manufactured by nothing more than which day you sat down. Small splits are usually not small effects but no effect at all, which is why a modest gap so often shrinks or flips direction on a retest.

Your own number

Where would your own score land?

Take the IIF-certified assessment and get your score with the scale it was measured on, the percentile it corresponds to and the confidence range around it — the three figures most online tests leave out.

Find your IQ score now!

Secure & encryptedInstant results10–20 minutes

Subtest scatter is even weaker evidence

Once a split appears, the temptation is to go one level deeper and interpret individual subtests: strong on one, weak on another, therefore a profile. Resist that. Subtests are shorter than indexes, shorter means less reliable, and less reliable means the scatter across them is noisier still.

Decades of research on interpreting individual subtest peaks and troughs have been unkind to the practice. Index-level differences are the smallest unit worth taking seriously, and only when they clear both the base-rate hurdle and the error hurdle. Keep constructs separate too: a weak memory-loaded score is not the same evidence as a weak reasoning score.

What a real discrepancy actually licenses you to conclude

Suppose your split profile clears every hurdle: large, rare in the base-rate table, and still there on a second sitting. What have you learned? A hypothesis about how you learned and where you are practised — not a second IQ, and not a diagnosis.

  • It is descriptive, not causal. A high verbal index says the vocabulary and verbal reasoning are there. It does not say whether they came from schooling, reading, work or something else entirely.
  • It is not a ceiling on the weaker side. Index scores move with familiarity and practice, and retest gains are usually larger on the non-verbal side than on the verbal one.
  • It is not a label. Score patterns are consistent with many explanations and specific to none; a diagnosis needs history, observation and criteria that no test result supplies.
  • It is not a career instruction. The link between profile shape and occupational outcomes is far too loose to guide an individual decision.

The honest use of a split is narrower. It tells you which kind of task you are likely to find comparatively effortful, which is worth knowing when you decide how much preparation an exam or an aptitude screen deserves.

How to read your own rough profile

Breaking the composite apart is the only way to see shape, and a few rules keep the exercise honest.

  • Sit the domains separately: the verbal reasoning test, the spatial reasoning test and the numerical reasoning test, ideally on different days, so that fatigue does not manufacture a gap for you.
  • Convert every result to a percentile first. Different tests are not marked on the same ruler, and percentiles are the closest thing to a common currency.
  • Compare the percentiles, not the raw scores. If your two most extreme domains land within about ten percentile points of each other, treat the profile as flat — flat is the normal answer, and anything wider still has to clear both hurdles above before it means anything.
  • Re-sit your two most extreme domains once. A gap that survives a repeat is worth thinking about; a gap that moves was noise wearing a costume.

One caution about self-administered results: unsupervised tests vary in quality and in how carefully they were normed, so a split measured across two different tests carries all the error above plus the gap between two norming samples. Comparing within one family of tests is safer.

Where to start if your number feels uneven

If you are holding one score and a suspicion that it does not describe you evenly, the cheapest next step is to take it apart rather than to take it again. Sit the domains one at a time, run each result through the IQ percentile calculator, and look at the shape instead of the total.

Most people find their profile is flatter than they expected, and that is the good outcome: a flat profile means the composite you already have is doing its job. A large, repeatable split is rarer, and even then it describes where your practice has gone rather than what you can learn next.

Share this article

Know someone who keeps seeing these numbers quoted without the scale they were measured on? Send it to them.

Test Anxiety and IQ Scores

Mind & Everyday Life

How Many IQ Points Does Test Anxiety Actually Cost?

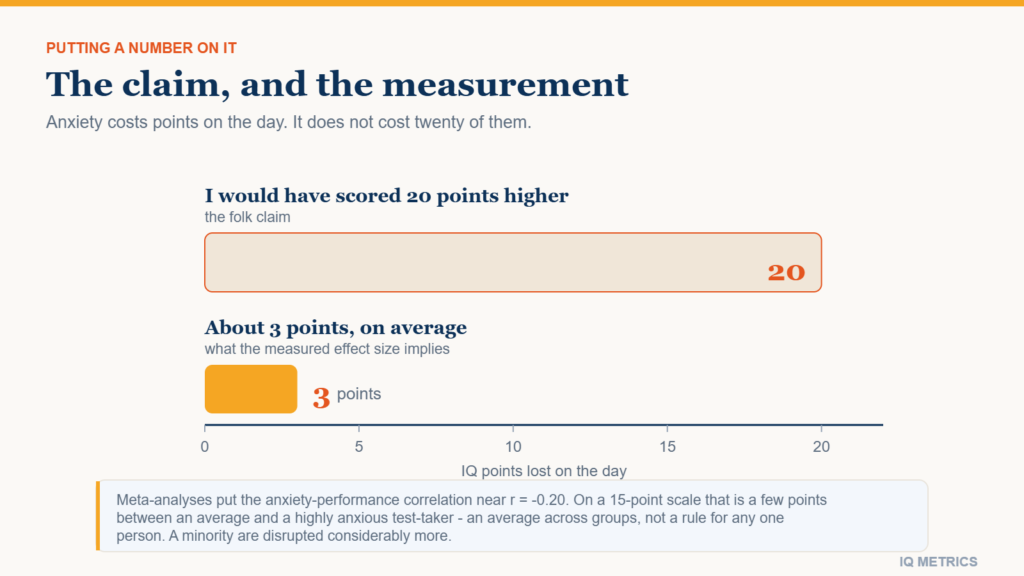
Almost everyone who has had a disappointing result has wondered whether nerves cost them fifteen or twenty points. The evidence says no. Test anxiety and cognitive performance correlate at roughly r = -0.20, which works out to a few points on a 15-point scale. Here is the number, and what it changes.

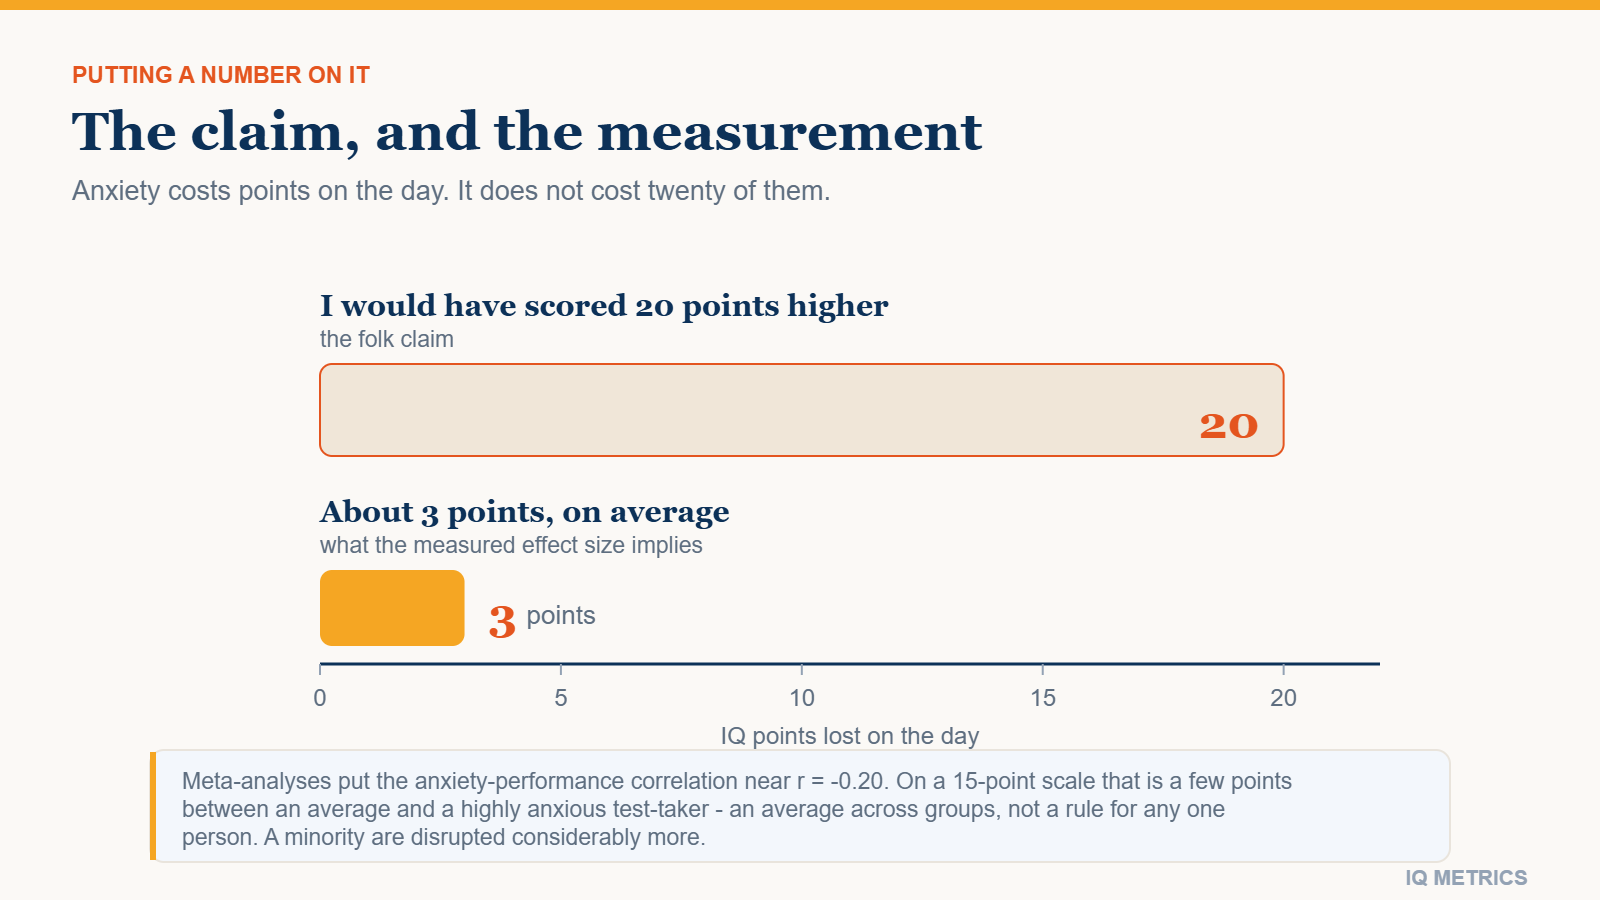
Bar chart comparing the twenty-point loss people claim test anxiety costs with the roughly three points the measured effect size implies

Can anxiety lower your IQ score? Yes — but not by anything close to the margin most people assume. Studies that measure test anxiety alongside cognitive test performance find a relationship of roughly r = -0.20, which translates to something on the order of three points on the familiar 15-point scale. That is a few points between an average test-taker and a highly anxious one, not fifteen and not twenty. The rest of this article shows where that figure comes from, why the effect is small but genuinely real, and what it should change about how you read your own result.

Where the fifteen-point claim comes from

Nearly everyone who has sat a supervised test has said some version of it: I would have scored fifteen or twenty points higher if I had not been so nervous. The thought is appealing because it explains away a disappointing number without asking anything of the person who got it.

The problem is scale. Fifteen points is a full standard deviation — the distance between the middle of the distribution and the edge of roughly the top sixteen percent of test-takers. Ordinary pre-test nerves do not move a person that far. Nothing in the measured relationship between test anxiety and test performance is anywhere near large enough to produce a shift of that size.

What the evidence does support is a smaller, stubborn, fairly consistent drag. Small effects are still real effects. They are just not the ones that rewrite a life story.

What the research actually finds

Meta-analyses pooling many studies of test anxiety and performance on cognitive and academic tests tend to land on a correlation in the region of r = -0.20. Much of that literature is built on school and university assessments rather than on standardised intelligence tests, so carrying the figure across to IQ points is a reasonable estimate rather than a direct measurement. Estimates range roughly from -0.15 to -0.25, and much of that spread is not noise: it moves with who was sampled, how anxiety was measured, and how much the test genuinely mattered to the person sitting it.

Bar chart comparing the twenty-point loss people claim test anxiety costs with the roughly three points the measured effect size implies

Three things push the estimate around, and they are worth knowing before you take any single figure too seriously:

  • How anxiety was measured. Questionnaires filled in after the test pick up disappointment as well as anxiety. Physiological measures of arousal track performance more weakly than self-reported worry does, so the method chosen moves the estimate before any real difference does.
  • How high the stakes were. A university entrance exam tends to generate more anxiety, and a larger measured effect, than a practice test taken at home out of curiosity.
  • Who was in the sample. Student samples dominate this literature, and students are not a random slice of the population, which limits how far any one estimate travels.

A correlation of -0.20 means anxiety is associated with something like four percent of the variation in scores across a group. The other ninety-six percent of the differences between people sits somewhere else entirely. That is the frame to hold before anyone converts anything into points.

Turning that correlation into IQ points

Correlations are hard to feel; points are easy. So here is the translation, with the reasoning shown, precisely so you can see how approximate it is.

Most IQ scales are built with a standard deviation of 15 points. If anxiety and score are related at about -0.20, a person one standard deviation above average in test anxiety is expected to score roughly 0.20 × 15, or about 3 points, below a person of average anxiety. Nothing in that figure is held constant: it is a raw association, not an isolated effect of anxiety. Push it to two standard deviations above the mean in test anxiety, which is uncommon, and the expected gap is around six points — though the linear assumption behind that extrapolation is doing a lot of work out at the tail.

So the honest headline is a few points, not twenty. Every word there is doing work. It is an average across groups, not a prediction about any one person, and it applies to people whose anxiety slows them down rather than stopping them. For the minority who freeze or leave a test unfinished, the loss can be far larger, because what they end up with is not a measure of their ability at all.

Your own number

Where would your own score land?

Take the IIF-certified assessment and get your score with the scale it was measured on, the percentile it corresponds to and the confidence range around it — the three figures most online tests leave out.

Find your IQ score now!

Secure & encryptedInstant results10–20 minutes

Why the cost is real but small

The best-supported explanation is crowding. Working memory — the small, temporary workspace where you hold a matrix pattern, a half-finished sequence, or the three candidate answers you are weighing against each other — has a hard capacity limit. Worry is not silent: it occupies that same workspace with self-monitoring, clock-watching and a running commentary on how badly things are going.

That account makes a prediction that can be checked, and it broadly holds up. The cost concentrates on items that load working memory heavily and on tests run against a clock, which is one reason a timed IQ test is likelier to expose anxiety than an untimed one. On easy items, or when you can take as long as you like, there is spare capacity to absorb the interference.

This is the same mechanism driven by a different stressor as the one behind sleep loss and test performance. Fatigue and worry both draw down the same limited resource, and both produce modest average losses concentrated in the same kinds of items. Read that piece as the companion to this one.

There is a trait side to all of this too — some people are dispositionally more anxious, and that disposition travels with a cluster of habits around testing. Rather than re-derive it here, see how personality relates to measured ability.

Anxious test-takers also behave differently

The raw observed gap between anxious and non-anxious test-takers is not purely anxiety pressing on cognition in the moment. Anxious people also do different things, and those things land in the score just as surely.

  • They prepare differently. Avoidance is a normal anxiety response, so some anxious test-takers do less familiarisation rather than more, and arrive facing a format they have never seen.
  • They start slower. Time spent re-reading the instructions and second-guessing item one is time not spent on items twelve through twenty.
  • They abandon hard items sooner. Giving up early is a behaviour, not a capacity limit — but on a scored test it looks identical to being unable to solve the item.
  • They are likelier to quit part-way. A test abandoned halfway does not measure ability. It measures how long the person stayed.

Each of those routes lowers a score without anxiety having interfered with reasoning directly. Which means some share of that already-modest -0.20 is behaviour rather than anxiety acting on reasoning in the moment, so the direct cognitive cost is probably smaller still. How much smaller is not something a correlation on its own can tell you.

That is better news than it sounds. Behaviour is a great deal easier to change than temperament, and the routes above are the ones a second, better-organised sitting can actually close.

What a few points should and should not change

An expected loss of around three points is a reason to consider retesting. It is not a reason to discard the result you have. If your score landed near a boundary you care about and the sitting was a genuinely rattled one, that is a legitimate argument for a second attempt.

It is worth being specific about what near a boundary means. A three-point expectation matters if your result sits a handful of points from a threshold you are using for something; it matters very little if you are twenty points away, because a calmer sitting is not going to carry you across a gap that size.

Go in knowing what a retest actually buys. Scores tend to rise on repeat testing for reasons that have nothing to do with your nerves improving: the practice effect on cognitive ability tests is well documented, so a higher second score is partly familiarity with the format and, if the first sitting was unusually low for you, partly ordinary regression toward your own average — and only partly a calmer state of mind.

It also helps to know how much any single sitting can move for perfectly mundane reasons. The guide to IQ test accuracy covers the measurement error surrounding one score. Anxiety is one contributor sitting inside a band that is wider than most people expect, and this article is only quantifying that one contributor.

What actually helps before a test

The interventions with the strongest support are unglamorous: familiarise yourself with the format, and practise under conditions that are genuinely timed. Both work for the same reason — they strip out the novelty and the surprise of time pressure that generate the anxiety in the first place, rather than trying to manage the feeling once it has already arrived.

In practice that means a full-length run with the clock genuinely running rather than a relaxed browse through sample items. The preparation guide and the walkthrough of how a test is structured cover those mechanics, so this piece will not repeat them.

None of this makes anxiety trivial. It makes it tractable. If you suspect nerves cost you something last time, the useful next step is a second run under conditions you control, with the clock running honestly. Take the IQ test that way and compare the two results, holding in mind that a few points of movement in either direction is exactly what the evidence predicts.

Share this article

Know someone who keeps seeing these numbers quoted without the scale they were measured on? Send it to them.

IQ and Creativity

Research & Evidence

Does Intelligence Stop Predicting Creativity Above IQ 120?

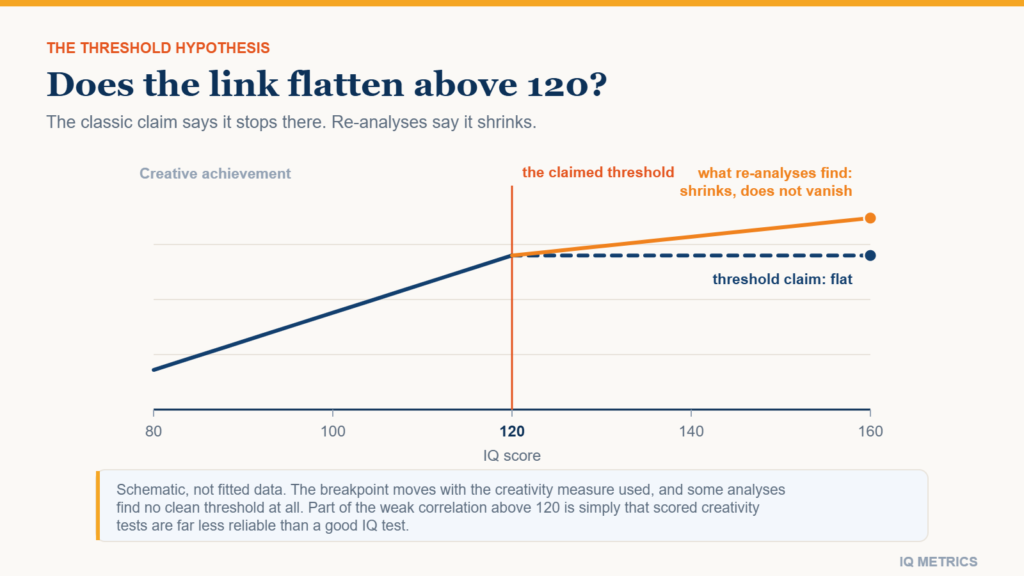
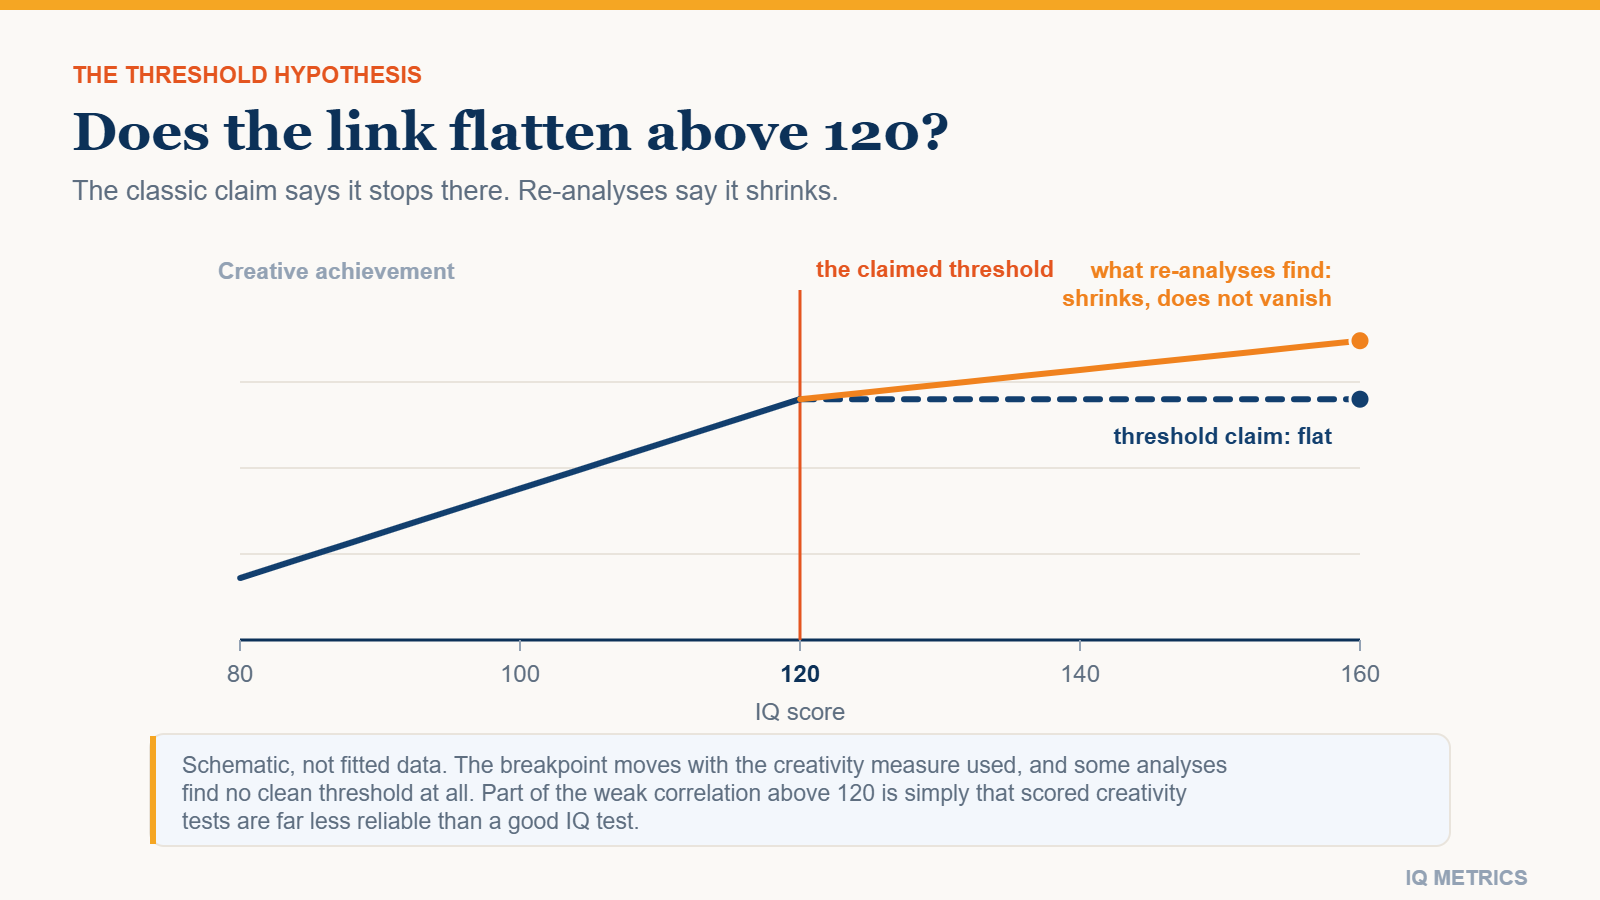
The threshold hypothesis says IQ and creativity move together up to about 120 and barely at all above it. It is a real claim with a real number, and modern re-analyses have weakened it. Here is what the segmented-regression work found, why the two kinds of task differ, and why measurement noise matters.

Chart of creative achievement against IQ, contrasting the threshold claim that the line goes flat above 120 with re-analyses showing it keeps rising more gently

It fades, but it does not stop. IQ and creativity correlate positively but modestly across ordinary score ranges, and the relationship may well weaken somewhere in the 110 to 130 band. What it does not appear to do, on the best modern evidence, is switch off: the correlation shrinks rather than vanishing, and where it starts shrinking moves with the creativity measure you use.

Two things make the question stubborn. Creative tasks ask the mind for a different operation than a reasoning item does, and the instruments that score them are far noisier than an IQ test.

The threshold hypothesis, stated as a number

The claim is most often associated with Ellis Paul Torrance, though J. P. Guilford and others in the same 1960s literature advanced versions of it too. Stated plainly: intelligence is necessary but not sufficient for creative performance, so below roughly IQ 120 more measured ability tends to mean more creative output, and above that point extra points buy little or nothing.

There is nothing magical about 120 itself. On a scale with a mean of 100 and a standard deviation of 15, a score of 120 sits just above the 90th percentile, so about nine people in a hundred score higher. Where it falls on the IQ bell curve makes the point better than a sentence can, and the percentile calculator will place any other score beside it.

So the threshold, if it exists, sits at the edge of the top decile, not out among the rare scores. That matters: a claim about the top ten percent is testable in ordinary samples; a claim about the top tenth of one percent is not. Our piece on what a score of 120 actually means covers the everyday side.

  • Below the line: a clearly positive correlation between measured intelligence and scored creativity, steep enough to see in a scatter plot. For reference, meta-analytic summaries put the correlation across the whole score range at roughly 0.2, with individual estimates scattered widely on either side of it.
  • Above the line: a correlation close to zero, so that two people scoring 125 and 145 ought to be indistinguishable on creative measures.
  • A visible kink: a scatter plot whose slope changes at a particular score, not a straight line that merely drifts.

What happened when the claim was re-tested

The threshold hypothesis is unusually easy to test, because it makes a geometric prediction. Fit one line to the data and it should fit badly. Fit two lines joined at a breakpoint estimated from the data itself — segmented, or piecewise, regression — and the second line should come out flat. Several groups have done exactly that, on Torrance-style divergent-thinking batteries and on fresh community samples.

Chart of creative achievement against IQ, contrasting the threshold claim that the line goes flat above 120 with re-analyses showing it keeps rising more gently

The results have been mixed. Some analyses do recover a breakpoint, but its location moves with the scoring rule rather than sitting at 120: estimates have landed in the mid-80s for simple idea fluency, near 100 for originality scored across all responses, and close to 120 only when originality was judged on a person’s best ideas alone. The confidence intervals around those estimates are usually wide.

Other analyses find that a single straight line describes the data about as well as two do, which is precisely what the hypothesis says should not happen. A bend only some analysts can find, at a score that moves with the marking scheme, is a weak bend.

Longitudinal work on people far above the threshold cuts against it too. In samples selected in adolescence for very high mathematical or verbal ability, differences within that already-elite group still predicted patents, publications and creative accomplishment decades later. If ability stopped mattering above 120, those differences should have washed out. They did not.

Something does visibly change in the upper range, though, and the competing explanations are unglamorous.

  • Range restriction. Correlations shrink automatically when you slice the bottom off a distribution, whether or not the underlying relationship changed.
  • Ceiling effects. Many creativity tasks are short and easily maxed out, so strong performers pile up at the top and the spread a correlation feeds on disappears.
  • Sampling. Gifted-programme and selective-university cohorts supply most above-threshold data, and they are selected on close to the very variable under study.

Two operations: divergent and convergent thinking

The argument also refuses to settle because creativity tests do not all ask for the same thing. Two families of task dominate the literature, they behave differently against IQ, and the quickest way to see why is to imagine sitting them.

The alternate uses task

You are handed a common object — a brick, a paperclip, a newspaper — and asked to list as many uses for it as you can in a few minutes. Responses are scored on fluency (how many), flexibility (how many categories), originality (how rare the answer is against a reference sample) and elaboration. A doorstop counts. So does grinding the brick down for pigment. There is no key at the back of the book.

The remote associates task

Here you get three words — cottage, Swiss, cake — and have to find the fourth that links all three. The answer is cheese, and once you see it, it is plainly right. That single defensible answer makes the task behave much more like a reasoning item, and its correlations with general intelligence tend to run higher than those of alternate-uses scores. The word creativity is covering two rather different measurements.

Your own number

Where would your own score land?

Take the IIF-certified assessment and get your score with the scale it was measured on, the percentile it corresponds to and the confidence range around it — the three figures most online tests leave out.

Find your IQ score now!

Secure & encryptedInstant results10–20 minutes

How that compares with what an IQ test asks

A matrix-reasoning item shows a three-by-three grid of shapes with the bottom right cell missing and six or eight candidates underneath; exactly one completes the rule governing the rows and columns. A number-series item gives 2, 6, 12, 20 and wants 30, because the gaps grow by two each time. In both cases the correct response can be argued from the stimulus alone, which is what makes it scorable; the mechanics are covered in how IQ tests work.

Set that beside the brick. Two competent scorers marking matrix items agree on essentially every response; two scorers marking originality will not, unless both consult the same frequency table from the same reference population. That disagreement is not sloppiness. It is built into what is being measured.

Ability, output, and the ingredients that are not cognitive

A test measures what somebody can produce in a few minutes under instruction. A creative career measures what they finished, showed to other people, defended against criticism and kept doing after the first rejection. Related quantities, certainly — but nobody should expect them to track each other tightly.

Among the non-cognitive ingredients, openness to experience is the trait most consistently linked with creative achievement, in many studies at least as strongly as measured ability is. Persistence and sheer accumulated hours inside a domain do comparable work. Our comparison of IQ and personality sets them side by side.

The broader question — what else has a claim on the word intelligence — is treated in is intelligence limited to IQ. This page is narrower and more checkable: whether one number stops tracking another above a particular value.

The reliability problem, which is the strongest argument here

Any correlation between two measures is capped by how reliably each is measured. A well-constructed supervised IQ test typically reports test-retest reliability at or above 0.90, so somebody who sits it twice lands in close to the same place. Scored creativity batteries do considerably worse, and much less consistently: depending on the task, the scoring scheme and the interval between sittings, reported retest figures run from roughly 0.5 to roughly 0.8, and no single value describes them.

The consequence is arithmetic rather than philosophical. When one of your two variables is noisy, the observed correlation is dragged toward zero even where the true relationship is strong. Part of the modest link reported between intelligence and creativity is therefore a fact about instruments rather than about minds. Statisticians call the adjustment correcting for attenuation; applying it raises the estimates, though it produces a projection of what a perfect instrument would have found rather than a fresh measurement.

This cuts in more than one direction. Noise on its own would blur the relationship everywhere rather than bend it at one particular score, so unreliability alone is not the whole story. It is not a defence of the threshold either: a ceiling on the creativity measure, of the kind described above, produces something that looks very like a kink.

What poor reliability does guarantee is that no relationship above 120 and a real relationship too faint for a blunt instrument to detect look identical in a scatter plot. Our page on IQ test accuracy sets out the error bars a single score carries.

So what does a score above 120 say about creative potential?

Less than the number’s precision implies, and more than nothing. The defensible reading is that intelligence behaves like a resource with diminishing returns for creative work: useful throughout, most decisive at the lower end of the range, and progressively outweighed further up by interest, temperament, opportunity and hours on task.

The threshold hypothesis survives as a rough description rather than a law with a fixed value. Estimates vary, breakpoints move with the measure, and several careful analyses find no clean elbow anywhere in the data. Treat 120 as a landmark in a conversation, not as a gate.

If a result put you near that band, the useful next step is unhurried: sit a properly timed IQ test under decent conditions and read the score with its error bar attached. It will tell you something real about reasoning and pattern work. What it cannot tell you is where you land relative to its own slope once temperament, interest and hours in a domain have had their say.

Share this article

Know someone who keeps seeing these numbers quoted without the scale they were measured on? Send it to them.