





When One Half of Your IQ Score Is 15 Points Higher Than the Other
Two people can hold the same IQ number and have completely different profiles, and a split between the verbal and non-verbal indexes is far commoner than most test-takers expect. Here is what base-rate tables and compounding measurement error say about how large a gap has to be before it means anything.
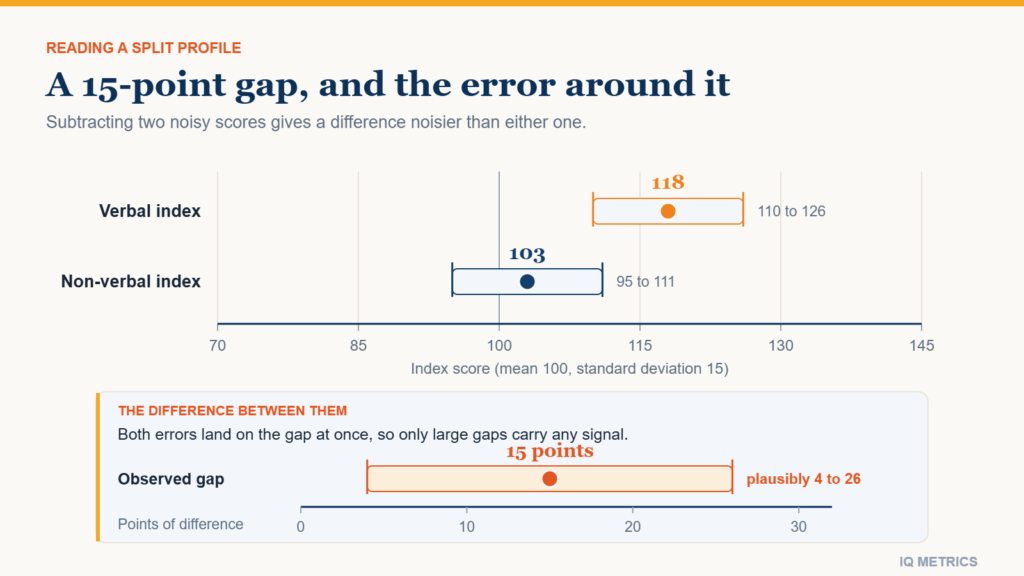
A gap between your verbal and your non-verbal scores is far more common than most people assume. Published base-rate tables from the major batteries show index splits of 10 to 15 points turning up in a substantial minority of the standardisation sample, so a verbal vs non-verbal IQ score difference of that size is usually unremarkable. The useful question is not whether you have a split, but whether yours is big enough to survive the measurement error sitting on both sides of the subtraction.
One number is an average, and averages destroy shape
A full-scale score is a weighted average of several index scores, and averaging is a lossy operation. Two people can arrive at the same 112 by completely different routes: one of them even across every domain, the other with a strong verbal index dragging a weaker visual-spatial one up to the mean. The composite is identical; the profiles are not.
That is why psychologists read the indexes before the total, and sometimes decline to interpret the total at all when the indexes disagree sharply. If the parts of a measure point in different directions, their average summarises something that does not really exist as a single quantity.
The two directions a split can run
Index score discrepancies are not symmetrical in what they suggest. A verbal score sitting above a non-verbal one keeps different company from the reverse pattern, and neither is a diagnosis. Treat the two shapes described here as typical associations, nothing stronger.
Verbal sitting above non-verbal
This shape is common in people with long formal education, heavy reading habits and verbally loaded work: teaching, law, journalism, anything whose day is made of words. Vocabulary and general knowledge keep accumulating with exposure, while timed matrix and pattern tasks do not reward exposure in the same way, so the pattern tends to flatter older test-takers.
That asymmetry between accumulated knowledge and reasoning on the spot has a standard name in the literature, and how IQ tests are built and scored sets it out. The point here is only that a verbal edge is often a record of practice rather than a difference in raw horsepower.
Non-verbal sitting above verbal
The reverse split is common among people testing in a second language, people whose schooling was interrupted or happened in a different system, and younger adults, who have simply had fewer years to accumulate the vocabulary and general knowledge the verbal side rewards. Reading and language difficulties can also hold down verbally loaded scores without that implying a matching limit on reasoning, which is a clinical question rather than a scoring one and is handled in the piece on ADHD, autism, dyslexia and test scores.
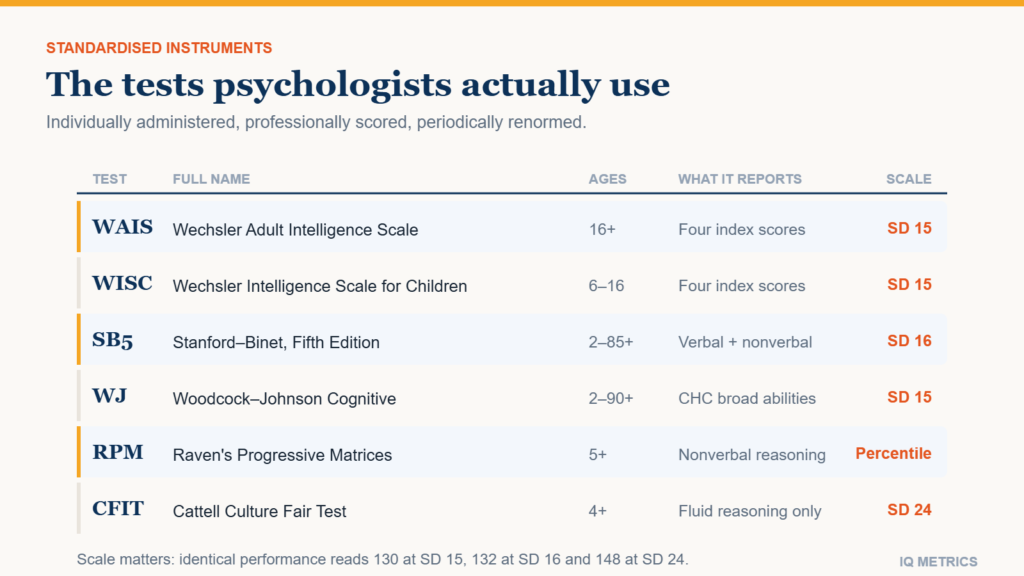
Language load is the obvious confound in this direction, and batteries differ in how much of it they carry; those differences are compared in the guide to professionally administered IQ tests.
How big does a gap have to be before it is signal?
Two things have to hold before a split is worth interpreting. It has to be unusual relative to the population, and it has to be larger than the combined error of the two measurements that produced it. Most of the gaps people worry about fail both tests.
Base rates: lopsided profiles are ordinary
Test manuals publish base-rate tables showing how often each size of index difference occurred in the standardisation sample. The consistent finding is that double-digit splits are common among entirely typical people: published tables put differences of roughly 10 to 15 points in a substantial minority of the sample. The exact percentage depends on the battery and on which pair of indexes you are comparing, so treat any single figure you see quoted as specific to one test rather than universal.
The practical consequence is deflating. A 12-point split is not a finding. Differences of that order turn up often enough in the standardisation samples that seeing one tells you almost nothing about the person holding the score. Gaps only start to look genuinely uncommon well beyond the double-digit range, and where that line sits is decided by the table for that specific index pair on that specific battery, not by any single number that carries across tests.
Why subtracting two noisy numbers widens the error
Every score carries measurement error. A well-built battery with a reliability near 0.90 has a standard error of measurement of roughly 4 to 5 points, which is why a score of 115 is honestly reported as a roughly 95 per cent band of about 106 to 124 rather than as a single point; that arithmetic is worked through in the piece on how accurate IQ tests really are. Index scores rest on fewer items than the full scale, so their bands are if anything a little wider than that.
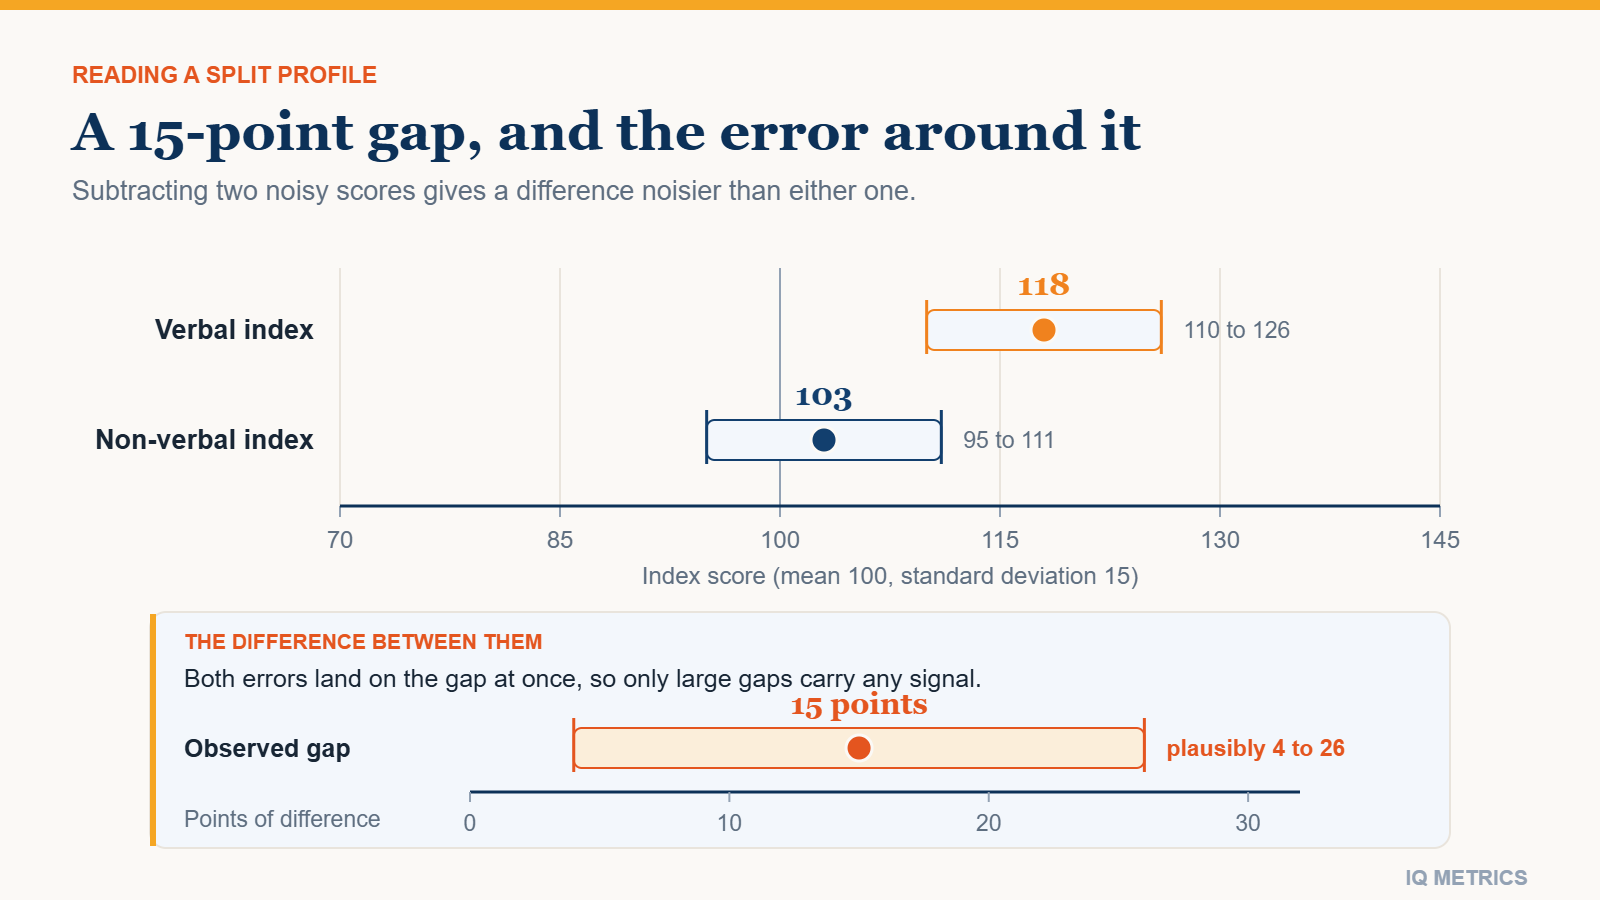
Now subtract one of those bands from another. Uncertainties do not cancel when you take a difference, they accumulate: the gap between two index scores is a noisier quantity than either index on its own, so its error band is wider than the band on either score you started with. Two errors of 4 to 5 points combine into an error on the difference of roughly 6 to 7 points, which puts a band of something like 12 or 13 points either side of any gap you measure. A difference has to clear a higher bar than a score does before it can be told apart from zero.
Said plainly: if each of two scores can land several points either side of your true standing, a gap of 8 or 10 points between them can be manufactured by nothing more than which day you sat down. Small splits are usually not small effects but no effect at all, which is why a modest gap so often shrinks or flips direction on a retest.
Where would your own score land?
Take the IIF-certified assessment and get your score with the scale it was measured on, the percentile it corresponds to and the confidence range around it — the three figures most online tests leave out.
Find your IQ score now! →Subtest scatter is even weaker evidence
Once a split appears, the temptation is to go one level deeper and interpret individual subtests: strong on one, weak on another, therefore a profile. Resist that. Subtests are shorter than indexes, shorter means less reliable, and less reliable means the scatter across them is noisier still.
Decades of research on interpreting individual subtest peaks and troughs have been unkind to the practice. Index-level differences are the smallest unit worth taking seriously, and only when they clear both the base-rate hurdle and the error hurdle. Keep constructs separate too: a weak memory-loaded score is not the same evidence as a weak reasoning score.
What a real discrepancy actually licenses you to conclude
Suppose your split profile clears every hurdle: large, rare in the base-rate table, and still there on a second sitting. What have you learned? A hypothesis about how you learned and where you are practised — not a second IQ, and not a diagnosis.
- It is descriptive, not causal. A high verbal index says the vocabulary and verbal reasoning are there. It does not say whether they came from schooling, reading, work or something else entirely.
- It is not a ceiling on the weaker side. Index scores move with familiarity and practice, and retest gains are usually larger on the non-verbal side than on the verbal one.
- It is not a label. Score patterns are consistent with many explanations and specific to none; a diagnosis needs history, observation and criteria that no test result supplies.
- It is not a career instruction. The link between profile shape and occupational outcomes is far too loose to guide an individual decision.
The honest use of a split is narrower. It tells you which kind of task you are likely to find comparatively effortful, which is worth knowing when you decide how much preparation an exam or an aptitude screen deserves.
How to read your own rough profile
Breaking the composite apart is the only way to see shape, and a few rules keep the exercise honest.
- Sit the domains separately: the verbal reasoning test, the spatial reasoning test and the numerical reasoning test, ideally on different days, so that fatigue does not manufacture a gap for you.
- Convert every result to a percentile first. Different tests are not marked on the same ruler, and percentiles are the closest thing to a common currency.
- Compare the percentiles, not the raw scores. If your two most extreme domains land within about ten percentile points of each other, treat the profile as flat — flat is the normal answer, and anything wider still has to clear both hurdles above before it means anything.
- Re-sit your two most extreme domains once. A gap that survives a repeat is worth thinking about; a gap that moves was noise wearing a costume.
One caution about self-administered results: unsupervised tests vary in quality and in how carefully they were normed, so a split measured across two different tests carries all the error above plus the gap between two norming samples. Comparing within one family of tests is safer.
Where to start if your number feels uneven
If you are holding one score and a suspicion that it does not describe you evenly, the cheapest next step is to take it apart rather than to take it again. Sit the domains one at a time, run each result through the IQ percentile calculator, and look at the shape instead of the total.
Most people find their profile is flatter than they expected, and that is the good outcome: a flat profile means the composite you already have is doing its job. A large, repeatable split is rarer, and even then it describes where your practice has gone rather than what you can learn next.
Keep reading
All articles →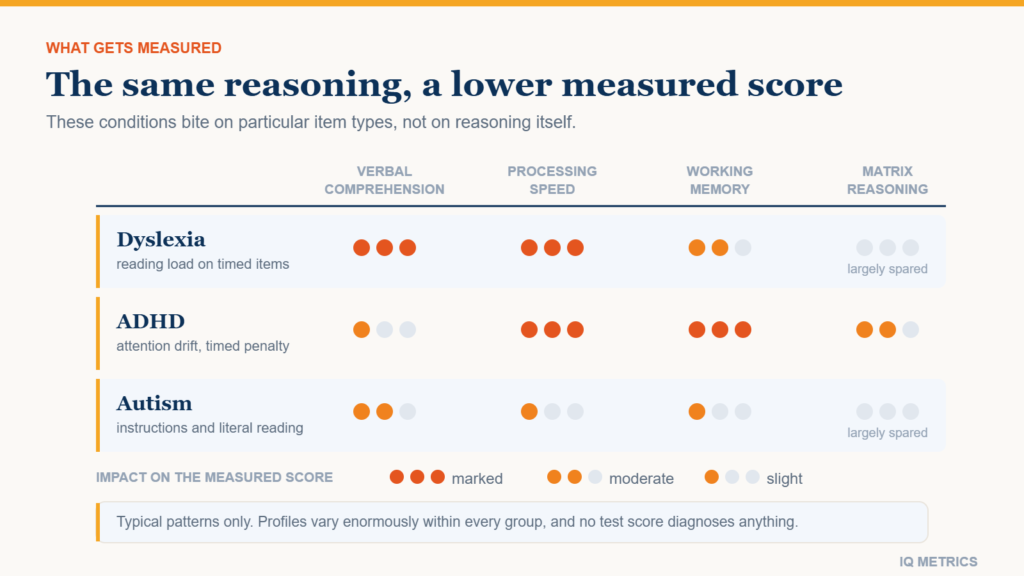 Taking a Test
ADHD, Autism and Dyslexia in IQ Testing
A test score is a measurement, and a measurement can be biased by the conditions under which it is taken. ADHD, autism and dyslexia each depress performance on particular kinds of item without lowering the reasoning underneath. Here is what actually interferes, condition by condition, and what to do next.
 Taking a Test
Professional IQ Tests
When a psychologist measures intelligence, they reach for one of a small number of standardised instruments. This guide covers what the Wechsler scales, Stanford-Binet, Woodcock-Johnson and Raven's Progressive Matrices each measure, who each one is for, and where an online test genuinely fits.
 Scores & Scales
What Your IQ Test Score Really Means?
IQ scores measure intelligence and problem-solving. IQ tests can reveal intellectual abilities, but they should be taken cautiously and with knowledge of their limitations. Because intelligence is multidimensional, no single test can measure it.