





SAT and ACT Score to IQ Conversion: What the Research Actually Supports
Neither the SAT nor the ACT is an IQ test, but two landmark studies found they correlate with general cognitive ability at 0.77 to 0.86. Here is what that correlation actually predicts by percentile, the real 12-point margin of error around any single conversion, and why the method breaks down at the extremes.

Neither the SAT nor the ACT is an IQ test, and neither produces an official IQ score. But both correlate with general cognitive ability strongly enough that researchers have used them as a stand-in for IQ in large studies, and the two papers behind almost every SAT-to-IQ chart online report correlations in the 0.77–0.86 range. That is genuinely high — but it is not 1.0, and the gap between a strong correlation and a trustworthy individual conversion is exactly where most of those charts go wrong.
This article works through what the two source studies actually found, what a correlation of about 0.8 does and does not let you predict about one specific person, and the real margin of error around any single number — which is wider than any chart circulating online tends to admit.
Why a college-admissions test and an intelligence test correlate at all
The SAT and ACT were built to predict first-year college grades, not to measure intelligence. But the skills they sample — verbal comprehension, quantitative reasoning, working with unfamiliar problems under a strict time limit — overlap heavily with what an IQ test samples, because both are, underneath the branding, timed tests of reasoning under novel conditions. The overlap is not total: the SAT and ACT also load on things a well-designed IQ test tries to strip out, including years of curriculum exposure, test-specific coaching, and how many times a student has already sat the exam. Professional IQ tests covers what a clinical instrument samples instead, and the difference is most of why a conversion is approximate rather than exact.
The SAT and ACT are also concordant with each other: the two testing organizations publish official tables mapping a score on one exam to an equivalent score on the other, despite real format differences — the ACT includes a dedicated science-reasoning section that the SAT does not, for instance. That the two admissions tests agree with each other reasonably well is a small piece of supporting evidence that both are sampling something real and shared, which is part of why a correlation with IQ shows up on both sides rather than being a quirk of one particular exam.
The two studies behind almost every SAT/ACT-to-IQ chart
Psychologists Meredith Frey and Douglas Detterman published the original analysis in 2004, titled plainly Scholastic Assessment or g? Using the National Longitudinal Survey of Youth, they identified 917 people who had taken both the SAT and the U.S. military’s own aptitude battery, which has a well-established general-ability score. SAT scores correlated with that measure at 0.82, rising to 0.86 once they corrected for a mild statistical nonlinearity in the relationship. A second, smaller study in the same paper compared SAT scores directly against Raven’s Advanced Progressive Matrices — a nonverbal reasoning test often used because it is harder to coach for — in 104 undergraduates, and found a raw correlation of 0.48, rising to 0.72 once corrected for the fact that undergraduates are a narrower, higher-scoring slice of the population than everyone who sits the SAT.
Karen Koenig, working with Frey and Detterman, repeated the exercise for the ACT in 2008. Among 1,075 people in the same national survey who had taken the ACT and the military aptitude battery, the correlation was 0.77. A newer, smaller sample of 149 people comparing ACT composite scores against Raven’s-derived IQ found 0.61. Both papers have been cited hundreds of times, and nearly every SAT-to-IQ or ACT-to-IQ chart in circulation traces back to one of them, whether or not the site displaying it says so.
One thing both studies were not about is worth stating directly, since the site’s own news coverage handles a related but different question: the SAT’s move to a fully digital, adaptive format is a change to how the test is administered, not a reason its correlation with cognitive ability would be higher or lower. What changes for a score under the new digital format is a different question from the one this article answers.
Where would your own score land?
Take the IIF-certified assessment and get your score with the scale it was measured on, the percentile it corresponds to and the confidence range around it — the three figures most online tests leave out.
Find your IQ score now! →What the correlation predicts, by percentile
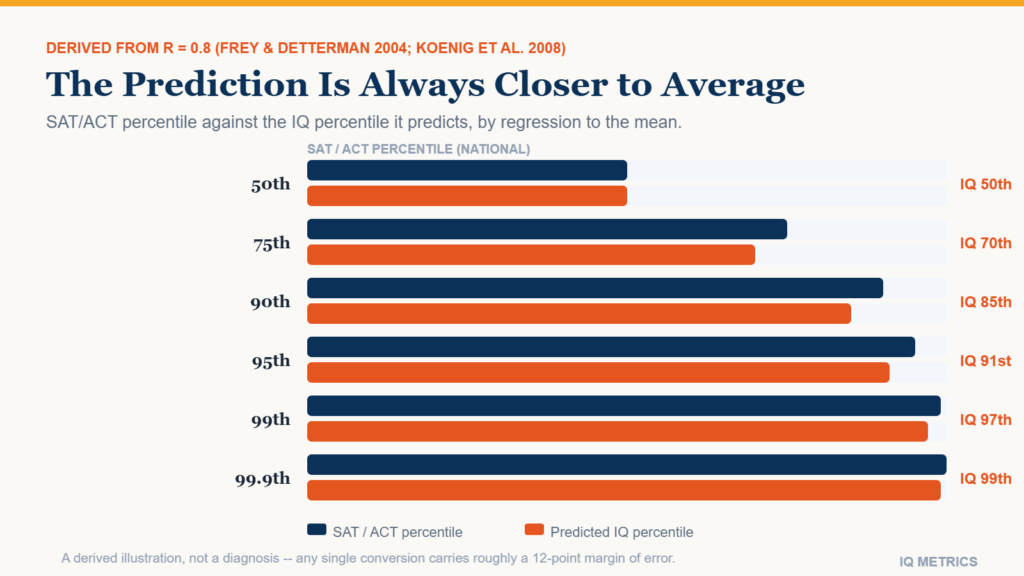
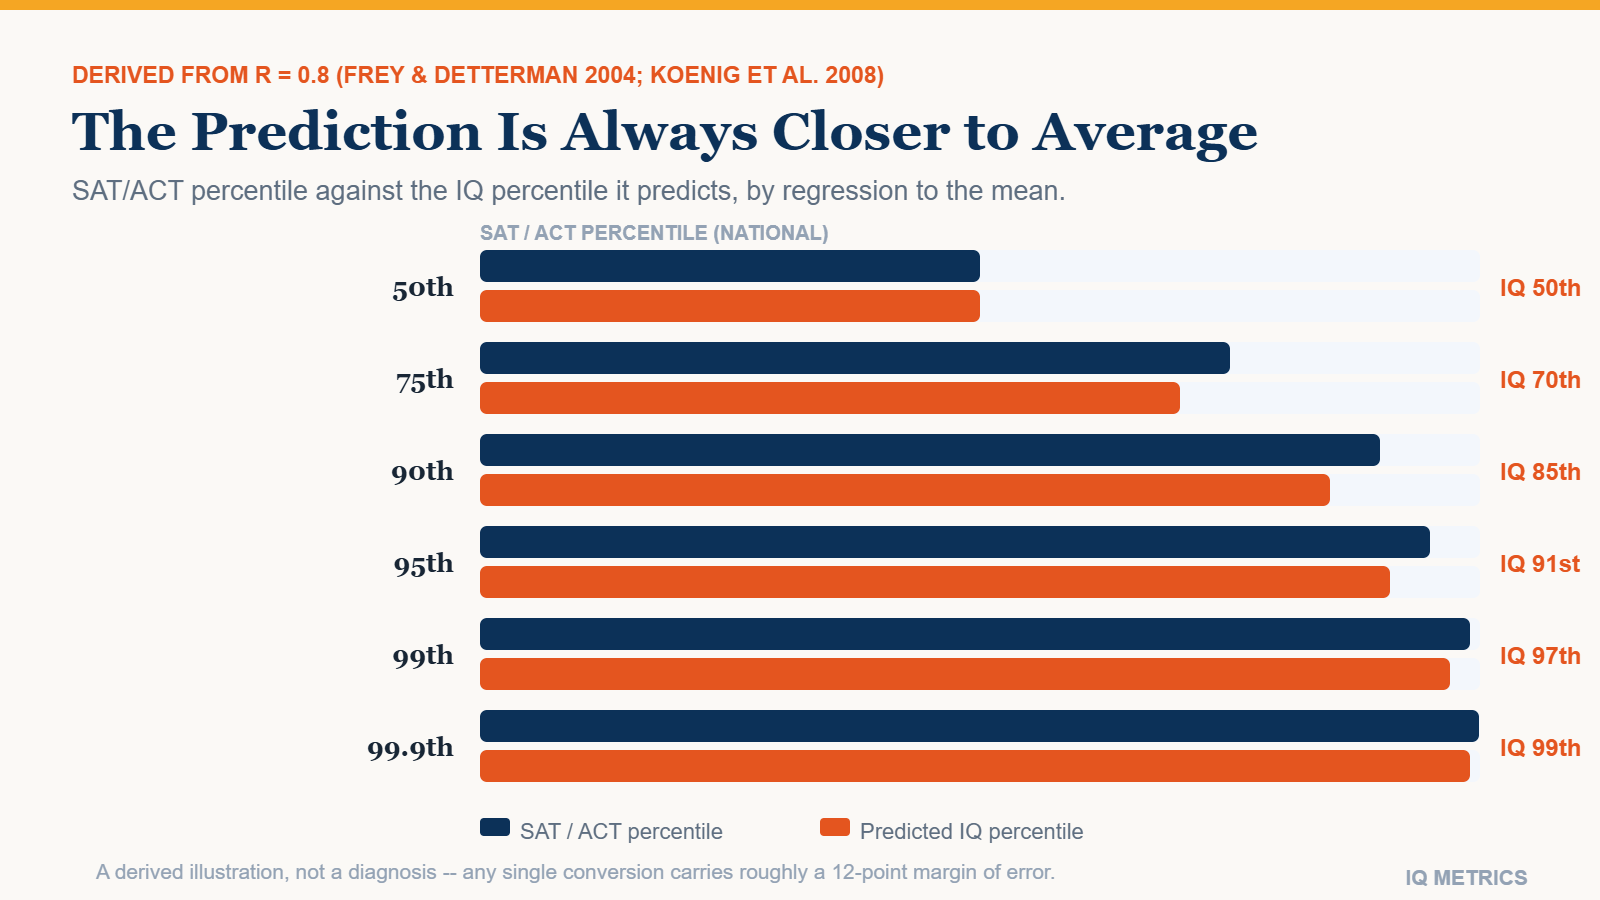
A correlation coefficient has a precise statistical meaning: for two bell-curve-shaped measures correlated at r, the best single guess at someone’s standing on one measure is r times their standing on the other, expressed in standard deviations from the mean. That relationship, applied to the roughly 0.8 average of the studies above, gives the table below — a derived estimate using the studies’ own correlation, not a table lifted from either paper. It uses percentile rank because percentile, unlike a raw score, does not shift every time the SAT or ACT is rescaled.
| SAT/ACT percentile (national) | Predicted IQ (approx.) | Predicted IQ percentile |
|---|---|---|
| 50th | 100 | 50th |
| 75th | ~108 | ~70th |
| 90th | ~115 | ~85th |
| 95th | ~120 | ~91st |
| 99th | ~128 | ~97th |
| 99.9th | ~137 | ~99th |
Notice the pattern: the predicted IQ percentile is always closer to average than the SAT/ACT percentile it is built from. That is not a rounding artifact — it is regression to the mean, the same statistical effect that makes the children of very tall parents shorter on average than their parents. Any two imperfectly correlated measures pull toward the middle when you predict one from the other, and a correlation of 0.8, however strong, is still imperfect.
Here is what that looks like for one specific person. A student whose SAT total places them at the 95th percentile nationally is, by this method, predicted to score around IQ 120 — which itself sits at roughly the 91st percentile of the general population, not the 95th. The gap between those two percentiles is regression to the mean showing up in a single concrete case, and it widens rather than narrows further out in the distribution: at the 99.9th percentile on the SAT, the predicted IQ percentile is only about the 99th, not the 99.9th.
Why no single conversion is exact
A 2005 comment on the original Frey and Detterman paper, published in the same journal by testing researcher Brent Bridgeman, worked out the practical size of the uncertainty: the standard error of the prediction equation was about 5.94 IQ points, which means the 95% confidence band around any single person’s predicted IQ runs roughly 12 points wide in either direction. Twelve points is nearly the entire span of the "average" classification band on most scales. Two people with identical SAT scores could have real IQs that differ by 20 points or more and both be entirely consistent with the same prediction.
The method also gets less trustworthy, not more, at the extremes. Bridgeman’s critique specifically flagged that pushing the equation toward a near-perfect SAT score produced implausibly high predicted IQs — an artifact of extrapolating a straight-line relationship past the range where it was actually measured, not a real result. A perfect or near-perfect score should not be read as implying a specific very high IQ with any precision.
- The SAT has been rescaled more than once — a 1995 recentering, an essay-inclusive 2400-point scale from 2005 to 2016, a return to 1600, and a fully digital adaptive format from 2024 — so a formula fit to one era’s score distribution does not automatically carry over to another.
- Retakes, test-specific coaching and superscoring can move an SAT or ACT result in ways that do not touch the underlying ability an IQ test tries to isolate under single-session, standardized conditions.
- Both correlations were measured against a proxy for IQ (a military aptitude battery, or Raven’s matrices) rather than a full individually administered scale, which adds its own layer of imprecision on top of the correlation itself.
What a converted number is actually useful for
Treated as a rough, population-level sanity check, the correlation between these tests and cognitive ability is a genuinely interesting piece of psychometric history — it is part of why the SAT works reasonably well as a rough predictor of first-year college performance in the first place. Treated as a personal diagnostic, it is the wrong tool: a 12-point margin of error and an extrapolation problem at the high end are disqualifying for anything resembling a precise number.
None of this is a reasonable basis for anything consequential — a gifted-program application, a hiring decision, or a diagnosis all call for an actual, individually administered test, not a number backed into from an exam built for a different purpose entirely. Where the correlation is genuinely useful is narrower: as a sanity check on how much real overlap exists between "college readiness" and general cognitive ability, and as a reminder that a single test score, whichever test it came from, is an estimate with a margin of error attached to it, not a fact.
SAT and ACT scores correlate with IQ because both are, underneath everything else, timed tests of verbal and quantitative reasoning under unfamiliar conditions — they share an identifiable mechanism. Not every number that seems to move alongside IQ does; see eye color and IQ for a claim that looks similar on the surface and has no shared mechanism behind it at all. If what you actually want is your own number rather than an estimate built from a different test, an individually normed assessment is the only way to get one, and the percentile calculator converts whatever score you end up with into where it sits in the population — the same step this article just walked through in reverse.
Keep reading
All articles →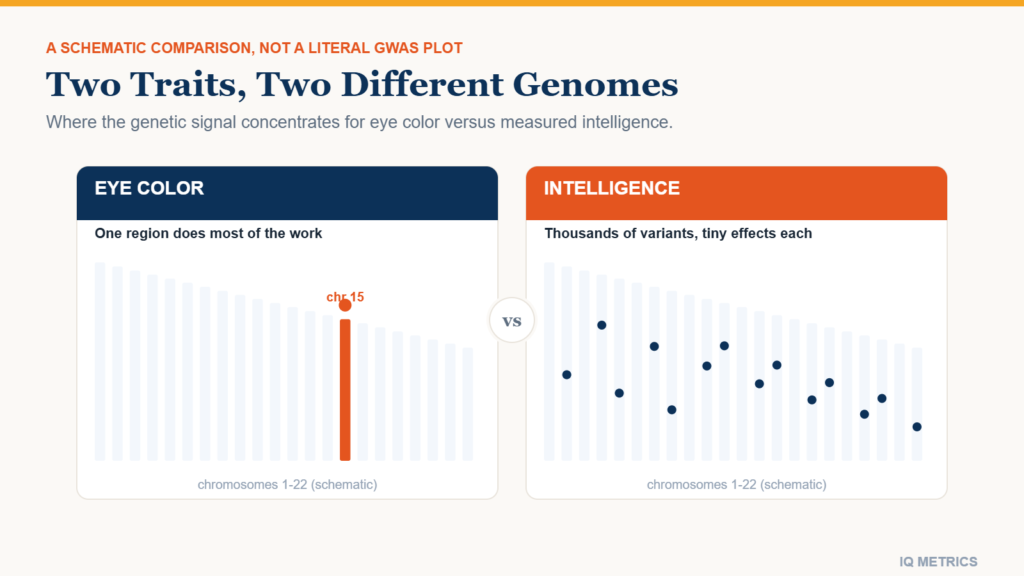 Research & Evidence
Eye Color and IQ
There is no credible study linking eye color to IQ, and the chromosome region that determines eye color has never turned up in a genome-wide study of intelligence. Here is what the genetics actually says, where the pattern people cite really comes from, and how it compares to a correlate that does have real evidence behind it.
 Taking a Test
Professional IQ Tests
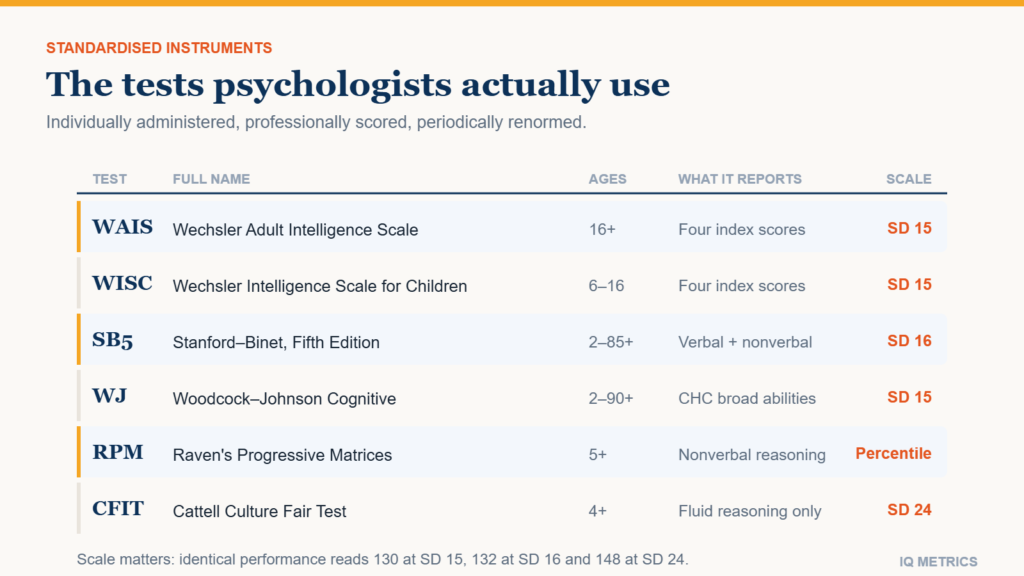
When a psychologist measures intelligence, they reach for one of a small number of standardised instruments. This guide covers what the Wechsler scales, Stanford-Binet, Woodcock-Johnson and Raven's Progressive Matrices each measure, who each one is for, and where an online test genuinely fits.
 Scores & Scales
Mensa IQ Score Requirements
Mensa admits the top 2% of scorers, but "the top 2%" is a rank, not a number, and the number it maps to changes with the test you sat. Here is what qualifies on the Wechsler, Stanford-Binet and Cattell scales, the two routes to membership, and what the supervised admission test is actually like.