
What teachers believe about the brain: neuromyths by country
Every published survey we could find since 2012 that asked teachers or trainee teachers whether classic brain myths are true, in one open table: 41 survey samples from 33 papers, 23,424 people in 25 countries. Pooled myth by myth with a random-effects meta-analysis, then country by country and year by year.

By Leon Falkner, Data & Research Analyst · Reviewed by Aarav Vardhan, Editor-in-Chief · Published 22 October 2026 · 14 min read
About this study
- Report type
- Data study: meta-analysis of published surveys
- Surveys
- 41 samples from 33 papers, published 2012 to 2026
- People
- 23,424 teachers and trainee teachers (30 samples of working teachers, 11 of trainees)
- Countries
- 25
- Method
- Random-effects meta-analysis of proportions (logit, REML), myth by myth
- Checked
- 22 October 2026, against each paper
- Licence
- CC BY 4.0
- Version
- 2026.10
- Sources
- 52
Most teachers believe at least some brain myths. Pooling 41 surveys of 23,424 teachers and trainee teachers in 25 countries (2012 to 2026), 93% agreed that pupils learn better in their preferred learning style, 79% backed Brain Gym-style exercises and 46% that we use only 10% of our brain. Only 8% think intelligence is fixed. IQ Metrics Research, October 2026.
01 Key findings
- Learning styles is the most believed myth. Pooled across 37 surveys published 2012 to 2026 (20,838 people), 93% (95% CI 91% to 94%) of teachers and trainees agreed that pupils learn better in their preferred learning style; single surveys ranged from 74% (Quebec, Canada, Blanchette Sarrasin et al. 2019) to 100% (Indonesia, Fatmawati et al. 2023).37 surveys, 25 countries
- About half believe the 10% myth. 46% (95% CI 43% to 49%) agreed that “we only use 10% of our brain” (36 surveys, 21,652 people), from 26% (Turkey, Mercan et al. 2022) to 68% (Peru, Gleichgerrcht et al. 2015).36 surveys, 2012 to 2026
- Myths about intelligence split. 92% backed multiple intelligences (5 surveys) and 51% the Mozart effect (6 surveys), but only 8% agreed that mental capacity is hereditary and cannot be changed (16 surveys).Pooled, random-effects
- Neuroscience training helps, unevenly. In a US survey (2014 to 2015), adults with many neuroscience courses believed the 10% myth far less often than 598 educators (14% vs 33%), yet believed in learning styles just as often (78% vs 76%) [27].Macdonald et al. 2017, 3,877 people
- No clear decline. Across surveys published 2012 to 2026, belief in learning styles changed by +1 point per decade (95% CI -4 to +6) and belief in the 10% myth by -5 points (-14 to +4).Meta-regression on publication year
02 Neuromyth statistics to quote
Teachers and trainees who agree that pupils learn better in their preferred learning style.
Pooled, 37 surveys, 2012 to 2026Agree that “we only use 10% of our brain”.
Pooled, 36 surveysAgree that short coordination exercises integrate the left and right brain, the idea behind Brain Gym.
Pooled, 35 surveysAgree that left-brain or right-brain dominance explains differences between learners.
Pooled, 38 surveysAgree that mental capacity is hereditary and cannot be changed by environment or experience.
Pooled, 16 surveysUS educators vs adults with many neuroscience courses who believed the 10% myth.
Macdonald et al. 201703 What percentage of teachers believe in neuromyths?
Most believe several, and a few myths are believed almost everywhere. Pooled across every survey that asked it, the share of teachers and trainee teachers agreeing ran from 93% for learning styles to 8% for fixed intelligence. Four of the eight myths this study tracks were believed by at least seven in ten; the sugar myth and the Mozart effect split teachers roughly in half, and the 10% myth was believed by just under half.
A neuromyth is a false belief about the brain that grew out of real research, a term the OECD popularised in 2002 [42]. Since Dekker and colleagues surveyed 242 teachers in the UK and the Netherlands in 2012 [8], researchers have repeated the same statements in country after country. We gathered every survey we could find that prints the share agreeing with each statement and pooled them, myth by myth.
How many teachers believe each neuromyth
Pooled share agreeing, % of teachers and trainee teachers, with the 95% confidence interval. Random-effects meta-analysis of 41 survey samples from 25 countries, 2012 to 2026. Each row pools the surveys that asked that myth (see Figure 2). Enriched environments, the other classic myth, is shown for comparison.
Source: IQ Metrics Research meta-analysis of 33 published papers (listed under Sources)
A pooled figure is an average over very different surveys, so the spread matters as much as the middle. Figure 2 shows every survey behind each row: pick a myth to see each one, its sample size and its 95% interval. The dashed line is the 95% prediction interval, the range in which a new survey of teachers would probably land.
Every survey, myth by myth
Share agreeing in each survey (square; area = sample size) with its 95% interval, and the pooled random-effects estimate (diamond). The dashed line is the 95% prediction interval: where a new survey would likely land. Pick a myth.
% agreeing with the statement
Source: IQ Metrics Research from 33 published papers (Sources); per-survey intervals are Wilson 95% intervals
04 What percentage of teachers believe in learning styles?
About nine in ten. Pooled across 37 surveys, 93% (95% CI 91% to 94%) agreed that “individuals learn better when they receive information in their preferred learning style (e.g., auditory, visual, kinesthetic)”. That matches the 89.1% Newton and Salvi found in their 2020 review of 37 studies of 15,405 educators [48].
Pupils do have preferences, and most teachers rightly say so. What experiments have not shown is that teaching to a preferred style improves learning: a 2008 review for the Association for Psychological Science found almost no studies designed to test it, and the few that were contradicted it [43]. In surveys that also asked the true statement about preferences, many teachers agreed with both, which authors attribute partly to a habit of answering “true” [18].
05 Do teachers believe in multiple intelligences?
Yes, most do. Pooled across 5 surveys, 92% (95% CI 79% to 97%) agreed with a statement of Howard Gardner’s theory of multiple intelligences. The largest recent study, of 1,257 primary teachers in 11 countries, reported that over 90% agreed with both multiple intelligences and learning styles [1].
The surveys word this myth differently, from “children have many types of intelligence” to “the dominant intelligence profile of learners must be considered in teaching”, so the figure is less precise than the others; each survey’s wording is in Figure 2 and the CSV. Gardner proposed several separate intelligences. Tests of the abilities he listed tend to correlate with each other, which is why intelligence researchers speak of a general factor, and reviews find little evidence that teaching to a pupil’s “intelligence profile” helps [44]. A 2025 survey of 3,158 Spanish teachers, which asked whether achievement rises when teaching is tailored to each pupil’s predominant intelligence, found an average rating of 3.38 on a 1 to 6 scale, close to the middle, so the share agreeing depends on how the statement is put [36]. Our explainer on multiple intelligences theory covers the debate.
06 Do teachers believe we only use 10% of our brain?
About half do. 46% (95% CI 43% to 49%) of teachers and trainees agreed that “we only use 10% of our brain”, pooled across 36 surveys in 25 countries. It is a myth: brain imaging shows activity across the whole brain over a day, and damage to almost any area has effects [47].
Teachers who believe we only use 10% of our brain
% agreeing with "We only use 10% of our brain", by country (several surveys in one country are pooled). 24 countries. Most surveys cover one city or region, not a whole country.
Source: IQ Metrics Research from 33 published papers (Sources)
Single surveys range from 26% (Turkey, Mercan et al. 2022) to 68% (Peru, Gleichgerrcht et al. 2015). Many teachers are simply unsure: where a survey offered a “don’t know” answer, a median of 24% chose it for this statement, against 2% for learning styles. Figure 4 puts every survey on one timeline.
The 10% myth, survey by survey, 2012 to 2026
Each bubble is one survey sample: year published (across) and % agreeing that "we only use 10% of our brain" (up). Bubble area = number of people asked.
% agreeing
Year published
Source: IQ Metrics Research from the surveys in Figure 2 (Sources)
07 Do teachers think intelligence is fixed, or that Mozart makes children smarter?
Few think intelligence is fixed; many believe in the Mozart effect. Only 8% (95% CI 6% to 12%) agreed that “mental capacity is hereditary and cannot be changed by the environment or experience” (16 surveys). They are right to reject it: differences in intelligence are partly heritable, but heritable does not mean fixed. A 2018 meta-analysis of 42 data sets with over 600,000 people found that an extra year of education raises IQ by about 1 to 5 points [45] (see does school raise IQ? and growth mindset and intelligence).
The Mozart effect is different: 51% (95% CI 30% to 71%) agreed that listening to classical music makes children smarter or sharpens their reasoning (6 surveys). The 1993 study behind it tested 36 college students on a paper-folding task after ten minutes of Mozart, not children’s intelligence [52], and a 2010 meta-analysis of around forty studies found little evidence for a specific Mozart effect [46]. More in what the Mozart effect study actually measured and music lessons and IQ.
Belief that the left and right halves of the brain explain how pupils learn sits in between: 70% (95% CI 65% to 75%) (38 surveys). Some functions such as language really are lateralised, but there are no “left-brained” and “right-brained” learners; see what brain scans show and brain myths about intelligence.
08 Which countries' teachers believe the most neuromyths?
Learning styles tops the list almost everywhere; the rest varies by survey. Of the five myths most surveys asked, learning styles is the most believed in 23 of the 25 countries in Figure 5, while agreement with the 10% and sugar myths swings from under a third to over two thirds. Treat country differences with care: almost every survey recruited volunteers online or through schools, so no figure is a national rate.
Neuromyths by country
% of teachers and trainee teachers agreeing. Where a country has several surveys they are pooled. Countries with at least three of the first four myths; empty = not asked. Sorted by the average of the first four.
Source: IQ Metrics Research from 33 published papers (Sources)
Pick a country: its teachers against the pooled average
% agreeing with five myths that most surveys asked, against the pooled estimate from all surveys (dashed). 20 countries asked all five.
Source: IQ Metrics Research from 33 published papers (Sources)
09 Are neuromyths declining among teachers?
Not clearly. In a meta-regression on the year each survey was published (2012 to 2026), the change per decade in learning styles, the 10% myth and the other common myths had intervals that include zero (Table 1); there are only a handful of surveys per year. Newton and Salvi reached the same conclusion for learning styles in 2020, when 95.4% of trainee teachers still agreed [48].
Has belief changed since 2012?
Pooled % agreeing in surveys published 2012 to 2016 and 2021 to 2026 (number of surveys), and the change per decade from a meta-regression on the year each survey was published, with its 95% interval. "Clear" = the interval excludes zero.
| Myth | Surveys | 2012 to 2016 | 2021 to 2026 | Change per decade | Clear change? |
|---|---|---|---|---|---|
| Learning styles | 37 | 94% (10) | 94% (19) | +1 point (-4 to +6) | no |
| Brain Gym | 35 | 78% (10) | 79% (18) | +1 point (-9 to +12) | no |
| Left/right brain | 38 | 76% (10) | 69% (20) | -7 points (-19 to +5) | no |
| Sugar and attention | 30 | 49% (10) | 52% (15) | +1 point (-9 to +12) | no |
| 10% of the brain | 36 | 52% (10) | 45% (19) | -5 points (-14 to +4) | no |
| Fixed intelligence | 16 | 8% (12) | +1 point (-10 to +12) | no | |
| Enriched environments | 26 | 92% (10) | 86% (11) | -7 points (-17 to +2) | no |
Source: IQ Metrics Research meta-regression (method below)
Which myths lead, by period
Rank of each myth by pooled share agreeing in surveys published in each period (1 = most believed). Only myths asked in all three periods.
Source: IQ Metrics Research meta-analysis by period (Sources)
Countries surveyed more than once do not show a clear direction either: the later survey came out higher about as often as lower, and the samples differ (working teachers one year, trainees or headteachers another). The cleanest comparison is Greece, where working teachers were asked the same core statements nine years apart: 97% agreed with learning styles in 2015 and 99% of primary teachers in 2024, and the left-brain/right-brain myth went from 71% to 72% [40].
10 Does neuroscience training stop teachers believing neuromyths?
It helps a little, but knowing more about the brain is no guarantee. In the first of these surveys, teachers who knew more general facts about the brain believed more myths, not fewer [8], a result repeated in Spain [14]. This is sometimes called the neuromyth paradox: enthusiasm for brain science draws teachers to popular sources that mix facts with myths.
Formal neuroscience does better. In a US survey of 3,877 adults, those with many university neuroscience courses believed fewer myths than educators, but unevenly (Figure 8): the gap was large for the 10% and left-brain myths and absent for learning styles [27]. Among educators, taking many neuroscience courses meant believing about 1.3 fewer of 7 myths. Teaching the myths directly works best: in studies Newton and Salvi reviewed, belief in matching teaching to learning styles fell from 78.4% to 37.1% after such lessons [48].
Educators vs people who took many neuroscience courses
United States, 2014 to 2015: % who called each myth true. 598 educators and 234 adults (not educators) who had taken many university neuroscience courses. Sorted by the gap.
Source: Macdonald et al. 2017, Tables 5 and 6 [27]
Of the 23 papers we read that tested it (including some not pooled above), 6 found that more brain knowledge or neuroscience exposure went with more myth belief, 8 with less, and 9 found no clear link or a mixed one (Table 2).
What each survey found about brain knowledge and training
| Survey | Direction | What the paper reports |
|---|---|---|
| Dekker et al. (2012) [8] | More knowledge, more myths | Teachers with more general knowledge about the brain believed more neuromyths |
| Ferrero et al. (2016) [14] | More knowledge, more myths | More correct general brain answers went with more myths (B = 0.31); reading scientific journals went with fewer (B = -0.92), educational magazines with more (B = 0.52) |
| Macdonald et al. (2017) [27] | Training or knowledge, fewer myths | Among 598 educators, many neuroscience courses (about 1.3 fewer of 7 myths) and reading peer-reviewed journals predicted fewer myths |
| Papadatou-Pastou et al. (2017) [30] | Training or knowledge, fewer myths | Trainees who got more general brain statements wrong believed more myths (beta = 0.34) |
| Düvel et al. (2017) [10] | Training or knowledge, fewer myths | Reading more books, journals and websites on educational neuroscience predicted better discrimination of myths (beta = 0.249) |
| Varas-Genestier and Ferreira (2017) [39] | More knowledge, more myths | More general neuroscience knowledge correlated with more myth belief (r = 0.16) |
| Falquez Torres and Ocampo Alvarado (2018) [13] | No clear link | General knowledge did not predict myth belief (beta = -.022) |
| Im et al. (2018) [21] | No clear link | An educational psychology course raised neuroscience literacy but did not reduce belief in neuromyths |
| Grospietsch and Mayer (2019) [17] | No clear link | Myth endorsement was largely independent of professional knowledge |
| Zhang et al. (2019) [41] | No clear link | No correlation between myth scores and general neuroscience knowledge (r = -0.052) |
| McMahon et al. (2019) [28] | Training or knowledge, fewer myths | A modified teacher-training course improved trainees’ accuracy on neuromyths |
| Carter et al. (2020) [5] | Training or knowledge, fewer myths | More general brain knowledge predicted more accurate answers on the myths (beta = .42) |
| Maureira Cid et al. (2021) [7] | No clear link | Readers of scientific texts knew more about the brain but believed the myths just as often |
| Chojak et al. (2021) [32] | More knowledge, more myths | Greater self-reported neurobiology knowledge went with more myth belief |
| Tunga and Çağıltay (2023) [38] | Training or knowledge, fewer myths | More general brain knowledge predicted fewer myths (beta = -.30) |
| Vig et al. (2023) [19] | No clear link | General brain knowledge was not associated with myth errors |
| Sandoval Grajeda et al. (2023) [29] | More knowledge, more myths | Trainees who seemed to know more about the brain made more errors on the myths (no statistics given) |
| Tsang et al. (2024) [18] | Training or knowledge, fewer myths | Accuracy on myths correlated with accuracy on brain facts (r = .46) |
| Kanlı (2025) [15] | More knowledge, more myths | More general brain knowledge predicted more myth belief (beta = .378) |
| Zambrano et al. (2025) [11] | Mixed | Greater brain knowledge predicted more belief in neuromyths but less belief in instructional myths (abstract) |
| Teixeira et al. (2026) [4] | Training or knowledge, fewer myths | More brain knowledge went with less myth belief (beta = -0.48) |
| von Hausen et al. (2026) [6] | No clear link | General brain knowledge did not predict overall accuracy on the myths (OR = 1.003) |
| García et al. (2026) [26] | Mixed | Neuroscience training outside the degree was protective; neuroscience taught inside the degree went with more myths (abstract) |
Source: The papers listed (Sources)
11 Why do the surveys disagree so much?
Different people, different questions and different answer options. For each myth asked in at least five surveys, 93% to 99% of the variation between survey results reflects real differences rather than chance (I-squared). Figure 9 shows the spread: learning styles is high in every survey, while the 10% and sugar myths cover much of the scale.
How much the surveys disagree, myth by myth
Each dot is one survey sample. The shaded shape shows where the results cluster (drawn when a myth has at least 8 surveys); the navy tick is the median survey and the orange diamond the pooled estimate.
% agreeing in each survey
Source: IQ Metrics Research from 33 published papers (Sources)
Three things move the numbers. Who is asked: trainee teachers agreed a little less often than working teachers with most myths (left/right brain 66% against 72%). Wording: it matters most for multiple intelligences. “Don’t know”: where it was offered, a median of 25% chose it for the sugar statement and 24% for the 10% statement, but only 2% for learning styles: teachers are confident about learning styles and much less sure about the sugar and 10% claims. Table 3 reruns the pooling on subsets of the surveys: for the five myths asked in 30 or more surveys, the pooled share moves by 5 points at most. Each figure is still an average over volunteers, not a census.
The pooled share under different rules
Pooled % agreeing (number of survey samples in brackets). The same random-effects model, run on subsets of the surveys. With "don't know" = surveys that offered that answer; Paper itself = leaves out figures taken from a review table or an abstract.
| Myth | All | Teachers | Trainees | With "don't know" | Paper itself | n of 100+ |
|---|---|---|---|---|---|---|
| Learning styles | 93% (37) | 93% (27) | 93% (10) | 94% (29) | 93% (28) | 92% (27) |
| Multiple intelligences | 92% (5) | 96% (4) | 61% (1) | 92% (5) | 92% (5) | 91% (3) |
| Brain Gym | 79% (35) | 80% (26) | 74% (9) | 77% (29) | 80% (27) | 79% (26) |
| Left/right brain | 70% (38) | 72% (28) | 66% (10) | 71% (29) | 71% (29) | 71% (28) |
| Mozart effect | 51% (6) | 62% (4) | 29% (2) | 61% (3) | 51% (6) | 54% (5) |
| Sugar and attention | 51% (30) | 51% (23) | 52% (7) | 52% (25) | 52% (22) | 52% (23) |
| 10% of the brain | 46% (36) | 47% (26) | 43% (10) | 46% (28) | 44% (27) | 46% (27) |
| Fixed intelligence | 8% (16) | 7% (11) | 10% (5) | 8% (12) | 8% (16) | 8% (10) |
| Enriched environments | 89% (26) | 90% (19) | 86% (7) | 89% (24) | 87% (19) | 90% (19) |
Source: IQ Metrics Research meta-analysis (method below)
12 Every survey, in one table
One row per survey sample, with who was asked and the share agreeing with each myth. The CSV (CC BY 4.0) has one row per survey and myth, with the exact wording, the share who disagreed or said “don’t know”, the 95% interval and the table in the paper where each number is printed.
Every survey sample in the analysis
Click a column heading to sort. % agreeing with each myth; empty = not asked. * = the paper could not be read and its figures are taken from a later paper that tabulated them (Ferrero et al. 2016; Voulgari et al. 2025 for Quebec). † = figures from the abstract (book chapter). The CSV adds each survey's exact wording, the % who disagreed or said "don't know", the 95% interval and where in the paper each number is printed.
| Dekker et al. (2012) [8] | Netherlands | Teachers | 105 | Volunteers | true / false / don’t know | 96 | 82 | 86 | 55 | 46 | 56 | |||
| Dekker et al. (2012) [8] | United Kingdom | Teachers | 137 | Volunteers | true / false / don’t know | 93 | 88 | 91 | 57 | 48 | 95 | |||
| Deligiannidi and Howard-Jones (2015) * [9] | Greece | Teachers | 217 | Not stated | true / false / don’t know | 97 | 56 | 71 | 48 | 45 | 97 | |||
| Gleichgerrcht et al. (2015) * [16] | Argentina | Teachers | 551 | Volunteers | true / false / don’t know | 86 | 73 | 58 | 31 | 56 | 88 | |||
| Gleichgerrcht et al. (2015) * [16] | Chile | Teachers | 598 | Volunteers | true / false / don’t know | 95 | 81 | 81 | 52 | 42 | 99 | |||
| Gleichgerrcht et al. (2015) * [16] | Other Latin America | Teachers | 80 | Volunteers | true / false / don’t know | 86 | 88 | 73 | 55 | 60 | 98 | |||
| Gleichgerrcht et al. (2015) * [16] | Peru | Teachers | 2,222 | Volunteers | true / false / don’t know | 91 | 78 | 75 | 56 | 68 | 91 | |||
| Karakus et al. (2015) * [25] | Turkey | Teachers | 278 | Not stated | true / false / don’t know | 97 | 72 | 79 | 44 | 50 | 87 | |||
| Pei et al. (2015) * [31] | China | Teachers | 238 | Not stated | true / false / don’t know | 97 | 84 | 71 | 62 | 59 | 89 | |||
| Ferrero et al. (2016) [14] | Spain | Teachers | 284 | Volunteers | true / false / don’t know | 91 | 77 | 67 | 34 | 44 | 94 | |||
| Düvel et al. (2017) [10] | Germany | Teachers | 91 | Volunteers | two choices, no “don’t know” | 32 | ||||||||
| Düvel et al. (2017) [10] | Germany | Trainee teachers | 125 | Volunteers | two choices, no “don’t know” | 35 | ||||||||
| Macdonald et al. (2017) [27] | United States | Teachers | 598 | Volunteers | two choices, no “don’t know” | 76 | 89 | 49 | 55 | 50 | 33 | 3 | ||
| Papadatou-Pastou et al. (2017) [30] | Greece | Trainee teachers | 573 | Volunteers | true / false / don’t know | 94 | 37 | 55 | 47 | 90 | ||||
| Varas-Genestier and Ferreira (2017) [39] | Chile | Teachers | 91 | Volunteers | two choices, no “don’t know” | 91 | 90 | 86 | 58 | 4 | 91 | |||
| Falquez Torres and Ocampo Alvarado (2018) [13] | Ecuador | Trainee teachers | 328 | Volunteers | true / false / don’t know | 93 | 76 | 48 | 58 | 30 | 16 | 93 | ||
| Blanchette Sarrasin et al. (2019) * [35] | Canada (Quebec) | Teachers | 972 | Not stated | agree-disagree scale | 74 | 57 | 44 | ||||||
| Grospietsch and Mayer (2019) [17] | Germany | Trainee teachers | 550 | Whole class or cohort | agree-disagree scale | 93 | 92 | 82 | 57 | |||||
| Zhang et al. (2019) [41] | China | Headteachers | 253 | Whole class or cohort | agree-disagree scale | 93 | 79 | 86 | 48 | 52 | 19 | 85 | ||
| Carter et al. (2020) [5] | Australia | Trainee teachers | 1,359 | Whole class or cohort | true / false / don’t know | 77 | 57 | 46 | 24 | 58 | 27 | 81 | ||
| Maureira Cid et al. (2021) [7] | Chile | Trainee teachers | 440 | Volunteers | true / false / don’t know | 93 | 78 | 67 | 47 | 42 | 5 | 93 | ||
| Painemil et al. (2021) [12] | Chile | Trainee teachers | 57 | Volunteers | true / false / don’t know | 98 | 75 | 70 | 51 | 56 | 88 | |||
| Painemil et al. (2021) [12] | Spain | Trainee teachers | 42 | Volunteers | true / false / don’t know | 93 | 55 | 60 | 41 | 33 | 83 | |||
| Jeyavel et al. (2022) [22] | India | Teachers | 503 | Volunteers | true / false / don’t know | 84 | 61 | 54 | 60 | 64 | ||||
| Makhlouf (2022) [2] | Algeria | Teachers | 221 | Volunteers | true / false / don’t know | 92 | 96 | 78 | 46 | |||||
| Mercan et al. (2022) [37] | Israel | Teachers | 72 | Volunteers | true / false / don’t know | 99 | 85 | 53 | 42 | 31 | 13 | 97 | ||
| Mercan et al. (2022) [37] | Turkey | Teachers | 112 | Volunteers | true / false / don’t know | 97 | 83 | 86 | 58 | 26 | 6 | 93 | ||
| Simoes et al. (2022) [3] | Brazil | Teachers and trainees | 1,634 | Volunteers | two choices, no “don’t know” | 36 | 48 | |||||||
| Fatmawati et al. (2023) [23] | Indonesia | Teachers | 102 | Volunteers | true / false / don’t know | 100 | 81 | 84 | 87 | 78 | 36 | 22 | 98 | |
| Novak-Geiger (2023) [34] | Austria | Trainee teachers | 648 | Not stated | true / false / don’t know | 97 | 61 | 88 | 82 | 39 | 44 | 7 | 57 | |
| Sandoval Grajeda et al. (2023) [29] | Mexico | Trainee teachers | 77 | Whole class or cohort | two choices, no “don’t know” | 97 | 84 | 44 | 10 | |||||
| Tunga and Çağıltay (2023) [38] | Turkey | Teachers | 730 | Not stated | true / false / don’t know | 97 | 96 | 84 | 88 | 65 | 64 | 2 | 91 | |
| Vig et al. (2023) [19] | Hungary | Trainee teachers | 822 | Volunteers | agree-disagree scale + “don’t know” | 82 | 81 | 60 | 62 | 48 | 19 | |||
| Luria et al. (2024) [33] | Israel | Teachers | 86 | Volunteers | true / false / don’t know | 93 | 95 | 61 | 49 | 22 | 44 | 6 | 61 | |
| Luria et al. (2024) [33] | Poland | Teachers | 85 | Volunteers | true / false / don’t know | 99 | 92 | 94 | 79 | 66 | 37 | 8 | 39 | |
| Tinterri et al. (2024) † [24] | Italy | Teachers | 6,679 | Not stated | not stated | 90 | 66 | 54 | 47 | 47 | ||||
| Tsang et al. (2024) [18] | Hong Kong | Teachers | 64 | Volunteers | true / false / don’t know | 91 | 69 | 58 | 59 | 6 | ||||
| Kanlı (2025) [15] | Turkey | Teachers | 454 | Volunteers | true / false / don’t know | 93 | 80 | 79 | 46 | 43 | 7 | 91 | ||
| Voulgari et al. (2025) [40] | Greece | Teachers | 82 | Volunteers | true / false / don’t know | 99 | 72 | 72 | 50 | |||||
| Kälbli et al. (2026) [20] | Hungary | Teachers | 734 | Volunteers | agree-disagree scale + “don’t know” | 93 | ||||||||
| Teixeira et al. (2026) [4] | Brazil | Teachers | 130 | Volunteers | two choices, no “don’t know” | 87 | 85 | 62 | 51 | 49 |
Source: IQ Metrics Research compilation, October 2026 (Sources)
13 How we found and pooled the surveys
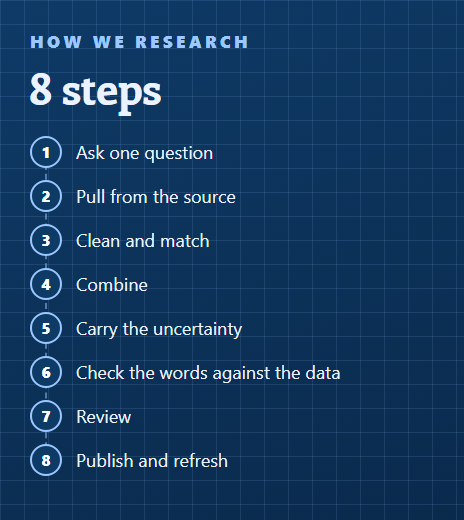
- 01
- 02
Rules
In: a survey of working or trainee school teachers (preschool to secondary), published 2012 or later, that prints the share agreeing with at least one of our statements for a defined sample. Out: university faculty, the general public, counsellors, and samples that cannot be separated from them.
- 03
Reading
Every number was copied from the paper’s own table or text, or computed from the counts it prints, never from news coverage. Two kinds of exception are flagged in the data and tested in Table 3: five papers we could not open whose figures a later paper printed in a table (Gleichgerrcht et al., Karakus et al., Deligiannidi and Howard-Jones and Pei et al. via Ferrero et al. 2016; Blanchette Sarrasin et al. via Voulgari et al. 2025), and one book chapter we could read only in its abstract (Tinterri et al. 2024, 6,679 Italian teachers).
- 04
Matching
Each statement was matched to one myth by its wording, using the Dekker et al. (2012) item where a survey asked several versions. “Agree” means the respondent called the false statement true, or agreed on a scale.
- 05
Pooling
For each myth, a random-effects meta-analysis of proportions: logit-transformed shares, between-survey variance by restricted maximum likelihood, a 95% confidence interval and a 95% prediction interval [51]. Several surveys in one country are pooled the same way.
- 06
Trend
A mixed-effects meta-regression of each myth’s logit share on the year of publication, converted to percentage points per decade at the pooled level.
- 07
Check
A separate script, written independently, recomputed every pooled estimate, interval, country value and figure from the CSV.
Surveys we read but left out, and why
| Survey | Why it is not pooled |
|---|---|
| Canbulat and Kiriktas (2017) | Prints only three short labels with percentages for teachers and candidates combined, no statement wording; its 20% for learning styles is out of line with every other survey and cannot be checked |
| von Hausen et al. (2026) | Per-statement results appear only in a bar chart, not as printed numbers |
| Zambrano et al. (2025) | Full text behind a CAPTCHA; the abstract names the top myths but gives no per-myth percentages |
| Sisman et al. (2025) | Full text behind a bot check; the abstract gives only the order of the top three myths |
| Grospietsch and Mayer (2018) | Course sample at the same university and lab as Grospietsch and Mayer 2019, probably overlapping; the larger 2019 sample is used |
| Hennes et al. (2024) | Full text behind a bot check; the abstract gives no percentages |
| Hermida et al. (2016) | Paywalled; the repository copy did not respond |
| Horvath et al. (2018) | Award-winning teachers from the UK, US and Australia pooled together (not split by country); the comparison group re-uses older published samples |
| Khramova et al. (2023) | Full text behind a bot check; the abstract gives no per-myth percentages |
| Csányi et al. (2025) | Full text behind a CAPTCHA and the accepted version on SSRN behind a bot check; no per-myth percentages in the abstract (its Brain Gym figures appear in the paper on the same sample, Kalbli et al. 2026, which we do use) |
| Adıgüzel et al. (2025) | Questionnaire validation study: no agreement percentages |
| Im et al. (2018) | Prints only the myths that at least half of either group believed, so lower values are missing and pooling them would bias the average upward (kept for the training question) |
| Kim and Sankey (2018) | Paywalled; no copy found |
| Krammer et al. (2019) | Behind a bot check; its Austrian sample enters through the re-analysis by Novak-Geiger 2023, which prints the per-myth table |
| García et al. (2026) | Full text behind a CAPTCHA and the repository copy did not respond; the abstract gives no per-myth percentages |
| Lethaby and Harries (2016) | Paywalled; the percentages circulate only second-hand |
| McMahon et al. (2019) | The only readable copy (the accepted manuscript) has no tables, so no per-myth percentages |
| Morandín Ahuerma et al. (2024) | Only the abstract could be read, and its figures pool students, the public and teachers |
| Janati Idrissi et al. (2020) | Full text behind a CAPTCHA (ScienceDirect); the abstract gives no per-myth percentages |
| Papadatou-Pastou et al. (2021) | Qualitative study of how 123 Greek educators define learning styles (Papadatou-Pastou et al. 2021); no agreement percentages |
| Boyle and Lyddy (2024) | Full text behind a bot check; the abstract gives no percentages |
| Papadatou-Pastou et al. (2018) | 19 teachers answering an open-ended question, not a yes/no statement |
| Chojak et al. (2021) | Same 85 Polish teachers as the Polish sample in Luria, Chojak and Shalom 2024 (identical figures); counted once |
| Opre et al. (2025) | Full text behind a CAPTCHA; the abstract gives no percentages |
| Todor and Igna (2026) | Paper paywalled; the public raw data has no statement wording, so items cannot be matched to myths |
| Poljšak Škraban et al. (2018) | The Slovenian digital library did not respond |
| Fernández et al. (2025) | Prints only average ratings on a 1-6 scale, not the share agreeing (quoted in the text instead) |
| Tovazzi et al. (2020) | Full text behind a bot check; the abstract gives no per-myth percentages |
| “France’s First Look at Neuromyths: Prevalence and Adhesion in Pre-Service Teachers” (2026) | Listed in OpenAlex without a DOI or a link; could not be located |
| Bei, Argiropoulos, Van Herwegen and Incognito (2024), Italy, 820 teachers | Mainly myths about neurodevelopmental disorders; full text behind a CAPTCHA and the repository copy behind a bot check, not read |
| Adiguzel et al. (2025), 11 countries, 1,257 primary teachers | Only the abstract could be read (ScienceDirect CAPTCHA, SSRN bot check); no per-country table. Its headline (over 90% agree with learning styles and multiple intelligences) is quoted in the text |
| Popa (2025), Romania, 1,625 teachers, Educatia 21 | Found late; the PDF link returns 404, so its numbers were not read |
Source: IQ Metrics Research screening, October 2026
- Neuromyth
- A false belief about the brain that grew out of real research, usually by oversimplifying it. The OECD popularised the term in 2002 [42].
- Learning styles
- The idea that each pupil learns best through one sense or mode (visual, auditory or kinesthetic, “VAK”) and should be taught that way. Preferences exist; a benefit from matching has not been shown [43].
- Multiple intelligences
- Howard Gardner’s 1983 theory that people have several separate intelligences (linguistic, logical-mathematical, musical, spatial and others) instead of one general ability.
- Brain Gym
- A commercial programme of simple movements, such as touching the left knee with the right hand, sold as a way to connect the two halves of the brain.
- Random-effects meta-analysis
- A way to average results from several studies that assumes each study measures a slightly different true value, so the pooled interval allows for real differences between surveys.
- Prediction interval
- The range where the result of one new survey would probably fall. It is wider than the confidence interval, which describes the average.
What this study cannot tell you
- Almost every survey used volunteers (online links, school mailings, social media). Teachers interested in the brain may be more likely to answer, so no figure is a national rate.
- Surveys used different answer options (true/false, true/false/don’t know, agreement scales) and different wordings. Each wording is in the data and Table 3 tests the effect, but the pooled figure mixes them.
- Belief is not practice. Several surveys found that teachers who believe a myth do not always use it in class.
- Some papers could not be opened: figures for eight samples come from tables printed in later papers, and the largest recent study (1,257 teachers in 11 countries) published only summary numbers we could read [1].
- The time trend uses the year of publication because most papers do not say when they collected their data; data are usually one to two years older than the paper.
Intelligence can be measured, and it is not fixed.
The IQ Metrics test measures pattern reasoning on your own, with no tools. It is not a learning-styles quiz and it does not sort you into left-brained or right-brained.
Take the IQ testSources
- Trends in Neuroscience and Education 40, 100264. Adiguzel et al.: Belief in neuromyths among primary school teachers: A cross-national study of 11 countries. 2025. doi.org/10.1016/j.tine.2025.100264
- Journal of Languages & Translation, vol. 2, issue 2, pp. 15-39 (Univ. Chlef). Makhlouf: Les neuromythes dans le système éducatif algérien : prévalence chez les enseignants du cycle secondaire : cas de la ville de Blida – Algérie (Neuromyths in the Algerian education system: prevalence among secondary school teachers: case of the city of Blida). 2022. doi.org/10.70204/jlt.v2i2.243
- Brain Sciences. Simoes et al.: Neuroscience Knowledge and Endorsement of Neuromyths among Educators: What Is the Scenario in Brazil?. 2022. doi.org/10.3390/brainsci12060734
- BMC Medical Education. Teixeira et al.: Exploratory study of protective factors against belief in neuromyths in in-service teachers at Brazilian vocational-technical high school. 2026. doi.org/10.1186/s12909-026-09601-0
- Australian Journal of Teacher Education. Carter et al.: Prevalence, Predictors and Sources of Information Regarding Neuromyths in an Australian Cohort of Preservice Teachers. 2020. doi.org/10.14221/ajte.2020v45n10.6
- Frontiers in Psychology. von Hausen et al.: From neuromyths to neuroscience literacy: a cross-domain study of brain misconceptions among educators in Chilean special schools. 2026. doi.org/10.3389/fpsyg.2026.1768430
- Retos. Maureira Cid et al.: Prevalencia de neuromitos en estudiantes de Pedagogía en Educación Física de Chile. 2021. doi.org/10.47197/retos.v42i0.88204
- Frontiers in Psychology. Dekker et al.: Neuromyths in Education: Prevalence and Predictors of Misconceptions among Teachers. 2012. doi.org/10.3389/fpsyg.2012.00429
- Procedia – Social and Behavioral Sciences. Deligiannidi and Howard-Jones: The Neuroscience Literacy of Teachers in Greece. 2015. doi.org/10.1016/j.sbspro.2015.01.1133
- Frontiers in Psychology. Düvel et al.: Neuromyths in Music Education: Prevalence and Predictors of Misconceptions among Teachers and Students. 2017. doi.org/10.3389/fpsyg.2017.00629
- Trends in Neuroscience and Education (article 100273). Zambrano et al.: Prevalence of educational myths among Ecuadorian teachers. 2025. doi.org/10.1016/j.tine.2025.100273
- Revista Electrónica Educare. Painemil et al.: Creencias versus conocimiento en futuro profesorado. Un estudio comparado sobre neuromitos a nivel internacional. 2021. doi.org/10.15359/ree.25-1.13
- Revista Iberoamericana de Educación. Falquez Torres and Ocampo Alvarado: Del conocimiento científico al malentendido. Prevalencia de neuromitos en estudiantes ecuatorianos. 2018. doi.org/10.35362/rie7813241
- Frontiers in Human Neuroscience. Ferrero et al.: Neuromyths in Education: Prevalence among Spanish Teachers and an Exploration of Cross-Cultural Variation. 2016. doi.org/10.3389/fnhum.2016.00496
- REIDOCREA 14(41), 608-619. Kanlı: Prevalence and predictors of educational neuromyths among teachers working with gifted students. 2025. ugr.es/~reidocrea/14-41.pdf
- Mind, Brain, and Education. Gleichgerrcht et al.: Educational Neuromyths Among Teachers in Latin America. 2015. doi.org/10.1111/mbe.12086
- Frontiers in Human Neuroscience. Grospietsch and Mayer: Pre-service Science Teachers' Neuroscience Literacy: Neuromyths and a Professional Understanding of Learning and Memory. 2019. doi.org/10.3389/fnhum.2019.00020
- Trends in Neuroscience and Education (article 100221). Tsang et al.: Educational neuromyths and instructional practices: The case of inclusive education teachers in Hong Kong. 2024. doi.org/10.1016/j.tine.2024.100221
- Journal of Intelligence. Vig et al.: The Prevalence of Educational Neuromyths among Hungarian Pre-Service Teachers. 2023. doi.org/10.3390/jintelligence11020031
- Frontiers in Education. Kälbli et al.: Neuromyths about motor development and coordination among Hungarian teachers: prevalence and associations with completion of motor therapy training. 2026. doi.org/10.3389/feduc.2026.1971180
- PLoS ONE. Im et al.: Taking an educational psychology course improves neuroscience literacy but does not reduce belief in neuromyths. 2018. doi.org/10.1371/journal.pone.0192163
- Frontiers in Education. Jeyavel et al.: Neuromyths in Education: Prevalence Among South Indian School Teachers. 2022. doi.org/10.3389/feduc.2022.781735
- CAHAYA: Journal of Research on Science Education. Fatmawati et al.: Persepsi Guru PAUD Terhadap Mitos Neurosains di Wilayah Lombok dan Bali. 2023. doi.org/10.70115/cahaya.v1i2.42
- book chapter (book title not shown in the repository record). Tinterri et al.: Are You a Left or Right-Brain Type? Persistence of Neuromyths in Italian In-Service Teachers. 2024. uniecampus.unifind.cineca.it/resource/item/90178
- Procedia – Social and Behavioral Sciences. Karakus et al.: Primary and Secondary School Teachers' Knowledge and Misconceptions about the Brain in Turkey. 2015. doi.org/10.1016/j.sbspro.2015.01.858
- Trends in Neuroscience and Education (article 100279). García et al.: Neuroscience beliefs in education among teachers in Argentina and other Latin American countries: predictors and comparisons to experts' perspectives. 2026. doi.org/10.1016/j.tine.2026.100279
- Frontiers in Psychology. Macdonald et al.: Dispelling the Myth: Training in Education or Neuroscience Decreases but Does Not Eliminate Beliefs in Neuromyths. 2017. doi.org/10.3389/fpsyg.2017.01314
- Mind, Brain, and Education. McMahon et al.: The Impact of a Modified Initial Teacher Education on Challenging Trainees' Understanding of Neuromyths. 2019. doi.org/10.1111/mbe.12219
- RECIE. Revista Electrónica Científica de Investigación Educativa. Sandoval Grajeda et al.: Prevalencia de neuromitos en maestros en formación de octavo semestre. 2023. doi.org/10.33010/recie.v7i0.1754
- Frontiers in Psychology. Papadatou-Pastou et al.: Brain Knowledge and the Prevalence of Neuromyths among Prospective Teachers in Greece. 2017. doi.org/10.3389/fpsyg.2017.00804
- Procedia – Social and Behavioral Sciences. Pei et al.: Teachers' Understanding about the Brain in East China. 2015. doi.org/10.1016/j.sbspro.2015.01.1091
- Prima Educatione. Chojak et al.: Neuromyths among Polish Teachers – Research Results and Practical Implications. 2021. doi.org/10.17951/pe.2021.5.115-131
- Edukacja Międzykulturowa (Intercultural Education in Poland and Worldwide) 2024, no. 4 (27), pp. 54-68. Luria et al.: A comparative study of Polish and Israeli teachers' attitudes toward neuromyths in education. 2024. doi.org/10.15804/em.2024.04.04
- Frontiers in Psychology. Novak-Geiger: Prevalence of neuromyths among psychology students: small differences to pre-service teachers. 2023. doi.org/10.3389/fpsyg.2023.1139911
- Mind, Brain, and Education. Blanchette Sarrasin et al.: Neuromyths and Their Origin Among Teachers in Quebec. 2019. doi.org/10.1111/mbe.12193
- Teaching and Teacher Education 165, 105132. Fernández et al.: Beyond neuromyths: Examining in-service teachers' misconceptions about teaching and learning. 2025. doi.org/10.1016/j.tate.2025.105132
- Journal of Interdisciplinary Education: Theory and Practice. Mercan et al.: A Comparative Study about High School Teachers' Neuromyths in Turkey and Israel. 2022. doi.org/10.47157/jietp.1141184
- Education and Science (Eğitim ve Bilim). Tunga and Çağıltay: Myths or Facts: Prevalence, and Predictors of Neuromyths among Turkish Teachers. 2023. doi.org/10.15390/EB.2023.12089
- Estudios Pedagógicos. Varas-Genestier and Ferreira: Neuromitos de los profesores chilenos: orígenes y predictores. 2017. doi.org/10.4067/s0718-07052017000300020
- Review of Science, Mathematics and ICT Education 19(2), 69-85. Voulgari et al.: Neuromyths in Greek primary teachers and their sources. 2025. doi.org/10.26220/rev.5248
- Frontiers in Education. Zhang et al.: Neuromyths in Chinese Classrooms: Evidence From Headmasters in an Underdeveloped Region of China. 2019. doi.org/10.3389/feduc.2019.00008
- OECD Publishing, Paris. OECD: Understanding the Brain: Towards a New Learning Science. 2002. doi.org/10.1787/9789264174986-en
- Psychological Science in the Public Interest 9(3), 105-119. Pashler, McDaniel, Rohrer and Bjork: Learning Styles: Concepts and Evidence. 2008. doi.org/10.1111/j.1539-6053.2009.01038.x
- Educational Psychologist 41(4), 207-225. Waterhouse: Multiple Intelligences, the Mozart Effect, and Emotional Intelligence: A Critical Review. 2006. doi.org/10.1207/s15326985ep4104_1
- Psychological Science 29(8), 1358-1369. Ritchie and Tucker-Drob: How Much Does Education Improve Intelligence? A Meta-Analysis. 2018. doi.org/10.1177/0956797618774253
- Intelligence 38(3), 314-323. Pietschnig, Voracek and Formann: Mozart effect-Shmozart effect: A meta-analysis. 2010. doi.org/10.1016/j.intell.2010.03.001
- Nature Reviews Neuroscience 15(12), 817-824. Howard-Jones: Neuroscience and education: myths and messages. 2014. doi.org/10.1038/nrn3817
- Frontiers in Education 5, 602451. Newton and Salvi: How Common Is Belief in the Learning Styles Neuromyth, and Does It Matter? A Pragmatic Systematic Review. 2020. doi.org/10.3389/feduc.2020.602451
- Frontiers in Psychology 11, 591923. Torrijos-Muelas, Gonzalez-Villora and Bodoque-Osma: The Persistence of Neuromyths in the Educational Settings: A Systematic Review. 2021. doi.org/10.3389/fpsyg.2020.591923
- Frontiers in Education 6, 665752. Grospietsch and Lins: Review on the Prevalence and Persistence of Neuromyths in Education – Where We Stand and What Is Still Needed. 2021. doi.org/10.3389/feduc.2021.665752
- Journal of the Royal Statistical Society: Series A 172(1), 137-159. Higgins, Thompson and Spiegelhalter: A re-evaluation of random-effects meta-analysis. 2009. doi.org/10.1111/j.1467-985X.2008.00552.x
- Nature 365, 611. Rauscher, Shaw and Ky: Music and spatial task performance. 1993. doi.org/10.1038/365611a0
Version history
- 2026.1022 October 2026First release: 41 survey samples from 33 papers in 25 countries, each checked against the paper.
Leon Falkner, Data & Research Analyst. Leon owns the arithmetic on IQ Metrics: the percentile tables, the score converter and the figures in everyone else's drafts. On the research desk Leon pulls the data, builds each index and writes the method. More about Leon.
Questions
What is a neuromyth?
A false belief about the brain that grew out of real research, usually by oversimplifying it, such as "we only use 10% of our brain" or "pupils learn best in their own learning style". The OECD popularised the term in 2002.
What is the most common neuromyth among teachers?
Learning styles. Pooled across 37 surveys, 93% of teachers and trainee teachers agreed that pupils learn better when taught in their preferred learning style.
Do teachers believe we only use 10% of our brain?
About half do: 46% pooled across 36 surveys, from 26% to 68% in single surveys. The claim is false; the whole brain is active over a day.
Is learning styles theory true?
People have preferences, but experiments have not shown that teaching to a preferred style helps them learn. A 2008 review found almost no studies able to test it, and those that could did not support it.
Do teachers think intelligence is fixed?
Mostly not: only 8% agreed that mental capacity is hereditary and cannot be changed. That is correct, since education raises IQ by about 1 to 5 points per year.
Does neuroscience training reduce neuromyths?
Somewhat. In a US survey, adults with many neuroscience courses believed the 10% and left-brain myths less often than educators, but not learning styles. Lessons that tackle the myths directly cut belief in learning styles roughly in half.
Share it, cite it, download it
You may reuse everything on this page under CC BY 4.0: in articles, reports, lessons and posts. The one condition is credit to IQ Metrics with a link to this page.
Cite this study
Version 2026.10. Citing the version lets readers find the exact numbers.
Archived copy with a DOI: 10.5281/zenodo.23559576 (report PDF and data on Zenodo).
Falkner, L. (2026). What teachers believe about the brain: neuromyths by country (Version 2026.10) [Data set]. IQ Metrics Research. https://iqmetrics.org/research/neuromyths-by-country/ (DOI: 10.5281/zenodo.23559576)
Falkner, Leon. "What teachers believe about the brain: neuromyths by country." IQ Metrics Research, 22 Oct. 2026, iqmetrics.org/research/neuromyths-by-country/. DOI: 10.5281/zenodo.23559576.
Falkner, Leon. "What teachers believe about the brain: neuromyths by country." IQ Metrics Research. October 22, 2026. https://iqmetrics.org/research/neuromyths-by-country/. DOI: 10.5281/zenodo.23559576.
@misc{iqmetrics2026neuromythsbycountry, author = {Falkner, Leon}, title = {What teachers believe about the brain: neuromyths by country}, institution = {IQ Metrics}, year = {2026}, version = {2026.10}, doi = {10.5281/zenodo.23559576}, url = {https://iqmetrics.org/research/neuromyths-by-country/} }
Source: Leon Falkner, "What teachers believe about the brain: neuromyths by country." IQ Metrics Research, version 2026.10, https://iqmetrics.org/research/neuromyths-by-country/ (DOI 10.5281/zenodo.23559576)
Embed the numbers
Paste this into your page or post. It lists the pooled shares and credits the source.
Get the data
One row per survey sample and myth: the paper, DOI, country, who was asked (working or trainee teachers), sample size, how they were recruited, the answer format, the exact statement, the share agreeing with its 95% interval, the share disagreeing or unsure, and where in the paper each number is printed.
| Column | What it holds |
|---|---|
myth, myth_label, wording | Which myth, and the survey's exact statement |
citation, year, doi | The paper (year published) and its DOI |
country, iso3, region, group, level, n_sample, n | Where, who (working or trainee teachers, school level), the sample size and how many answered that statement |
year_data, sampling, format, fmt_class | When the data were collected (if stated), how people were recruited, the answer options, and their class: 3opt = true / false / do not know, 2opt = two choices only, likert = agreement scale, likert_dk = agreement scale with do not know, other = not stated |
pct, ci_lo, ci_hi | Share agreeing (%) and its Wilson 95% interval |
pct_reject, pct_dk | Share disagreeing and share answering "don't know" or neutral, when printed |
where, source_access, computed | Table or page in the paper; primary paper or a later review; whether we computed the % from counts |
For journalists, researchers and teachers
Everything on this page may be quoted, charted and republished with credit. No embargo, no permission needed, no sign-up. If you know of a survey we missed, tell us and we will add it in the next version.
Summary you can paste
Plain news style. Edit freely; keep the credit.
Nine in ten teachers still believe in learning styles, according to an IQ Metrics Research meta-analysis of 41 published surveys of 23,424 teachers and trainee teachers in 25 countries, 2012 to 2026. Pooled, 93% agreed that pupils learn better when taught in their preferred learning style, 79% backed Brain Gym-style coordination exercises, 70% the left-brain/right-brain idea and 46% the claim that we use only 10% of our brain. Only 8% agreed that intelligence is fixed. There is no clear sign of a decline since 2012. Source: IQ Metrics Research, https://iqmetrics.org/research/neuromyths-by-country/
Angles for a story
- The myth that will not die: about nine in ten teachers, in every country surveyed, believe in learning styles (the numbers).
- Half of teachers think we use 10% of our brain, and where (Figure 3).
- The intelligence paradox: teachers reject “fixed IQ” but embrace multiple intelligences and the Mozart effect (myths about intelligence).
- Does neuroscience training help? Courses cut some myths and not others (the training gap).
- Fourteen years of surveys, no clear decline (the trend).
Quotes you can use
Attributable as written, with the name and title. For a different angle or a quote on a specific figure, ask through the contact page.
Learning styles is the most believed brain myth among teachers. Across 37 surveys from 2012 to 2026, about nine in ten agreed with it, and the share has not clearly fallen.
Leon Falkner, Data & Research Analyst, IQ Metrics ResearchTeachers mostly reject the idea that intelligence is fixed, which is right. But many still believe in multiple intelligences and the Mozart effect, two ideas intelligence research does not support.
Leon Falkner, Data & Research Analyst, IQ Metrics ResearchKnowing more about the brain is not enough. In the first surveys, teachers who knew more brain facts believed more myths. What seems to work is teaching the myths directly.
Leon Falkner, Data & Research Analyst, IQ Metrics Research
Files
- CSV, one row per survey and myth (CC BY 4.0)
- Every figure as a print-ready PNG: white background, 2000 px wide, title and source line included. Use the Image button under each figure
- Share images for social media in three sizes, with the credit line built in
- Citations in APA, MLA, Chicago, BibTeX and plain text, and embed code for the numbers
Terms, contact and corrections
Credit: “IQ Metrics Research, Neuromyths by country 2026” with a link to this page. On air or in print, “IQ Metrics” and the page address are enough.
The surveys are other researchers’ work: cite each one as listed in Sources. The compilation, matching and pooling are ours.
Corrections: made on this page with a dated note in the version history. Contact the research team through the contact page.
Please do not present a country figure as a national rate: the surveys used volunteers.