



CAT4 Scores Explained: SAS, Stanines, Good Scores and the 141 Cap
GL Assessment prints CAT4 results as a Standard Age Score with an average of 100 and a standard deviation of 15, from 59 to 141, then folds them into stanines. Its own table starts the top 4 per cent at 127, and schools use their own gifted and talented lines, from stanine 8 to a SAS of 130.

What you need to know
- CAT4 reports a Standard Age Score for each of four batteries (verbal, quantitative, non-verbal, spatial). GL says the average for each age group is set to 100 and the standard deviation to 15, and its stanine table calls 89 to 111 average, 112 to 126 above average and 127 or more very high, the top 4 per cent.
- A battery can report 59 to 141 at levels Pre-A to G and 69 to 131 at levels X and Y, so 150 is impossible, though a footnote elsewhere says 60 to 140. GL publishes no gifted cut-off; schools use a stanine of 8 or more, a SAS of 120 or 125, or 130 and above. GL's own standard error of measurement is 5.0 to 6.0 for a battery.
- GL does not use the sentence "CAT4 is not an IQ test": it says stanines avoid the impression of IQ scores, while its guide to reports calls the non-verbal battery most like a typical IQ test. Its technical reports never mention IQ or Wechsler, and report a two-year correlation of 0.88 between Level D and Level F (3,883 students).
- The norms come from a standardisation in September to December 2011 on 24,708 pupils (levels X and Y in 2014), so a score compares a pupil with that population, not with today's. The overall score is an average of four SAS, not a SAS, with a smaller spread (about 12 at levels X and Y).
CAT4 results come as a Standard Age Score (SAS) for each of four batteries, on a scale where the average for every age group is 100 and the standard deviation is 15. On GL Assessment's own table, 89 to 111 is the average band, 112 to 126 is above average and 127 or more is stanine 9, the top 4 per cent. A single battery can report no lower than 59 and no higher than 141 (69 to 131 on the youngest levels, X and Y), so a CAT4 score of 150 cannot exist. CAT4 is not presented as an IQ test, yet its scale looks like one, and GL's own guide to reports says the non-verbal battery "is most like a typical IQ test". This guide gives the stanine table, what a good score is, what an SAS of 114, 120, 127, 130 or 141 each means, how accurate a score is, what schools use as a gifted and talented line, and where the resemblance to IQ stops.
What does CAT4 measure and who sits it?
The Cognitive Abilities Test, Fourth Edition, is published by GL Assessment. It has four batteries: verbal reasoning, which GL describes as thinking with words; quantitative reasoning, thinking with numbers; non-verbal reasoning, thinking with shape (2D shapes, in GL's guide to reports); and spatial reasoning, thinking with shape and space (3D shapes). GL's product page says it is for pupils aged 6 to 17 and over, with two 30-minute tests for ages 6 to 8 and three 45-minute tests from 8 upwards (2 hours 15 minutes in all), online on a computer or tablet or on paper, at any point in the year. On levels A to G the digital version has eight tests, two per battery, taken in three parts of 30, 41 and 41 minutes.
CAT4 comes in levels X, Y, Pre-A and A to G, matched to age. In England and Wales GL's UK teacher guidance matches them to year groups like this:
- Level X: ages 6:00 to 7:11, Year 2. Level Y: 7:01 to 8:11, Year 3. Level Pre-A: 6:06 to 8:11, Year 3
- Level A: 7:06 to 9:11, Year 4. Level B: 8:06 to 10:11, Year 5. Level C: 9:06 to 11:11, Year 6
- Level D: 10:06 to 12:11, Year 7. Level E: 11:06 to 13:11, Year 8
- Level F: 12:06 to 15:11, Years 9 and 10. Level G: 14:06 to 17:00 and over, Years 11 and 12
Level D is the one most parents meet, because some schools give CAT4 to all Year 7 students in their first week, as one of GL's own case studies describes. A pupil outside a level's age range is scored at the nearest limit: a Level B pupil aged 11:06 receives scores based on the upper age limit of 10:11.
What is a Standard Age Score?
GL's teacher guidance says the average for each age group is set to 100 and the standard deviation to 15. A standard deviation is the typical distance of a score from the average, so on this scale about two-thirds of pupils score between 85 and 115 (GL says approximately 68 per cent, with approximately 95 per cent between 70 and 130). A score compares a pupil with others of the same age in years and months, not with the whole cohort, and GL also reports a national percentile rank: a pupil on the 84th percentile has scored equal to or better than 84 per cent of the same age band.
Our z-score guide shows the arithmetic, and the percentile calculator gives the same percentile for a SAS as for an IQ with the same mean and spread, so a SAS of 120 is about the 91st percentile. Another entrance test that reports a Standardised Age Score against a selective norm group is explained in our guide to ISEB Common Pre-Test scores.
What do CAT4 stanines mean?
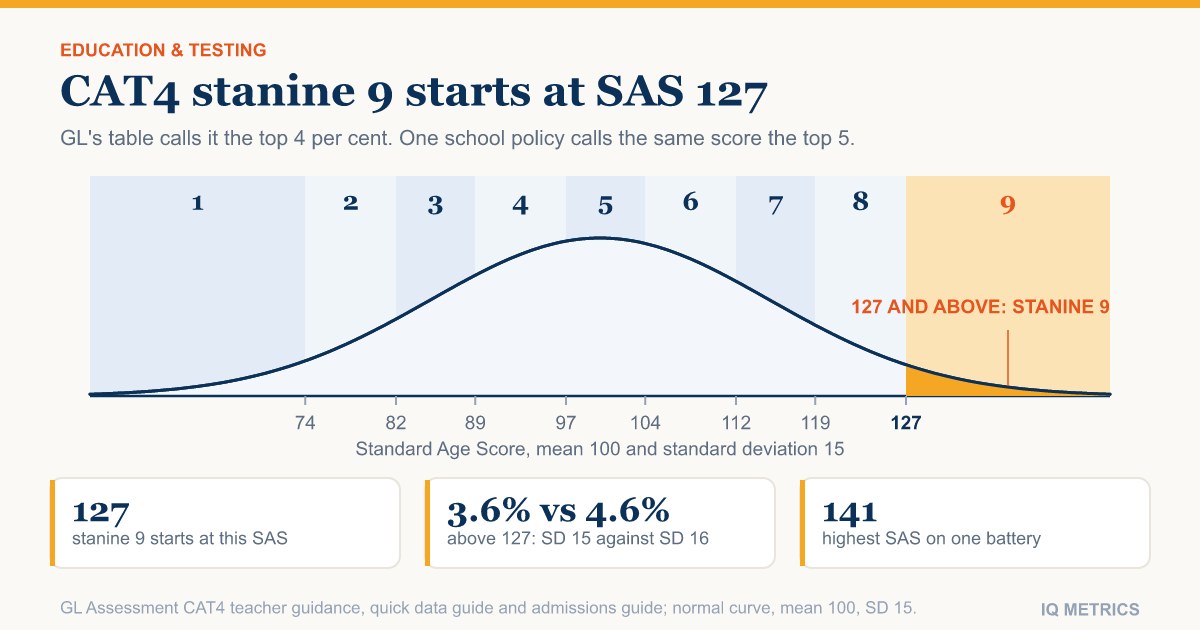
Stanines cut the scale into nine bands, so a report shows one digit instead of a number with a false air of precision. GL's quick data guide gives the table below. Its bands are our reading of the merged cells in that table, and GL's admissions guide confirms that its average category runs from 89 to 111.
- Stanine 9: SAS 127 and above, top 4 per cent (percentile 97 and over), very high
- Stanine 8: SAS 119 to 126, 7 per cent (percentile 90 to 96), above average
- Stanine 7: SAS 112 to 118, 12 per cent (percentile 78 to 89), above average
- Stanine 6: SAS 104 to 111, 17 per cent (percentile 59 to 77), average
- Stanine 5: SAS 97 to 103, 20 per cent (percentile 41 to 58), average
- Stanine 4: SAS 89 to 96, 17 per cent (percentile 23 to 40), average
- Stanine 3: SAS 82 to 88, 12 per cent (percentile 12 to 22), below average
- Stanine 2: SAS 74 to 81, 7 per cent (percentile 5 to 11), below average
- Stanine 1: SAS 73 and below, 4 per cent (percentile 4 and below), very low
We checked the table against the bell curve. Cutting a normal curve with mean 100 and SD 15 at the stanine boundaries puts them at SAS 73.7, 81.6, 88.9, 96.2, 103.8, 111.1, 118.4 and 126.3, and GL's bands are those figures rounded to the next whole score. So the table is standard stanine arithmetic and holds no CAT4-specific surprise.
What is a good CAT4 score?
There is no single answer, because GL publishes bands and leaves the threshold for any decision to schools. On GL's bands a stanine of 9 is very high, 7 and 8 are above average, 4 to 6 are average (SAS 89 to 111), 2 and 3 are below average and 1 is very low. GL's admissions guide says a sample pupil who is above average in all four batteries and very high in verbal and spatial "should be considered" for a school's gifted and talented policy, but we found no GL cut-off for that, and the same paragraph warns about a large gap between the verbal and non-verbal scores.
What do specific CAT4 scores mean: 114, 120, 127, 130, 131, 134, 140, 141?
Parents most often ask about a number printed on a report. The percentiles below come from the normal curve with a mean of 100 and a standard deviation of 15 (our arithmetic, as the percentile calculator returns); the stanine and label are GL's table. Each is a single battery.
- SAS 100: the 50.0th percentile (top 50.0%), stanine 5, average
- SAS 111: the 76.8th percentile (top 23.2%), stanine 6, average, the top of the average band
- SAS 114: the 82.5th percentile (top 17.5%), stanine 7, above average
- SAS 120: the 90.9th percentile (top 9.1%), stanine 8, above average
- SAS 126: the 95.8th percentile (top 4.2%), stanine 8, above average, the top of stanine 8
- SAS 127: the 96.4th percentile (top 3.6%), stanine 9, very high
- SAS 130: the 97.7th percentile (top 2.3%), stanine 9, very high
- SAS 131: the 98.1st percentile (top 1.9%), stanine 9, very high, and the highest SAS reportable at levels X and Y
- SAS 134: the 98.8th percentile (top 1.2%), stanine 9, very high
- SAS 140: the 99.6th percentile (top 0.4%), stanine 9, very high, the upper limit in GL's footnote
- SAS 141: the 99.7th percentile (top 0.3%), stanine 9, very high, the highest SAS reportable at levels Pre-A to G
- SAS 150: cannot be reported on any level, because it is above the 141 limit
Those single-battery figures differ from a school's "overall" or "mean" score. GL says the mean CAT4 score is not a Standard Age Score but an average of the four batteries, and that its standard deviation is around 12 (GL states this in its Level X and Y section, so for the other levels the figure is our assumption). An average of correlated scores spreads less than any one of them, so a mean of 130 is rarer than a battery of 130: on that assumption a mean of 130 is about the top 0.6 per cent, a mean of 125 about the top 1.9 per cent and a mean of 120 about the top 4.8 per cent, against 2.3 per cent for one battery at 130. A threshold quoted for the mean asks for something much rarer than the same number on one battery.
What CAT4 score do schools use for gifted and talented?
GL publishes no gifted cut-off, and its guidance says only that a pupil who is above average across the batteries should be considered. Schools set their own, and they mix scales. Three published examples show the spread:
- Sir John Lawes School, Harpenden (England): students achieving an average CATs stanine of 8 or more are identified as More Able. On GL's table stanine 8 begins at SAS 119
- GEMS World Academy, Dubai (2023/24 policy): "A gifted student will typically achieve a CAT4 Standard Age Score (SAS) of 120 +, and/or 125+ in one or more sections"
- Global Indian International School, Dubai (2025 policy): a CAT4 score of 120 to 129 in one or more areas is "highly able" when attainment is below expectation; 130 or above with attainment in line or above is "gifted and talented"
These are school policies, not GL rules, and none is a national standard. They also sit on one side of a trap the scale sets. GL's table puts 127 at the top 4 per cent, and on our arithmetic a SAS of 127 with SD 15 is the 96.4th percentile, the top 3.6 per cent. The same number on a scale with SD 16, such as the CogAT's, is the 95.4th percentile, the top 4.6 per cent, which is one reason a threshold should always be read with its scale. Our guides to CogAT and NNAT scores and to SD 15 against SD 16 cover the difference.
A CAT4 standard age score of 127 is the top 3.6 per cent on GL's SD-15 scale, and the same number is the top 4.6 per cent on an SD-16 scale, so a cut-off means little without its scale.
What is the highest CAT4 score? Can you score 141 or 150?
GL's UK teacher guidance puts it plainly: "While levels X and Y have limits of 69 – 131, levels Pre-A to G have limits of 59 – 141." The youngest levels are less reliable at the extremes, GL explains, because their tests are shorter. So 141 is the highest SAS on a single battery, reachable at Levels Pre-A to G, and 131 at Levels X and Y. A SAS of 150, or anything from 142 to 149, can never appear on a CAT4 report, so a quoted CAT4 score above 141 is not a SAS from a GL report. A footnote in the same document says that over 99 per cent scored between 60 and 140, so GL's own text differs by a point on the limits; the explicit paragraph is the one to rely on. Because an average of four batteries cannot exceed the highest of them, 141 is also the ceiling for the mean.
One detail from GL's own case study: it describes a pupil with an SAS of 141 as stanine 9 and "a percentile rank of 100, meaning he is in the top 1% of the national population". On the normal curve 141 is the 99.7th percentile, so a top 0.3 per cent, and the "top 1%" there is a loose way of saying very high.
How accurate is a CAT4 score?
Every score has a margin of error. GL's technical report gives the reliability of the batteries (Cronbach's alpha, averaged across levels) as 0.89 for verbal, 0.88 for quantitative, 0.87 for non-verbal and 0.84 for spatial, and 0.95 for the overall score, and says values above 0.80 are considered very good. It also gives the standard error of measurement (SEM, the typical distance between an observed score and the score the pupil would average over many sittings): 5.0, 5.2, 5.4 and 6.0 SAS points for verbal, quantitative, non-verbal and spatial, and 3.4 for the overall score. GL publishes 68 per cent and 90 per cent bands, not a 95 per cent band:
- 68 per cent band: a verbal SAS of 100 has a true score between 95 and 105 (plus or minus the SEM of 5.0)
- 90 per cent band: about plus or minus 8 for verbal, 9 for quantitative, 9 for non-verbal, 10 for spatial and 6 for the overall score. A verbal SAS of 100 has a true score between 92 and 108
- 95 per cent band (our arithmetic, 1.96 times the SEM): about plus or minus 9.8, 10.2, 10.6 and 11.8 for the four batteries and 6.7 for the overall score
- Difference between two scores: GL puts the SEM of a difference at about 7 points, so two scores 11 points apart have a 90 per cent chance of being a real difference
Read that way, a quantitative SAS of 114 cannot be reliably told apart from a 120, because the 90 per cent band around 114 runs from about 105 to 123. Scores also move over time. In a study of 3,883 students who took Level D and then Level F two years later, the correlation of the mean SAS across the two occasions was 0.88; 62 per cent of students had mean scores within 5 SAS points, and 90 per cent within 10 points. Our guide to the IQ score margin of error shows how to read a score as a range.
Is CAT4 an IQ test?
In the GL documents we read, the sentence "CAT4 is not an IQ test" never appears. Its guidance calls CAT4 a measure of ability, not attainment, and says stanines avoid "the erroneous impression of being 'IQ scores', sometimes attributed to SAS". Yet its guide to reports says of the non-verbal battery that it "is most like a typical IQ test", and the SAS uses the same scale as IQ, a mean of 100 and a standard deviation of 15. We found no comparison of CAT4 with a Wechsler scale in any GL guide or technical report, and neither technical report uses the word IQ. MAP Growth, an achievement test many US schools use, reports percentiles on its own RIT scale; see what is a good MAP Growth score.
What GL does publish is prediction. It reports correlations of the mean CAT4 score with Key Stage 2 results of 0.70 for maths, 0.67 for reading and 0.66 for grammar, punctuation and spelling, so CAT4 tracks attainment closely without being the same thing. The technical report says the tests were standardised between September and December 2011 on 24,708 pupils in England, Wales, Scotland and Northern Ireland, weighted to correct for sample bias, with levels X and Y standardised in May and June 2014. GL's product page adds that results are verified every year on a quarter of a million students. Our piece on the Flynn effect and expiring norms explains why the age of a norm sample matters.
What do schools do with a CAT4 profile?
Beyond the scores, GL reports a learning profile that compares the verbal and spatial batteries, with seven categories from extreme verbal bias through no bias to extreme spatial bias. Schools use the profile and the stanines to set targets and to decide who gets extra challenge or extra support. A stanine is a coarse measure, and our guide to IQ score margin of error shows why a single score should be read as a range. For the wider picture of how UK selective tests use the same style of standard score, see our guide to 11+ standardised scores and IQ.
What should parents do with a CAT4 report?
Ask the school which battery or batteries and which stanine or SAS threshold it uses for any decision, and which level and date the test was taken. Read the report as a profile, not a rank, and keep the age of the norms in mind. Do not convert a SAS to an IQ, since the two are on the same scale but were not normed on the same people. Practice on the same kinds of reasoning is possible with our verbal, numerical and spatial tests and our culture-fair test for non-verbal reasoning, and our IQ test for ages 8 to 12 is built for the same age band. Our guide to reading an IQ test report covers the rest.
Where would your own score land?
Curious how a standard score looks on the IQ scale? Take the IQ Metrics test and see your score with its percentile.
Find your IQ score now! →A CAT4 standard age score is a statement about rank among pupils of the same age on 2011 norms, not a fixed trait and not an IQ. The IQ Metrics test reports its score on the IQ scale with the percentile beside it, and the bell curve page shows where each band sits. Another UK selection test, the UCAT, reports deciles among applicants rather than an IQ-style scale; see our guide to UCAT scores.
Common questions
What is a good CAT4 score?
On GL's bands a Standard Age Score of 100 is average, 89 to 111 is the average band, 112 to 126 is above average and 127 or more is very high (stanine 9, the top 4 per cent). What counts as good for a place or programme is set by the school.
What is the highest CAT4 score?
141 on a single battery at levels Pre-A to G, and 131 at levels X and Y. GL's teacher guidance gives limits of 59 to 141 and 69 to 131, so a CAT4 score of 150 can never be reported. A footnote elsewhere in the same guidance says 60 to 140.
What does a CAT4 score of 114, 120 or 130 mean?
On the normal curve with a mean of 100 and a standard deviation of 15, a SAS of 114 is the 82.5th percentile (stanine 7, above average), 120 is the 90.9th (stanine 8, above average) and 130 is the 97.7th (stanine 9, very high). Each carries a margin of error of about 8 to 10 points at 90 per cent confidence on a single battery.
Is CAT4 an IQ test?
Not as GL describes it. GL calls CAT4 a measure of ability and says stanines avoid the impression of being IQ scores, though its guide to reports says the non-verbal battery is most like a typical IQ test. The SAS uses the same scale as IQ, a mean of 100 and a standard deviation of 15, but GL publishes no comparison with a Wechsler IQ test.
What CAT4 score counts as gifted?
GL publishes no gifted cut-off, and schools set their own: for example a stanine of 8 or more, a SAS of 120 or 125 in a section, or 130 and above. These are school policies, not GL rules.
What is stanine 9 on CAT4?
A Standard Age Score of 127 or above, the top 4 per cent by GL's table (percentile 97 and over). On the normal curve 127 is the 96.4th percentile, the top 3.6 per cent.
How accurate is a CAT4 score?
GL gives a standard error of measurement of 5.0 to 6.0 points for a single battery and 3.4 for the overall score, which makes the 90 per cent band about plus or minus 8 to 10 points for one battery and 6 for the overall score. Over two years, 62 per cent of pupils' mean scores stayed within 5 points and 90 per cent within 10.
Which CAT4 level is for Year 7?
Level D, for ages 10:06 to 12:11, is matched to Year 7 in England and Wales. Level E is for Year 8, Level F for Years 9 and 10, and Level G for Years 11 and 12.
Sources for this story
- CAT4 Teacher Guidance, UK and Ireland edition (PDF) — GL Assessment
- CAT4 UK technical report (PDF) — GL Assessment
- CAT4 quick data guide, guide to admissions and guide to reports (PDF) — GL Education
- CAT4 product page: levels, timing and standardisation — GL Assessment
- Gifted and talented policies: GEMS World Academy Dubai (2023/24), Global Indian International School Dubai (2025) and Sir John Lawes School — School websites
Corrections: spotted an error? Email corrections@iqmetrics.org and we will update this story and note the change here.
Related stories
All news →
11+ Standardised Scores vs IQ: Why a 121 Is Not an IQ of 121
Buckinghamshire says a standardised score of 121 qualifies a child and expects about 37% of children to reach it. On an IQ-style curve, 121 is the top 8%.
Why a CogAT 132 and an NNAT 132 Are Not the Same Score
The two tests American schools use most to screen for gifted programmes print their results on scales that differ by one point of standard deviation. At the level where cutoffs are set, that moves the same printed number by most of a percentile.

SSAT Percentile Chart 2026-27: Scores by Grade and the IQ Question
The SSAT percentile is a rank among first-time takers in the same grade, not a mark out of 100. In the 2026-27 guide a grade 8 student needs a total of about 2013 of 2400 for the 50th percentile and 2343 for the 99th. The test does not claim to measure IQ.
Read the research.
Then find your own number.
Our IIF-certified assessment reports your score with its scale, percentile and confidence range — and a breakdown of the cognitive domains behind it.
Start IQ Test →