
Is America losing the lead in brain science? US vs China neuroscience, 2000 to 2026
We counted every neuroscience paper in OpenAlex by country from 2000 to 2026, with the most-cited papers and the joint ones, and read the official money of the Human Brain Project, the BRAIN Initiative and China’s brain project.

By Leon Falkner, Data & Research Analyst · Reviewed by Aarav Vardhan, Editor-in-Chief · Published 9 November 2026 · 14 min read
About this study
- Report type
- Data study: our own count of open bibliographic data, plus official budget documents
- Data
- 1,690,202 neuroscience papers in OpenAlex, 2000-2026, by author country (whole counting); 17 budget figures from official sources
- Countries
- Every country with a neuroscience paper (158 in 2025); the United States and China in detail
- Years
- 2000 to 2026; as of 9 November 2026
- Licence
- CC BY 4.0 (our dataset and charts); OpenAlex data CC0
- Version
- 2026.11
- Sources
- 22
No, not yet: in 2025 the United States published 18,520 neuroscience papers and China 14,534, 78% as many, and the US still leads the most-cited papers 393 to 240. China was 14th in 2000 and has been 2nd since 2013. OpenAlex counts, 2000-2026, IQ Metrics Research, as of 9 November 2026.
01 Key findings
- China has not passed the US in neuroscience. 18,520 US papers vs 14,534 Chinese in 2025 (78.5%); in 2026 so far China is at 89.7%, the closest yet.OpenAlex; IQ Metrics count
- The US lead is wider at the top. 393 vs 240 papers in the top 1% most cited in 2025; China is 2nd there since 2022.OpenAlex citation percentiles
- Neuroscience is the exception. China has out-published the US across all sciences every year since 2022; in neuroscience it is at 78%.OpenAlex; IQ Metrics calculation
- From 14th to 2nd. China ranked 14th in 2000 and has been 2nd every year since 2013; its count grew 29-fold.OpenAlex; IQ Metrics ranks
- Fewer joint papers. US-China co-authored papers peaked at 1,232 in 2018; the share of China’s papers with a US author fell from 18.5% to 7.4%.OpenAlex
- The money is not comparable. BRAIN: $321 million at NIH in FY2025; Human Brain Project: €381 million in EU grants over 10 years; China’s 2021 call: 3.148 billion yuan.NIH; CORDIS; MOST
02 Statistics to quote
neuroscience papers with at least one US author in 2025, the most of any country.
OpenAlex; IQ Metrics countneuroscience papers with at least one author in China in 2025, 78.5% of the US count, up from 493 in 2000.
OpenAlex; IQ Metrics countChina’s neuroscience paper count as a share of the US count in 2026 so far (to 9 November), the closest yet.
OpenAlex; IQ Metrics calculationneuroscience papers in the top 1% most cited of their year: United States vs China, 2025.
OpenAlex; IQ Metrics countChina’s rank in neuroscience papers, 2000 to 2013; 2nd every year since 2013.
OpenAlex; IQ Metrics ranksUS share of the world’s neuroscience papers with a known author country, 2000 to 2025; China: 1.8% to 21.5%.
OpenAlex; IQ Metrics calculationthe year from which China has published more papers than the United States across all sciences every year (first, briefly, in 2011); in neuroscience it has not.
OpenAlex; IQ Metrics calculationaverage growth of China’s neuroscience papers, 2020-2025; the US count changed -0.2% a year.
OpenAlex; IQ Metrics calculationUS-China co-authored neuroscience papers in 2018, the peak; 1,080 in 2025.
OpenAlex; IQ Metrics countneuroscience papers per million people in Switzerland in 2025, the most of any country with 300+ papers; US 54.2, China 10.3.
OpenAlex; World Bank; IQ Metrics calculationEU grants to the Human Brain Project in its four phases, 2013-2023, against the one billion euros announced in 2013.
CORDIS; European CommissionNIH budget of the US BRAIN Initiative in FY2025, down from $680 million in FY2023.
NIHnational funding announced for the first call of China’s brain-science major project in 2021 (59 research directions).
Ministry of Science and Technology of China03 Has China overtaken the US in neuroscience?
No: in 2025 researchers in the United States were on 18,520 neuroscience papers and researchers in China on 14,534, 78.5% of the US count, by our count of OpenAlex records as of 9 November 2026 [1]. The gap is the smallest it has ever been. In 2000 China’s count was 4.3% of the US count; in 2026 so far, to 9 November, it is 89.7% (15,351 US papers, 13,768 Chinese).
We counted every journal article and review whose main topic OpenAlex places in its Neuroscience field, 1,690,202 papers from 2000 to 2026, and credited each paper to every country among its authors’ affiliations. This is called whole counting: a paper written by a team in Boston and a team in Shanghai counts once for the United States and once for China. OpenAlex is an open, CC0 index of scholarly works; it covers more journals every year, so we also give the world totals in every table.
The gap is closing, but the US still publishes more neuroscience papers
Neuroscience papers a year with at least one author in the United States or in China, 2001-2025, in thousands (2000 is in the table). In 2025 the US had 18,520 and China 14,534, 78.5% of the US count. Whole counting: a paper with authors in both countries counts for both. OpenAlex, as of 9 November 2026.
Source: OpenAlex [1]: articles and reviews whose primary topic is in the field Neuroscience, grouped by the authors’ countries; counted by IQ Metrics
Data table
| x | United States | China |
|---|---|---|
| 2001 | 10.8 | 0.6 |
| 2002 | 11.7 | 0.8 |
| 2003 | 12.6 | 1.1 |
| 2004 | 13.4 | 1.4 |
| 2005 | 13.5 | 1.7 |
| 2006 | 15.2 | 2.3 |
| 2007 | 14.5 | 2.7 |
| 2008 | 17.3 | 3.2 |
| 2009 | 16 | 3.4 |
| 2010 | 21.6 | 3.8 |
| 2011 | 18 | 4.1 |
| 2012 | 18.3 | 4.3 |
| 2013 | 19.2 | 5.3 |
| 2014 | 19.2 | 5.4 |
| 2015 | 18.9 | 5.5 |
| 2016 | 18.6 | 5.3 |
| 2017 | 19.4 | 6 |
| 2018 | 19.4 | 6.7 |
| 2019 | 19.4 | 7.1 |
| 2020 | 18.7 | 7.9 |
| 2021 | 19.1 | 9.1 |
| 2022 | 17.9 | 10.7 |
| 2023 | 18 | 10.4 |
| 2024 | 17.6 | 11.8 |
| 2025 | 18.5 | 14.5 |
Embed this chart
Paste this HTML into your page: it carries the numbers and the credit link to this figure.
The US count rose until about 2010 and has stayed near 18,700 a year since, while China’s grew 12.9% a year on average from 2020 to 2025 (IQ Metrics calculation). If both kept those rates, China’s count would pass the US count in about 2027. That is arithmetic on past growth, not a forecast: growth rates change, and OpenAlex keeps adding older and newer records.
The pattern holds when the definition changes. OpenAlex files clinical neurology under medicine, not neuroscience; in that subfield the US had 15,386 papers in 2025 and China 10,141, 65.9% of the US count [1]. For a sense of scale, our study of brain mapping shows how much of the brain those papers have actually charted, and how much of our brain we use explains one of the oldest myths the field keeps answering.
- Neuroscience paper (in this study)
- A journal article or review whose primary topic OpenAlex assigns to its field Neuroscience: cognitive, cellular and molecular, behavioural and developmental neuroscience, biological psychiatry, sensory and endocrine systems, and neurology research [1].
- Whole counting
- Each paper counts once for every country among its authors’ affiliations. Country totals therefore add up to more than the number of papers; shares of the world add up to more than 100%.
- Top 1% most-cited paper
- A paper whose citations put it in the top 1% of works of the same type, year and subfield in OpenAlex. Citations take years to build up, so the recent years are provisional [2].
- Human Brain Project (HBP)
- A ten-year European Union flagship research project, 2013-2023, coordinated from EPFL in Switzerland and later EBRAINS, to build brain simulation and data platforms [11] [15].
- BRAIN Initiative
- The US Brain Research through Advancing Innovative Neurotechnologies Initiative, launched on 2 April 2013; NIH funds most of it, with a base budget plus money from the 21st Century Cures Act [10] [9].
- China brain project
- The “Brain Science and Brain-Inspired Research” major project of China’s Science and Technology Innovation 2030 programme, run by the Ministry of Science and Technology; its first call opened in September 2021 [17].
- EBRAINS
- The research infrastructure for brain data, atlases and simulation that the Human Brain Project left behind; EBRAINS 2.0 is its EU grant for 2024-2026 [16].
- Papers per million people
- A country’s neuroscience papers in a year divided by its population in the same year (World Bank), times one million. It measures research output per person, not the ability of the people [4].
04 Who leads neuroscience research?
The United States leads neuroscience research by paper count: it ranked 1st in every year from 2000 to 2026, with 18,520 papers in 2025, ahead of China (14,534), the United Kingdom (4,925), Germany (4,635) and Japan (3,443) [1]. China moved from 14th in 2000 to 6th in 2005, 5th in 2010 and 2nd in 2013, and has held 2nd since; Japan, 2nd in 2000, was 5th in 2025.
China climbed from 14th to 2nd; the US never lost 1st place
Rank by neuroscience papers in 2000, 2008, 2016 and 2025, for the ten largest producers of 2025 (1 = most papers). China was 14th in 2000 and has been 2nd every year since 2013; India rose from 25th to 8th. Whole counting, OpenAlex, as of 9 November 2026.
Source: OpenAlex [1]; ranks among all countries by IQ Metrics
Data table
| country | 2000 | 2008 | 2016 | 2025 |
|---|---|---|---|---|
| United States | 1 | 1 | 1 | 1 |
| China | 14 | 5 | 2 | 2 |
| United Kingdom | 3 | 3 | 3 | 3 |
| Germany | 4 | 2 | 4 | 4 |
| Japan | 2 | 4 | 5 | 5 |
| Canada | 5 | 6 | 6 | 6 |
| Italy | 7 | 8 | 8 | 7 |
| India | 25 | 24 | 16 | 8 |
| France | 6 | 7 | 7 | 9 |
| Brazil | 18 | 14 | 13 | 10 |
Embed this chart
Paste this HTML into your page: it carries the numbers and the credit link to this figure.
Shares tell the same story with the size of the field in view. Of all neuroscience papers with a known author country, 41.1% had a US author in 2000 and 27.4% in 2025; China went from 1.8% to 21.5%. Of the ten largest producers only China, India and Brazil gained more than a percentage point; Japan lost 5.9 points. Papers with a known author country rose by 15,096 from 2010 to 2025, and China’s count rose by 10,744 in the same years (IQ Metrics calculation) [1].
Share of the world's neuroscience papers, 2000 and 2025
Share of all neuroscience papers with a known author country that have at least one author in each country. The US share fell from 41.1% to 27.4%, China's rose from 1.8% to 21.5%. Shares add up to more than 100% because a paper counts for every country among its authors. As of 9 November 2026.
Source: OpenAlex [1]; shares by IQ Metrics
Data table
| country | 2000 | 2025 |
|---|---|---|
| United States | 41.1 | 27.4 |
| China | 1.8 | 21.5 |
| United Kingdom | 9.3 | 7.3 |
| Germany | 9.1 | 6.9 |
| Japan | 11 | 5.1 |
| Canada | 5.6 | 4.9 |
| Italy | 4.3 | 4.3 |
| India | 0.5 | 4.2 |
| France | 5.4 | 3.5 |
| Brazil | 1 | 3.3 |
Embed this chart
Paste this HTML into your page: it carries the numbers and the credit link to this figure.
Splitting every paper into exactly one group removes the double counting. In 2025, 17,440 papers had a US author and no Chinese author, 1,080 had both, 13,454 had a Chinese author and no US author, and 35,521 had neither. The “rest of the world” is still the largest group: Europe, Japan, Canada, Australia, India and Brazil together publish more neuroscience than either of the two leaders alone.
Every neuroscience paper with a known author country, split four ways, every fifth year
Each paper sits in exactly one part: a US author but no China author, both, a China author but no US author, or neither. In 2000 the US was on 41.1% of these papers and China on 1.8%; in 2025 the US on 27.4% and China on 21.5%. Papers whose authors have no country in OpenAlex (31% in 2000, 15% in 2025) are left out. As of 9 November 2026.
Source: OpenAlex [1]; US-China co-authored papers from a filter on both countries; parts by IQ Metrics
Data table
| year | US without a China author | US and China together | China without a US author | Rest of the world | total |
|---|---|---|---|---|---|
| 2000 | 11392 | 29 | 464 | 15872 | 27757 |
| 2005 | 13336 | 154 | 1557 | 18419 | 33466 |
| 2010 | 21068 | 484 | 3306 | 27541 | 52399 |
| 2015 | 17876 | 996 | 4526 | 29764 | 53162 |
| 2020 | 17522 | 1219 | 6701 | 32187 | 57629 |
| 2025 | 17440 | 1080 | 13454 | 35521 | 67495 |
Embed this chart
Paste this HTML into your page: it carries the numbers and the credit link to this figure.
Ten years of change in the 15 largest producers
Neuroscience papers in 2015 and in 2025, whole counting. China went from 5,522 to 14,534 (+163%); the United States from 18,872 to 18,520. As of 9 November 2026.
Neuroscience papers a year
Source: OpenAlex [1]; counted by IQ Metrics
Data table
| country | 2015 | 2025 |
|---|---|---|
| United States | 18872 | 18520 |
| China | 5522 | 14534 |
| United Kingdom | 5008 | 4925 |
| Germany | 4943 | 4635 |
| Japan | 3564 | 3443 |
| Canada | 3116 | 3284 |
| Italy | 2278 | 2916 |
| India | 914 | 2804 |
| France | 2442 | 2336 |
| Brazil | 1322 | 2215 |
| Spain | 1688 | 2042 |
| Australia | 2094 | 1900 |
| South Korea | 1387 | 1766 |
| Netherlands | 1605 | 1734 |
| Türkiye | 493 | 1432 |
Embed this chart
Paste this HTML into your page: it carries the numbers and the credit link to this figure.
Over the last ten years two smaller producers grew even faster than China from a lower base: India (914 papers in 2015, 2,804 in 2025, x3.1) and Türkiye (493 to 1,432, x2.9), against x2.6 for China; the United Kingdom, Germany, Japan and Canada stayed within about 6% of their 2015 counts. A ranking of output is not a ranking of talent: it follows the number of funded researchers and the journals they publish in, which is why our count of prize-winning universities and what was measured about Nobel winners tell different stories.
05 Does China publish the most-cited neuroscience papers?
No: in 2025 the United States had 393 neuroscience papers in the top 1% most cited of their year and subfield and China 240, 61.1% of the US count; together they hold 45.9% and 28.0% of that elite group [1] [2]. China has been 2nd in this measure since 2022, after the United Kingdom. Recent years are provisional, because a paper from 2025 has had at most two years to collect citations.
In the most-cited neuroscience, the US lead is wider
Papers in the top 1% most cited of their year and subfield (OpenAlex percentile), every fifth year. In 2025: United States 393, China 240, 61.1% of the US count; China has been 2nd since 2022. Recent papers have had little time to be cited. As of 9 November 2026.
Top-1% neuroscience papers a year
Source: OpenAlex [1] [2]; counted by IQ Metrics
Data table
| year | China | United States |
|---|---|---|
| 2000 | 0 | 283 |
| 2005 | 4 | 345 |
| 2010 | 22 | 493 |
| 2015 | 62 | 539 |
| 2020 | 122 | 443 |
| 2025 | 240 | 393 |
Embed this chart
Paste this HTML into your page: it carries the numbers and the credit link to this figure.
Neuroscience is the exception to China’s lead in science as a whole. Across all fields in OpenAlex, China first had more papers than the United States in 2011, fell back, and has been ahead every year since 2022; in 2025 its count was 161% of the US count. In the top 1% most-cited papers across all fields China passed the United States in 2022 [1]. Rankings built on a fixed set of journals, such as the Nature Index, give their own answers; our counts cover every article and review OpenAlex holds.
China passed the US in science as a whole, not in neuroscience
China's paper count as a percentage of the US count, 2001-2025 (100 = level). All sciences: 161% in 2025; neuroscience: 78%; the top 1% most-cited neuroscience papers: 61%; clinical neurology, which OpenAlex files under medicine: 66%. IQ Metrics calculation, as of 9 November 2026.
Source: OpenAlex [1] [2]: articles and reviews, whole counting; ratios by IQ Metrics
Data table
| x | All sciences | Neuroscience | Clinical neurology | Neuroscience, top 1% cited |
|---|---|---|---|---|
| 2001 | 17 | 6 | 14 | 0 |
| 2002 | 21 | 7 | 17 | 1 |
| 2003 | 28 | 9 | 22 | 0 |
| 2004 | 42 | 10 | 24 | 1 |
| 2005 | 54 | 13 | 30 | 1 |
| 2006 | 67 | 15 | 34 | 2 |
| 2007 | 83 | 18 | 36 | 2 |
| 2008 | 84 | 19 | 36 | 3 |
| 2009 | 89 | 21 | 42 | 2 |
| 2010 | 93 | 18 | 45 | 4 |
| 2011 | 101 | 23 | 44 | 5 |
| 2012 | 92 | 23 | 44 | 5 |
| 2013 | 93 | 27 | 43 | 7 |
| 2014 | 87 | 28 | 44 | 6 |
| 2015 | 72 | 29 | 36 | 12 |
| 2016 | 60 | 29 | 34 | 9 |
| 2017 | 65 | 31 | 37 | 11 |
| 2018 | 74 | 34 | 39 | 16 |
| 2019 | 82 | 37 | 41 | 23 |
| 2020 | 87 | 42 | 39 | 28 |
| 2021 | 97 | 48 | 43 | 27 |
| 2022 | 125 | 60 | 54 | 39 |
| 2023 | 129 | 57 | 49 | 50 |
| 2024 | 147 | 67 | 56 | 55 |
| 2025 | 161 | 78 | 66 | 61 |
Embed this chart
Paste this HTML into your page: it carries the numbers and the credit link to this figure.
Why the difference? China’s lead across all sciences comes from fields other than neuroscience, which started from a much smaller base: in 2000 China had 493 neuroscience papers, 4.3% of the US count; in 2025 it had 14,534, a 29-fold rise, against 1.6 times for the United States (IQ Metrics calculation). An earlier bibliometric study of 2006-2015 also found China rising faster than any other country in neuroscience while the US stayed the largest producer [3].
06 Which country publishes the most neuroscience per person?
Switzerland publishes the most neuroscience per person among countries with 300 or more papers: 146 papers per million people in 2025, ahead of Denmark (113), Sweden (96) and the Netherlands (96) [1] [4]. The United States, with 54.2 per million, ranks 16 of 41 such countries; China, with 10.3, ranks 32, because its output is spread over a population 4.1 times larger.
Neuroscience papers per million people, 2025
Papers with at least one author in the country per million residents. Switzerland leads the countries with 300 or more papers (146 per million); the United States has 54 and China 10.3. Population: World Bank 2025. Taiwan has no World Bank population, so it has no value; Gibraltar, Monaco and Curaçao are too small for this map and are in the table. As of 9 November 2026.
Source: OpenAlex [1]; World Bank population [4]; per million by IQ Metrics
Data table
| country | iso2 | value |
|---|---|---|
| Macao | MO | 247.8 |
| Switzerland | CH | 146.3 |
| St. Kitts & Nevis | KN | 127.9 |
| Denmark | DK | 113.2 |
| Sweden | SE | 96.4 |
| Netherlands | NL | 95.9 |
| Iceland | IS | 94.3 |
| Luxembourg | LU | 93.2 |
| Hong Kong | HK | 89.2 |
| Grenada | GD | 85.2 |
| Canada | CA | 78.8 |
| Belgium | BE | 78.4 |
| Norway | NO | 76.1 |
| Antigua and Barbuda | AG | 74.3 |
| Finland | FI | 73.3 |
| Israel | IL | 73.2 |
| United Kingdom | GB | 70.9 |
| Australia | AU | 68.8 |
| Austria | AT | 58.5 |
| Germany | DE | 55.5 |
| Singapore | SG | 54.3 |
| United States | US | 54.2 |
| Ireland | IE | 53.6 |
| Cyprus | CY | 53.3 |
| Italy | IT | 49.5 |
| Portugal | PT | 45.6 |
| New Zealand | NZ | 43 |
| Spain | ES | 41.4 |
| Slovenia | SI | 35.2 |
| Hungary | HU | 34.9 |
| South Korea | KR | 34.2 |
| France | FR | 34 |
| Greece | GR | 33 |
| Malta | MT | 31.1 |
| Estonia | EE | 30 |
| Poland | PL | 28.1 |
| Japan | JP | 27.9 |
| Czechia | CZ | 25.9 |
| Qatar | QA | 23.9 |
| Croatia | HR | 23 |
| Lithuania | LT | 21.1 |
| Slovakia | SK | 18.7 |
| Saudi Arabia | SA | 17.6 |
| Bulgaria | BG | 16.9 |
| Türkiye | TR | 16.7 |
| Serbia | RS | 16.3 |
| Latvia | LV | 16.2 |
| United Arab Emirates | AE | 16.2 |
| Chile | CL | 16 |
| Ecuador | EC | 16 |
| Uruguay | UY | 16 |
| Bahrain | BH | 15.6 |
| Puerto Rico | PR | 14.1 |
| Iran | IR | 12.9 |
| Georgia | GE | 12.7 |
| Romania | RO | 11 |
| Armenia | AM | 10.7 |
| Malaysia | MY | 10.5 |
| Brazil | BR | 10.4 |
| China | CN | 10.3 |
| Jordan | JO | 10.2 |
| Lebanon | LB | 9.7 |
| Russia | RU | 9.7 |
| North Macedonia | MK | 8.8 |
| Ukraine | UA | 8.4 |
| Moldova | MD | 7.6 |
| Argentina | AR | 7.5 |
| Barbados | BB | 7.1 |
| Iraq | IQ | 6.6 |
| Oman | OM | 6.4 |
| Tunisia | TN | 6.2 |
| Uzbekistan | UZ | 6.2 |
| Costa Rica | CR | 5.8 |
| Palestine | PS | 5.7 |
| Panama | PA | 5.7 |
| Maldives | MV | 5.7 |
| Bosnia & Herzegovina | BA | 5.4 |
| Cuba | CU | 5.4 |
| Egypt | EG | 5.3 |
| Kuwait | KW | 4.9 |
First 80 of 150 rows; the Data button gives all of them.
Embed this chart
Paste this HTML into your page: it carries the numbers and the credit link to this figure.
Output per person follows research spending. The United States spent 3.45% of its GDP on research and development in 2023 and China 2.58%; the US had 4,937 researchers per million people (2022) and China 2,107 (2023) [5] [6]. Among the 29 countries with 500 or more papers, those that spend more of their economy on research publish more neuroscience per person (correlation 0.61 with the log of papers per million; IQ Metrics calculation), but the link is loose: Israel spends 6.35% and publishes 73 papers per million, South Korea 4.94% and 34, both below Switzerland. Neither number measures how intelligent a population is; they measure research systems.
Research spending and neuroscience output per person
29 countries with 500 or more neuroscience papers in 2025: R&D spending as a share of GDP (latest World Bank year) across, papers per million people up (log scale); bubble area = papers. United States: 3.45% and 54.2 per million; China: 2.58% and 10.3. A link, not a cause.
Neuroscience papers per million people (log scale)
R&D spending, % of GDP
Source: OpenAlex [1]; World Bank R&D and population [5] [4]; plotted by IQ Metrics
Data table
| country | rd_pct_gdp | papers_per_million | group | papers |
|---|---|---|---|---|
| United States | 3.5 | 54.2 | us | 18520 |
| China | 2.6 | 10.3 | cn | 14534 |
| United Kingdom | 2.7 | 70.9 | other | 4925 |
| Germany | 3.1 | 55.5 | other | 4635 |
| Japan | 3.4 | 27.9 | other | 3443 |
| Canada | 1.8 | 78.8 | other | 3284 |
| Italy | 1.4 | 49.5 | other | 2916 |
| India | 0.7 | 1.9 | other | 2804 |
| France | 2.2 | 34 | other | 2336 |
| Brazil | 1.2 | 10.4 | other | 2215 |
| Spain | 1.5 | 41.4 | other | 2042 |
| Australia | 1.9 | 68.8 | other | 1900 |
| South Korea | 4.9 | 34.2 | other | 1766 |
| Netherlands | 2.3 | 95.9 | other | 1734 |
| Türkiye | 1.4 | 16.7 | other | 1432 |
| Russia | 0.9 | 9.7 | other | 1389 |
| Switzerland | 3.2 | 146.3 | other | 1330 |
| Iran | 0.7 | 12.9 | other | 1188 |
| Poland | 1.6 | 28.1 | other | 1023 |
| Sweden | 3.6 | 96.4 | other | 1022 |
| Belgium | 3.3 | 78.4 | other | 936 |
| Indonesia | 0.3 | 3 | other | 857 |
| Israel | 6.3 | 73.2 | other | 741 |
| Denmark | 3 | 113.2 | other | 680 |
| Hong Kong | 1.1 | 89.2 | other | 669 |
| Saudi Arabia | 0.6 | 17.6 | other | 650 |
| Egypt | 1 | 5.3 | other | 623 |
| Mexico | 0.2 | 4.4 | other | 584 |
| Austria | 3.3 | 58.5 | other | 539 |
Embed this chart
Paste this HTML into your page: it carries the numbers and the credit link to this figure.
07 Which areas of neuroscience does China lead?
China leads the United States in two of OpenAlex’s eight neuroscience areas: developmental neuroscience (2,575 Chinese papers vs 2,019 US papers in 2021-2025) and biological psychiatry (1,110 vs 959) [1]. In neurology research filed under neuroscience the two are almost level (11,010 vs 11,121); in cognitive neuroscience, the largest area, the US has 39,224 papers and China 21,954.
Where China already matches the US: two of eight areas
Share of each area's neuroscience papers, 2021-2025, with at least one author in the country. China is ahead of the US in developmental neuroscience (28.4% vs 22.3% of papers) and biological psychiatry (23.3% vs 20.2%). Whole counting; rows add up to more than 100%. OpenAlex subfields, as of 9 November 2026.
Source: OpenAlex [1]: subfields of the field Neuroscience, 2021-2025; shares by IQ Metrics
Data table
| area of neuroscience | United States | China | United Kingdom | Germany | Japan | Canada | Italy | France |
|---|---|---|---|---|---|---|---|---|
| Cognitive | 24.9 | 13.9 | 8.6 | 7.3 | 4.1 | 5.3 | 4.1 | 3.6 |
| Cellular & molecular | 31.6 | 16.9 | 6.5 | 6.3 | 5.7 | 4.1 | 4 | 3.6 |
| Neurology | 21.3 | 21.1 | 4.7 | 6.2 | 4.8 | 3.9 | 4.3 | 2.4 |
| Sensory systems | 22.4 | 15.9 | 4.8 | 7.5 | 6.7 | 2.2 | 3.4 | 3.2 |
| Endocrine & autonomic | 28.8 | 11.9 | 6.3 | 5.9 | 5.9 | 3.9 | 2.8 | 3.9 |
| Developmental | 22.3 | 28.4 | 5.2 | 6.7 | 6.4 | 3.5 | 3.1 | 3.8 |
| Behavioural | 26.9 | 7.7 | 4.5 | 8.6 | 3.2 | 4.9 | 3.1 | 1.7 |
| Biol. psychiatry | 20.2 | 23.3 | 7.2 | 5.1 | 3.8 | 3.6 | 4.5 | 2.6 |
Embed this chart
Paste this HTML into your page: it carries the numbers and the credit link to this figure.
Twenty years earlier the picture was different: in 2001-2005 China had 912 cognitive neuroscience papers against 21,026 for the United States, and 19 in biological psychiatry against 232 (whole counting) [1]. The activity index below compares each country’s mix of areas with the world mix (1 = the same mix). China leans towards developmental neuroscience (1.77), biological psychiatry (1.46) and neurology (1.32), and away from behavioural neuroscience (0.48); the United States leans towards cellular and molecular neuroscience (1.22). In cognitive neuroscience, the area closest to thinking and intelligence, China’s index is 0.87 and the US index 0.96; our pages on which part of the brain IQ tests measure and brain size and IQ show what that field studies.
Pick a country: what its neuroscience focuses on
Activity index by area, 2021-2025: the country's share of the papers in an area divided by its share of all neuroscience papers (1 = the world mix, dashed). China is strongest in developmental neuroscience (1.77) and biological psychiatry (1.46); the United States in cellular and molecular neuroscience (1.22). IQ Metrics calculation.
Source: OpenAlex [1] subfields; activity index by IQ Metrics
Data table
| country | 2805 | 2804 | 2808 | 2809 | 2807 | 2806 | 2802 | 2803 |
|---|---|---|---|---|---|---|---|---|
| United States | 1 | 1.2 | 0.8 | 0.9 | 1.1 | 0.9 | 1 | 0.8 |
| China | 0.9 | 1.1 | 1.3 | 1 | 0.7 | 1.8 | 0.5 | 1.5 |
| United Kingdom | 1.2 | 0.9 | 0.7 | 0.7 | 0.9 | 0.8 | 0.6 | 1 |
| Germany | 1.1 | 0.9 | 0.9 | 1.1 | 0.9 | 1 | 1.3 | 0.8 |
| Japan | 0.8 | 1.2 | 1 | 1.4 | 1.2 | 1.3 | 0.7 | 0.8 |
| Canada | 1.2 | 0.9 | 0.9 | 0.5 | 0.9 | 0.8 | 1.1 | 0.8 |
| Italy | 1 | 1 | 1.1 | 0.9 | 0.7 | 0.8 | 0.8 | 1.1 |
| France | 1.1 | 1.1 | 0.7 | 0.9 | 1.1 | 1.1 | 0.5 | 0.8 |
| India | 0.9 | 1.3 | 0.9 | 1.3 | 0.9 | 0.6 | 0.7 | 0.8 |
| Spain | 0.9 | 1.2 | 0.9 | 0.8 | 1.2 | 1.6 | 0.8 | 0.7 |
| Australia | 1.2 | 0.8 | 0.9 | 0.6 | 1 | 0.7 | 0.7 | 1.5 |
| Brazil | 1 | 0.8 | 1.1 | 1 | 1.4 | 0.6 | 1.4 | 1.6 |
| World mix | 1 | 1 | 1 | 1 | 1 | 1 | 1 | 1 |
Embed this chart
Paste this HTML into your page: it carries the numbers and the credit link to this figure.
08 Do American and Chinese neuroscientists still work together?
Yes, but less than before: 1,080 neuroscience papers had authors in both countries in 2025, down from a peak of 1,232 in 2018 [1]. In 2018, 18.5% of China’s neuroscience papers had a US co-author; in 2025, 7.4%. For US papers the share with a Chinese co-author was 5.8% in 2025 (IQ Metrics calculation).
US-China co-authored neuroscience papers peaked in 2018
Neuroscience papers with at least one author in the United States and one in China, per year. 1,232 in 2018, 1,080 in 2025. In 2018, 18.5% of China's papers had a US co-author; in 2025, 7.4%. As of 9 November 2026.
Source: OpenAlex [1]: filter on both country codes; counted by IQ Metrics
Data table
| label | value |
|---|---|
| 2000 | 29 |
| 2001 | 48 |
| 2002 | 49 |
| 2003 | 89 |
| 2004 | 95 |
| 2005 | 154 |
| 2006 | 206 |
| 2007 | 224 |
| 2008 | 317 |
| 2009 | 344 |
| 2010 | 484 |
| 2011 | 518 |
| 2012 | 603 |
| 2013 | 722 |
| 2014 | 876 |
| 2015 | 996 |
| 2016 | 976 |
| 2017 | 1159 |
| 2018 | 1232 |
| 2019 | 1187 |
| 2020 | 1219 |
| 2021 | 1143 |
| 2022 | 1109 |
| 2023 | 1003 |
| 2024 | 988 |
| 2025 | 1080 |
Embed this chart
Paste this HTML into your page: it carries the numbers and the credit link to this figure.
The joint count grew every year but one (2016) from 2000 to 2018, from 29 papers to 1,232, then fell back while China’s own output kept rising. The data show the change, not its causes: we report the counts and leave the reasons to the people who decide where scientists work and publish. Among the most-cited papers the joint count stayed between 38 and 53 a year from 2017 to 2025 [1].
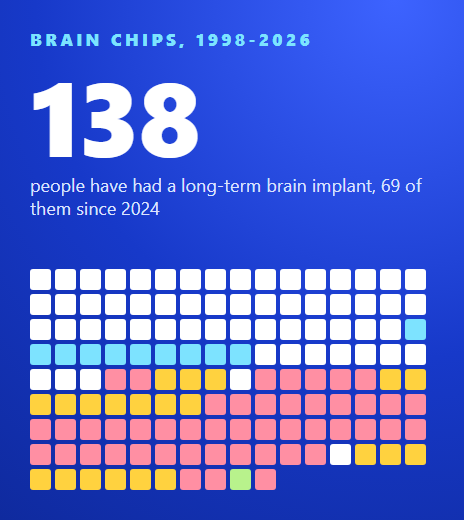
Brain technology shows the same two-country pattern. In our count of every brain-computer interface implant, China’s three newest programmes gave 45 of the 69 long-term implants reported from January 2024 to October 2026, against 21 for Neuralink [22]. Papers, implants and money each measure a different part of the race.
09 What was the Human Brain Project, and what did it cost?
The Human Brain Project was a ten-year European Union flagship that ran from October 2013 to September 2023; the European Commission announced it in January 2013 as set to receive one billion euros, and CORDIS records 381 million euros of EU grants in its four phases [11] [12] [13] [14] [15]. The difference is not a contradiction: the 2013 plan counted national and other funding as well as EU grants, and only the EU grants are documented line by line.
The four phases were a ramp-up phase under the EU’s Seventh Framework Programme (54 million euros, 2013-10 to 2017-02) and three Specific Grant Agreements under Horizon 2020: SGA1 (89 million, 2016-04 to 2018-03), SGA2 (88 million, 2018-04 to 2020-03) and SGA3 (150 million, 2020-04 to 2023-09). The École Polytechnique Fédérale de Lausanne (EPFL) in Switzerland coordinated the first three phases and EBRAINS, registered in Belgium, the last one [12] [15].
What it made: the last phase was designed to “deliver EBRAINS”, a European research infrastructure for brain data, atlases, models and simulation [15]. EBRAINS continues under a new EU grant, EBRAINS 2.0, worth 37,995,202 euros for January 2024 to December 2026 [16]. The European Commission chose the Human Brain Project on 28 January 2013 and the US BRAIN Initiative was announced on 2 April 2013; Japan’s Brain/MINDS followed in 2014 [11] [10] [19].
National brain projects, 2011-2026
Each bar runs from a programme's start to its end (or today, as of 9 November 2026). Dots mark launches, money stated in an official source, and the paper milestones from our OpenAlex counts. Tap or hover a dot for details.
Source: White House 2013 [10]; NIH [9]; European Commission [11]; CORDIS [12] [15] [16]; MEXT [18]; AMED [19]; MOST [17]; Government of Canada [20] [21]; OpenAlex [1]
Data table
| programme | type | from | to | label | detail |
|---|---|---|---|---|---|
| Canada Brain Research Fund | span | 2011 | now | ||
| Canada Brain Research Fund | event | 2011 | Budget 2011: up to C$100m | federal money, matched 1:1 by Brain Canada | |
| Canada Brain Research Fund | event | 2024 | Budget 2024: C$80m | over four years, matched 1:1 | |
| US BRAIN Initiative | span | 2013-04 | now | ||
| US BRAIN Initiative | event | 2013-04 | Launch | about $100 million planned for FY2014 across NIH, DARPA and NSF | |
| US BRAIN Initiative | event | 2023 | Peak $680m | FY2023, NIH | |
| US BRAIN Initiative | event | 2025 | $321m | FY2025, NIH | |
| EU Human Brain Project | span | 2013-10 | 2023-09 | ||
| EU Human Brain Project | span | 2024-01 | 2026-12 | ||
| EU Human Brain Project | event | 2013-01 | Chosen as an EU flagship | announced with one billion euros over 10 years | |
| EU Human Brain Project | event | 2024-01 | EBRAINS 2.0 | €38.0 million EU grant, 2024-2026 | |
| Japan Brain/MINDS | span | 2014-04 | 2024-03 | ||
| Japan Brain/MINDS | span | 2024-04 | now | ||
| Japan Brain/MINDS | event | 2014-04 | Start | a 10-year project from FY2014 | |
| Japan Brain/MINDS | event | 2024-04 | Successor programme | Brain Neuroscience Integrated Program, 100 new projects | |
| China brain project | span | 2021-09 | now | ||
| China brain project | event | 2021-09 | First call | 59 research directions, 3.148 billion yuan in national funding | |
| Neuroscience papers | event | 2013 | China 2nd | China becomes the 2nd largest producer of neuroscience papers | |
| Neuroscience papers | event | 2022 | China passes US, all science | and stays ahead in every year since | |
| Neuroscience papers | event | 2022 | China 2nd, top 1% | in the most-cited neuroscience papers |
Embed this chart
Paste this HTML into your page: it carries the numbers and the credit link to this figure.
10 How much do the US BRAIN Initiative and the China brain project cost?
The US BRAIN Initiative had $321 million at NIH in FY2025, down from a peak of $680 million in FY2023, and China’s brain project announced 3.148 billion yuan of national funding for its first call in 2021, about $437 million at 2024 exchange rates [9] [17] [7]. The two figures are not the same kind of number: the US figure is one year of appropriations, the Chinese one is the money for a call whose projects usually run five years.
The BRAIN Initiative was launched on 2 April 2013 with about $100 million planned for FY2014 across three agencies, about $40 million of it at NIH [10]. NIH funds it from two streams: a base budget, $230 million in FY2023-FY2025, and money set in advance by the 21st Century Cures Act, which rose to $450 million in FY2023, fell to $172 million in FY2024 and $91 million in FY2025, and ends after FY2026 [9]. NIH’s total for FY2022-FY2025, the years its budget page states in words, is $2.02 billion.
China’s “Brain Science and Brain-Inspired Research” project is one of the major projects of the Science and Technology Innovation 2030 programme. Its 2021 guide set out 59 research directions in five areas: how the brain gives rise to cognition, brain disorders linked to cognitive decline, brain-inspired computing and brain-machine interfaces, child and adolescent brain development, and shared technology platforms [17]. We found no official total for the whole project, and no later yearly guide with an amount, so the table lists only the 2021 call.
What the official sources say the brain projects got
US$ millions at 2024 exchange rates (World Bank), not adjusted for inflation. HBP = Human Brain Project; CBRF = Canada Brain Research Fund. Periods differ: one year for the US and Japan, a whole call or programme for the others. At purchasing power parity, China's 2021 call is worth $893 million. IQ Metrics conversion of the amounts in the original currency, as of 9 November 2026.
Source: NIH [9]; European Commission [11] and CORDIS [12] [13] [14] [15] [16]; Ministry of Science and Technology of China [17]; MEXT [18]; Government of Canada [20]; World Bank exchange rates [7]
Data table
| label | value |
|---|---|
| HBP plan, 2013 (10 years) | 1082 |
| US BRAIN, FY2023 (1 year) | 680 |
| China, 2021 call (5-yr projects) | 437 |
| HBP, 4 EU grants, 2013-23 | 412 |
| US BRAIN, FY2025 (1 year) | 321 |
| Canada CBRF, federal, 2011-21 | 146 |
| Japan, FY2025 (1 year) | 43 |
| EBRAINS 2.0, 2024-26 | 41 |
Embed this chart
Paste this HTML into your page: it carries the numbers and the credit link to this figure.
Other countries run smaller programmes. Japan’s Brain/MINDS began in FY2014 as a ten-year project and continues as the Brain Neuroscience Integrated Program, with ¥6.54 billion in FY2025 (about $43 million at 2024 exchange rates) [18] [19]. Canada has committed C$200 million of federal money to the Canada Brain Research Fund through Budgets 2011, 2016, 2019 and a 2021 renewal, and C$80 million more over four years in Budget 2024, each dollar matched by Brain Canada [20] [21]. The brain project money is small next to ordinary research budgets, as the next section shows.
Every brain-project money figure we could read in an official source
Amounts in the original currency as the source states them, then in US$ millions at the 2024 World Bank exchange rate and in international dollars at 2024 purchasing power parity (n/a: the World Bank gives no euro-area PPP rate). Not adjusted for inflation. A blank in the official record is not filled.
| BRAIN Initiative launch, all federal agencies | United States | FY2014 | $100,000,000 | proposed in the President’s FY2014 budget (NIH, DARPA, NSF) | 100.0 | 100.0 | [10] |
| BRAIN Initiative, NIH share | United States | FY2014 | $40,000,000 | planned NIH allocation | 40.0 | 40.0 | [10] |
| NIH BRAIN Initiative | United States | FY2022 | $620,000,000 | one-year appropriation (base + Cures Act) | 620.0 | 620.0 | [9] |
| NIH BRAIN Initiative | United States | FY2023 | $680,000,000 | one-year appropriation (base + Cures Act) | 680.0 | 680.0 | [9] |
| NIH BRAIN Initiative | United States | FY2024 | $402,000,000 | one-year appropriation (base + Cures Act) | 402.0 | 402.0 | [9] |
| NIH BRAIN Initiative | United States | FY2025 | $321,000,000 | one-year appropriation (base + Cures Act) | 321.0 | 321.0 | [9] |
| Human Brain Project (announced plan, all funders) | European Union | 2013-2023 (10 years) | €1,000,000,000 | announced in 2013 for 10 years | 1082.4 | n/a | [11] |
| Human Brain Project, ramp-up phase (FP7, grant 604102) | European Union | 2013-10 to 2017-02 | €54,000,000 | EU grant (CORDIS EU contribution) | 58.4 | n/a | [12] |
| Human Brain Project, SGA1 (Horizon 2020, grant 720270) | European Union | 2016-04 to 2018-03 | €89,000,000 | EU grant (CORDIS EU contribution) | 96.3 | n/a | [13] |
| Human Brain Project, SGA2 (Horizon 2020, grant 785907) | European Union | 2018-04 to 2020-03 | €88,000,000 | EU grant (CORDIS EU contribution) | 95.2 | n/a | [14] |
| Human Brain Project, SGA3 (Horizon 2020, grant 945539) | European Union | 2020-04 to 2023-09 | €150,000,000 | EU grant (CORDIS EU contribution) | 162.4 | n/a | [15] |
| EBRAINS 2.0 (Horizon Europe, grant 101147319) | European Union | 2024-01 to 2026-12 | €37,995,202 | EU grant (CORDIS EU contribution) | 41.1 | n/a | [16] |
| STI 2030 major project “Brain Science and Brain-Inspired Research”, 2021 call | China | 2021 call (projects usually 5 years) | ¥3,148,000,000 (yuan) | national funding estimate for the 2021 call (59 research directions) | 437.4 | 893.0 | [17] |
| Brain/MINDS 2.0 (Brain Neuroscience Integrated Program, AMED) | Japan | FY2024 | ¥6,513,000,000 (yen) | one-year budget | 43.0 | 68.9 | [18] |
| Brain/MINDS 2.0 (Brain Neuroscience Integrated Program, AMED) | Japan | FY2025 | ¥6,540,000,000 (yen) | one-year budget | 43.2 | 69.2 | [18] |
| Canada Brain Research Fund (federal share, Budgets 2011, 2016, 2019 and the 2021 renewal) | Canada | 2011-2021 commitments | C$200,000,000 | federal commitments, matched 1:1 by Brain Canada | 146.1 | 173.8 | [20] |
| Canada Brain Research Fund, Budget 2024 renewal (federal share) | Canada | 2024-2028 (four years) | C$80,000,000 | federal commitment, matched 1:1 (envelope $160 million) | 58.4 | 69.5 | [20] |
Source: Official sources in the last column; conversions by IQ Metrics with World Bank rates [7]
11 How much does the US spend on neuroscience in total?
The US National Institutes of Health spent $11.9 billion on its research category Neurosciences in FY2025, 2.3 times the $5.2 billion of FY2008 [8]. That is about 37 times the BRAIN Initiative’s FY2025 budget: most US neuroscience money flows through the ordinary grants of NIH institutes, not through the flagship project.
NIH neuroscience funding more than doubled, FY2008-FY2025
NIH spending in its research category Neurosciences, US$ billions a year. FY2008: 5.22; FY2025: 11.90. FY2009 and FY2010 leave out the one-off Recovery Act money. China publishes no comparable yearly line for neuroscience. NIH RePORT table of 23 June 2026.
Source: National Institutes of Health, RCDC category Neurosciences [8]
Data table
| label | value |
|---|---|
| FY2008 | 5.2 |
| FY2009 | 5.3 |
| FY2010 | 5.5 |
| FY2011 | 5.5 |
| FY2012 | 5.6 |
| FY2013 | 5.3 |
| FY2014 | 5.6 |
| FY2015 | 5.7 |
| FY2016 | 6.5 |
| FY2017 | 7.3 |
| FY2018 | 8.2 |
| FY2019 | 9.5 |
| FY2020 | 10.1 |
| FY2021 | 10.7 |
| FY2022 | 11.3 |
| FY2023 | 11.9 |
| FY2024 | 11.8 |
| FY2025 | 11.9 |
Embed this chart
Paste this HTML into your page: it carries the numbers and the credit link to this figure.
No comparable yearly figure exists for China: the government does not publish neuroscience spending by research category, so a like-for-like money comparison is not possible from official sources. What can be compared is output, and there the money gap and the paper gap point the same way: the US still leads, by a shrinking margin. Our review of adult neurogenesis studies and organoid intelligence ledger show what some of that research produces, study by study.
Test the brain the papers study
Our IQ test measures pattern reasoning and reports your result with a percentile. It says nothing about any country; it is about you.
Take the IQ testFor more on how the brain works, see our human brain facts, what Einstein’s brain did and did not show, and the intelligence research news desk, which follows new studies as they appear.
12 Every country and every year in our dataset
United States and China, every year 2000-2026
Neuroscience papers (whole counting), China as % of the US, the top 1% most cited, papers with authors in both countries, and the world totals with and without a known author country. 2026 runs to 9 November.
| 2000 | 11,421 | 493 | 4.3 | 283 | 0 | 29 | 27,757 | 39,990 |
| 2001 | 10,828 | 638 | 5.9 | 247 | 0 | 48 | 27,413 | 38,397 |
| 2002 | 11,658 | 766 | 6.6 | 280 | 2 | 49 | 28,892 | 40,382 |
| 2003 | 12,575 | 1,114 | 8.9 | 303 | 0 | 89 | 31,187 | 42,811 |
| 2004 | 13,431 | 1,351 | 10.1 | 337 | 4 | 95 | 33,103 | 47,134 |
| 2005 | 13,490 | 1,711 | 12.7 | 345 | 4 | 154 | 33,466 | 47,429 |
| 2006 | 15,157 | 2,298 | 15.2 | 397 | 9 | 206 | 37,428 | 51,834 |
| 2007 | 14,482 | 2,653 | 18.3 | 380 | 7 | 224 | 37,601 | 52,473 |
| 2008 | 17,322 | 3,218 | 18.6 | 455 | 14 | 317 | 44,191 | 61,329 |
| 2009 | 15,974 | 3,404 | 21.3 | 452 | 10 | 344 | 43,023 | 61,939 |
| 2010 | 21,552 | 3,790 | 17.6 | 493 | 22 | 484 | 52,399 | 70,738 |
| 2011 | 18,030 | 4,137 | 22.9 | 477 | 24 | 518 | 47,610 | 65,601 |
| 2012 | 18,340 | 4,280 | 23.3 | 490 | 26 | 603 | 48,261 | 66,100 |
| 2013 | 19,186 | 5,265 | 27.4 | 534 | 37 | 722 | 52,469 | 71,027 |
| 2014 | 19,238 | 5,445 | 28.3 | 525 | 34 | 876 | 53,025 | 71,205 |
| 2015 | 18,872 | 5,522 | 29.3 | 539 | 62 | 996 | 53,162 | 71,924 |
| 2016 | 18,629 | 5,345 | 28.7 | 579 | 51 | 976 | 52,149 | 72,611 |
| 2017 | 19,374 | 6,047 | 31.2 | 531 | 60 | 1,159 | 55,226 | 72,371 |
| 2018 | 19,426 | 6,652 | 34.2 | 511 | 81 | 1,232 | 55,916 | 70,509 |
| 2019 | 19,450 | 7,131 | 36.7 | 474 | 110 | 1,187 | 57,565 | 73,668 |
| 2020 | 18,741 | 7,920 | 42.3 | 443 | 122 | 1,219 | 57,629 | 71,090 |
| 2021 | 19,095 | 9,094 | 47.6 | 430 | 117 | 1,143 | 61,808 | 71,155 |
| 2022 | 17,900 | 10,715 | 59.9 | 410 | 161 | 1,109 | 59,580 | 66,162 |
| 2023 | 18,049 | 10,352 | 57.4 | 380 | 189 | 1,003 | 60,280 | 67,691 |
| 2024 | 17,612 | 11,814 | 67.1 | 392 | 217 | 988 | 60,730 | 68,728 |
| 2025 | 18,520 | 14,534 | 78.5 | 393 | 240 | 1,080 | 67,495 | 79,138 |
| 2026 (to date) | 15,351 | 13,768 | 89.7 | 407 | 187 | 821 | 59,880 | 76,766 |
Source: OpenAlex [1]; counted by IQ Metrics
Every country with a neuroscience paper in 2025
158 countries and territories, sorted by papers (whole counting). Share = share of papers with a known author country. Per million: World Bank population 2025. R&D: share of GDP, latest World Bank year. n/a = no World Bank value. As of 9 November 2026.
| United States | 1 | 18,520 | 393 | 27.44 | 18,872 | 11,421 | 54.2 | 3.45 (2023) |
| China | 2 | 14,534 | 240 | 21.53 | 5,522 | 493 | 10.3 | 2.58 (2023) |
| United Kingdom | 3 | 4,925 | 146 | 7.3 | 5,008 | 2,575 | 70.9 | 2.68 (2023) |
| Germany | 4 | 4,635 | 107 | 6.87 | 4,943 | 2,517 | 55.5 | 3.15 (2023) |
| Japan | 5 | 3,443 | 38 | 5.1 | 3,564 | 3,048 | 27.9 | 3.44 (2023) |
| Canada | 6 | 3,284 | 68 | 4.87 | 3,116 | 1,561 | 78.8 | 1.79 (2024) |
| Italy | 7 | 2,916 | 36 | 4.32 | 2,278 | 1,187 | 49.5 | 1.38 (2023) |
| India | 8 | 2,804 | 27 | 4.15 | 914 | 134 | 1.9 | 0.65 (2020) |
| France | 9 | 2,336 | 49 | 3.46 | 2,442 | 1,486 | 34.0 | 2.18 (2023) |
| Brazil | 10 | 2,215 | 20 | 3.28 | 1,322 | 270 | 10.4 | 1.19 (2023) |
| Spain | 11 | 2,042 | 36 | 3.03 | 1,688 | 714 | 41.4 | 1.49 (2023) |
| Australia | 12 | 1,900 | 50 | 2.82 | 2,094 | 744 | 68.8 | 1.86 (2021) |
| South Korea | 13 | 1,766 | 33 | 2.62 | 1,387 | 193 | 34.2 | 4.94 (2023) |
| Netherlands | 14 | 1,734 | 33 | 2.57 | 1,605 | 598 | 95.9 | 2.27 (2023) |
| Türkiye | 15 | 1,432 | 9 | 2.12 | 493 | 86 | 16.7 | 1.42 (2023) |
| Russia | 16 | 1,389 | 1 | 2.06 | 1,046 | 630 | 9.7 | 0.94 (2024) |
| Switzerland | 17 | 1,330 | 60 | 1.97 | 1,140 | 517 | 146.3 | 3.22 (2023) |
| Iran | 18 | 1,188 | 6 | 1.76 | 814 | 34 | 12.9 | 0.73 (2021) |
| Poland | 19 | 1,023 | 7 | 1.52 | 748 | 334 | 28.1 | 1.56 (2023) |
| Sweden | 20 | 1,022 | 43 | 1.51 | 911 | 610 | 96.4 | 3.60 (2023) |
| Belgium | 21 | 936 | 19 | 1.39 | 899 | 315 | 78.4 | 3.27 (2023) |
| Indonesia | 22 | 857 | 1 | 1.27 | 100 | 4 | 3.0 | 0.28 (2020) |
| Israel | 23 | 741 | 21 | 1.1 | 717 | 344 | 73.2 | 6.35 (2023) |
| Denmark | 24 | 680 | 26 | 1.01 | 548 | 206 | 113.2 | 3.05 (2023) |
| Hong Kong | 25 | 669 | 22 | 0.99 | 268 | 99 | 89.2 | 1.13 (2024) |
| Taiwan | 26 | 659 | 11 | 0.98 | 586 | 179 | n/a | n/a |
| Saudi Arabia | 27 | 650 | 24 | 0.96 | 149 | 14 | 17.6 | 0.64 (2024) |
| Egypt | 28 | 623 | 7 | 0.92 | 182 | 11 | 5.3 | 1.02 (2024) |
| Mexico | 29 | 584 | 3 | 0.87 | 375 | 128 | 4.4 | 0.25 (2024) |
| Austria | 30 | 539 | 8 | 0.8 | 475 | 176 | 58.5 | 3.26 (2023) |
| Portugal | 31 | 493 | 8 | 0.73 | 383 | 39 | 45.6 | 1.69 (2023) |
| Pakistan | 32 | 448 | 7 | 0.66 | 90 | 6 | 1.8 | 0.16 (2023) |
| Norway | 33 | 427 | 14 | 0.63 | 269 | 116 | 76.1 | 1.85 (2023) |
| Finland | 34 | 414 | 8 | 0.61 | 377 | 250 | 73.3 | 3.09 (2023) |
| Malaysia | 35 | 377 | 6 | 0.56 | 165 | 6 | 10.5 | 1.01 (2022) |
| Argentina | 36 | 345 | 2 | 0.51 | 295 | 120 | 7.5 | 0.60 (2023) |
| Greece | 37 | 344 | 7 | 0.51 | 180 | 60 | 33.0 | 1.49 (2023) |
| Hungary | 38 | 332 | 8 | 0.49 | 286 | 218 | 34.9 | 1.38 (2023) |
| Singapore | 38 | 332 | 16 | 0.49 | 280 | 33 | 54.3 | 1.81 (2022) |
| Ukraine | 40 | 328 | 0 | 0.49 | 164 | 69 | 8.4 | 0.37 (2024) |
| Chile | 41 | 318 | 3 | 0.47 | 246 | 52 | 16.0 | 0.39 (2022) |
| Iraq | 42 | 310 | 3 | 0.46 | 23 | 2 | 6.6 | 0.04 (2021) |
| Ireland | 43 | 294 | 6 | 0.44 | 213 | 88 | 53.6 | 1.59 (2023) |
| Ecuador | 44 | 292 | 1 | 0.43 | 15 | 2 | 16.0 | 0.44 (2014) |
| Czechia | 45 | 282 | 3 | 0.42 | 224 | 92 | 25.9 | 1.83 (2023) |
| Thailand | 46 | 256 | 2 | 0.38 | 94 | 20 | 3.6 | 0.94 (2023) |
| Colombia | 47 | 235 | 3 | 0.35 | 125 | 16 | 4.4 | 0.29 (2020) |
| Uzbekistan | 48 | 230 | 0 | 0.34 | 6 | 2 | 6.2 | 0.10 (2024) |
| New Zealand | 49 | 229 | 5 | 0.34 | 268 | 127 | 43.0 | 1.55 (2023) |
| Romania | 50 | 210 | 5 | 0.31 | 95 | 8 | 11.0 | 0.52 (2023) |
| Nigeria | 51 | 194 | 0 | 0.29 | 45 | 3 | 0.8 | 0.28 (2019) |
| United Arab Emirates | 52 | 186 | 6 | 0.28 | 61 | 8 | 16.2 | 1.49 (2021) |
| South Africa | 53 | 183 | 2 | 0.27 | 108 | 38 | 2.8 | 0.61 (2022) |
| Macao | 54 | 170 | 6 | 0.25 | 33 | 0 | 247.8 | 0.31 (2024) |
| Bangladesh | 55 | 151 | 4 | 0.22 | 40 | 2 | 0.9 | n/a |
| Jordan | 56 | 117 | 5 | 0.17 | 20 | 2 | 10.2 | 0.70 (2016) |
| Morocco | 57 | 116 | 1 | 0.17 | 19 | 7 | 3.0 | 0.66 (2010) |
| Bulgaria | 58 | 109 | 2 | 0.16 | 48 | 31 | 16.9 | 0.79 (2023) |
| Peru | 59 | 108 | 1 | 0.16 | 22 | 5 | 3.1 | 0.18 (2023) |
| Serbia | 60 | 107 | 0 | 0.16 | 103 | 18 | 16.3 | 0.94 (2024) |
| Slovakia | 61 | 101 | 1 | 0.15 | 81 | 24 | 18.7 | 1.03 (2023) |
| Croatia | 62 | 89 | 1 | 0.13 | 67 | 13 | 23.0 | 1.39 (2023) |
| Vietnam | 62 | 89 | 0 | 0.13 | 12 | 1 | 0.9 | 0.41 (2023) |
| Kazakhstan | 64 | 86 | 0 | 0.13 | 2 | 0 | 4.1 | 0.16 (2024) |
| Philippines | 65 | 82 | 0 | 0.12 | 22 | 7 | 0.7 | 0.28 (2020) |
| Tunisia | 66 | 77 | 1 | 0.11 | 53 | 10 | 6.2 | 0.75 (2019) |
| Slovenia | 67 | 75 | 2 | 0.11 | 42 | 31 | 35.2 | 2.13 (2023) |
| Cyprus | 68 | 73 | 1 | 0.11 | 26 | 5 | 53.3 | 0.68 (2023) |
| Qatar | 69 | 71 | 0 | 0.11 | 42 | 1 | 23.9 | 0.68 (2021) |
| Luxembourg | 70 | 64 | 1 | 0.09 | 25 | 4 | 93.2 | 1.07 (2023) |
| Lithuania | 71 | 61 | 0 | 0.09 | 27 | 11 | 21.1 | 1.05 (2023) |
| Cuba | 72 | 59 | 0 | 0.09 | 40 | 18 | 5.4 | 0.44 (2024) |
| Lebanon | 73 | 57 | 2 | 0.08 | 25 | 7 | 9.7 | n/a |
| Algeria | 74 | 54 | 1 | 0.08 | 27 | 5 | 1.1 | 0.44 (2024) |
| Uruguay | 74 | 54 | 0 | 0.08 | 35 | 14 | 16.0 | 0.70 (2023) |
| Georgia | 76 | 50 | 0 | 0.07 | 12 | 5 | 12.7 | 0.26 (2024) |
| Azerbaijan | 77 | 46 | 0 | 0.07 | 3 | 2 | 4.5 | 0.21 (2024) |
| Puerto Rico | 78 | 45 | 1 | 0.07 | 40 | 16 | 14.1 | 0.43 (2015) |
| Estonia | 79 | 41 | 1 | 0.06 | 44 | 26 | 30.0 | 1.84 (2023) |
| Belarus | 80 | 39 | 0 | 0.06 | 18 | 5 | 4.3 | 0.59 (2024) |
| Iceland | 81 | 37 | 2 | 0.05 | 32 | 2 | 94.3 | 2.64 (2023) |
| Oman | 82 | 35 | 0 | 0.05 | 11 | 1 | 6.4 | 0.39 (2024) |
| Armenia | 83 | 33 | 0 | 0.05 | 7 | 22 | 10.7 | 0.29 (2024) |
| Ethiopia | 83 | 33 | 2 | 0.05 | 4 | 0 | 0.2 | 0.27 (2017) |
| Nepal | 85 | 32 | 1 | 0.05 | 10 | 0 | 1.1 | 0.30 (2010) |
| Palestine | 86 | 31 | 0 | 0.05 | 10 | 1 | 5.7 | 0.45 (2013) |
| Costa Rica | 87 | 30 | 0 | 0.04 | 16 | 1 | 5.8 | 0.34 (2023) |
| Ghana | 87 | 30 | 0 | 0.04 | 5 | 1 | 0.9 | 0.38 (2010) |
| Latvia | 87 | 30 | 1 | 0.04 | 8 | 3 | 16.2 | 0.82 (2023) |
| Venezuela | 90 | 28 | 0 | 0.04 | 24 | 26 | 1.0 | 0.34 (2014) |
| Panama | 91 | 26 | 0 | 0.04 | 4 | 0 | 5.7 | 0.20 (2024) |
| Paraguay | 91 | 26 | 0 | 0.04 | 1 | 0 | 3.7 | 0.14 (2023) |
| Bahrain | 93 | 25 | 2 | 0.04 | 1 | 0 | 15.6 | 0.19 (2024) |
| Sri Lanka | 93 | 25 | 0 | 0.04 | 6 | 0 | 1.1 | 0.11 (2022) |
| Kuwait | 95 | 24 | 0 | 0.04 | 12 | 7 | 4.9 | 0.09 (2024) |
| Kenya | 96 | 22 | 0 | 0.03 | 4 | 3 | 0.4 | 0.81 (2024) |
| Bolivia | 97 | 19 | 0 | 0.03 | 5 | 0 | 1.5 | 0.06 (2021) |
| Rwanda | 97 | 19 | 0 | 0.03 | 0 | 0 | 1.3 | 0.78 (2023) |
| Kyrgyzstan | 99 | 18 | 0 | 0.03 | 2 | 1 | 2.5 | 0.05 (2024) |
| Moldova | 99 | 18 | 0 | 0.03 | 1 | 0 | 7.6 | 0.22 (2024) |
| Malta | 99 | 18 | 0 | 0.03 | 13 | 0 | 31.1 | 0.65 (2023) |
| Bosnia & Herzegovina | 102 | 17 | 1 | 0.03 | 7 | 2 | 5.4 | 0.21 (2024) |
| Cameroon | 103 | 16 | 0 | 0.02 | 2 | 1 | 0.5 | n/a |
| Dominican Rep. | 103 | 16 | 0 | 0.02 | 7 | 0 | 1.4 | n/a |
| Libya | 103 | 16 | 0 | 0.02 | 1 | 0 | 2.1 | n/a |
| North Macedonia | 103 | 16 | 0 | 0.02 | 14 | 0 | 8.8 | 0.37 (2024) |
| Sudan | 103 | 16 | 0 | 0.02 | 5 | 0 | 0.3 | 0.23 (2005) |
| Uganda | 108 | 14 | 0 | 0.02 | 1 | 0 | 0.3 | 0.44 (2023) |
| Syria | 109 | 13 | 0 | 0.02 | 2 | 0 | 0.5 | 0.04 (2022) |
| Tanzania | 109 | 13 | 0 | 0.02 | 2 | 2 | 0.2 | 0.51 (2013) |
| Yemen | 109 | 13 | 0 | 0.02 | 2 | 1 | 0.3 | n/a |
| DR Congo | 112 | 11 | 0 | 0.02 | 3 | 0 | 0.1 | 0.41 (2015) |
| Albania | 113 | 10 | 0 | 0.01 | 5 | 0 | 4.3 | 0.20 (2022) |
| Grenada | 113 | 10 | 0 | 0.01 | 3 | 0 | 85.2 | n/a |
| Réunion | 115 | 8 | 0 | 0.01 | 4 | 0 | n/a | n/a |
| Antigua and Barbuda | 116 | 7 | 0 | 0.01 | 1 | 0 | 74.3 | n/a |
| Senegal | 116 | 7 | 0 | 0.01 | 0 | 1 | 0.4 | 0.58 (2015) |
| Somalia | 116 | 7 | 0 | 0.01 | 0 | 0 | 0.4 | n/a |
| Afghanistan | 119 | 6 | 0 | 0.01 | 0 | 0 | 0.1 | n/a |
| Honduras | 119 | 6 | 0 | 0.01 | 1 | 0 | 0.5 | 0.06 (2019) |
| St. Kitts & Nevis | 119 | 6 | 0 | 0.01 | 3 | 0 | 127.9 | n/a |
| Kosovo | 119 | 6 | 1 | 0.01 | 4 | 1 | 3.8 | n/a |
| Angola | 123 | 5 | 0 | 0.01 | 0 | 0 | 0.1 | 0.03 (2016) |
| Botswana | 123 | 5 | 0 | 0.01 | 1 | 0 | 2.0 | 0.56 (2013) |
| Ivory Coast | 123 | 5 | 0 | 0.01 | 5 | 0 | 0.2 | 0.07 (2016) |
| Guatemala | 123 | 5 | 0 | 0.01 | 0 | 0 | 0.3 | 0.01 (2023) |
| Congo | 127 | 4 | 0 | 0.01 | 0 | 0 | 0.6 | 0.38 (2022) |
| Gibraltar | 127 | 4 | 0 | 0.01 | 1 | 0 | 99.7 | n/a |
| Gambia | 127 | 4 | 0 | 0.01 | 2 | 0 | 1.4 | 0.07 (2018) |
| Myanmar | 127 | 4 | 0 | 0.01 | 1 | 0 | 0.1 | 0.02 (2023) |
| Mongolia | 127 | 4 | 0 | 0.01 | 1 | 0 | 1.1 | 0.08 (2022) |
| Nicaragua | 127 | 4 | 0 | 0.01 | 1 | 1 | 0.6 | 0.11 (2015) |
| El Salvador | 127 | 4 | 0 | 0.01 | 0 | 0 | 0.6 | 0.10 (2023) |
| Zambia | 127 | 4 | 0 | 0.01 | 1 | 0 | 0.2 | 0.28 (2008) |
| Guadeloupe | 135 | 3 | 0 | 0.0 | 3 | 4 | n/a | n/a |
| Maldives | 135 | 3 | 0 | 0.0 | 0 | 0 | 5.7 | n/a |
| Mozambique | 135 | 3 | 0 | 0.0 | 0 | 0 | 0.1 | 0.31 (2015) |
| Barbados | 138 | 2 | 0 | 0.0 | 1 | 0 | 7.1 | n/a |
| Curaçao | 138 | 2 | 0 | 0.0 | 0 | 0 | 12.8 | n/a |
| Cambodia | 138 | 2 | 0 | 0.0 | 0 | 0 | 0.1 | 0.09 (2015) |
| Monaco | 138 | 2 | 0 | 0.0 | 0 | 0 | 52.2 | 0.04 (2005) |
| Mali | 138 | 2 | 0 | 0.0 | 0 | 0 | 0.1 | 0.15 (2023) |
| Martinique | 138 | 2 | 0 | 0.0 | 1 | 0 | n/a | n/a |
| Mauritius | 138 | 2 | 0 | 0.0 | 1 | 0 | 1.6 | 0.26 (2024) |
| Malawi | 138 | 2 | 0 | 0.0 | 1 | 0 | 0.1 | 0.18 (2019) |
| Togo | 138 | 2 | 0 | 0.0 | 0 | 0 | 0.2 | 0.22 (2024) |
| Tajikistan | 138 | 2 | 0 | 0.0 | 0 | 0 | 0.2 | 0.09 (2020) |
| Zimbabwe | 138 | 2 | 0 | 0.0 | 0 | 0 | 0.1 | n/a |
| Anguilla | 149 | 1 | 0 | 0.0 | 0 | 0 | n/a | n/a |
| Burkina Faso | 149 | 1 | 0 | 0.0 | 0 | 1 | 0.0 | 0.10 (2024) |
| Bhutan | 149 | 1 | 0 | 0.0 | 0 | 0 | 1.3 | 0.10 (2024) |
| Laos | 149 | 1 | 0 | 0.0 | 0 | 0 | 0.1 | 0.04 (2002) |
| Liberia | 149 | 1 | 0 | 0.0 | 0 | 0 | 0.2 | n/a |
| Lesotho | 149 | 1 | 0 | 0.0 | 0 | 0 | 0.4 | 0.09 (2023) |
| Mauritania | 149 | 1 | 0 | 0.0 | 0 | 0 | 0.2 | 0.01 (2018) |
| Namibia | 149 | 1 | 0 | 0.0 | 0 | 0 | 0.3 | 0.65 (2022) |
| New Caledonia | 149 | 1 | 0 | 0.0 | 0 | 0 | 3.4 | n/a |
| Suriname | 149 | 1 | 0 | 0.0 | 0 | 0 | 1.6 | n/a |
Source: OpenAlex [1]; World Bank [4] [5]; IQ Metrics calculation. The CSV under Data has every year from 2000 for every country.
What we looked for and could not confirm
Each line is a gap in what we could read from an official source, not proof that the money or the programme does not exist.
| Item | What we found |
|---|---|
| China brain project: total budget | The Ministry of Science and Technology guide of 2021 gives 3.148 billion yuan for that year’s call. We found no official total for the whole project and no later yearly guide with an amount we could read. |
| US BRAIN Initiative: FY2014-FY2021 and FY2026 | The NIH budget page states FY2022-FY2025 in its text; earlier years appear only as bars in a chart without numbers, so we did not type them. FY2026 is not on the page copy of June 2026. |
| Korea Brain Initiative | Plans and yearly budgets were reported in news; we could not read an official budget document within this study, so Korea is not in the money table. |
| Australian Brain Alliance | We found no national government grant for an Australian brain initiative in the sources we read. |
| Human Brain Project: national co-funding | The 2013 plan of one billion euros counted on national and other money as well as EU grants; only the four EU grants (CORDIS) are documented line by line. |
| China: yearly neuroscience funding | No public yearly figure for neuroscience comparable to the NIH research category. |
Source: NIH [9]; MOST [17]; European Commission [11]; gaps listed by IQ Metrics
13 How we built the dataset
- 01
Search for an existing count
Before building, we searched for a published country-by-year count of neuroscience papers for 2000-2026. We found studies of earlier periods and rankings of a fixed set of journals, not an open yearly count to 2026, so we built one.
- 02
Define neuroscience once
We used OpenAlex’s Neuroscience field (fields/28): journal articles and reviews whose primary topic lies in it. Clinical neurology, which OpenAlex files under medicine, is shown separately as a check.
- 03
Count with open queries
About 90 OpenAlex queries (filter and group-by only), one per year for all papers and for the top 1%, plus world totals, US-China joint papers and subfields. Every response is saved; a script re-derives every number (260 checks).
- 04
Read money only from official sources
Budget figures come from NIH, the White House, the European Commission and CORDIS, China’s Ministry of Science and Technology, Japan’s MEXT and AMED, and the Government of Canada. Each figure is checked against the saved page by script; news figures were leads only.
- 05
Label our own arithmetic
Shares, ratios, ranks, growth rates, papers per million and currency conversions are IQ Metrics calculations from those counts and World Bank data. Missing values stay missing.
Read every number with these in mind
- OpenAlex grows: it adds journals and records every year, so the world total rises partly because coverage rises. Compare countries within a year, and read long trends with the world totals beside them.
- Papers with no author country in OpenAlex (31% in 2000, 15% in 2025) are in the world total but credited to no country.
- Whole counting gives a joint paper to each country. With fractional counting (a share per author) both countries would score lower; OpenAlex group counts do not offer it.
- The field is OpenAlex’s automatic classification of each paper’s main topic. A different definition (journal lists, keywords) gives different totals; the clinical neurology check shows the same order.
- China means mainland China as OpenAlex codes it; Hong Kong and Taiwan are counted separately. Taiwan has no World Bank population, so it has no per-person value.
- Top 1% flags depend on citations so far; papers from 2024 and later are provisional.
- Budget figures differ in kind (one year, a call, a programme, a plan) and are converted at 2024 rates without inflation adjustment. They are shown as stated, not added into one total.
- 2026 counts run to 9 November 2026 and are not a full year.
- Nothing on this page measures the intelligence of any country or people. It counts research output and money.
Sources
- OurResearch. OpenAlex: works whose primary topic is in the field Neuroscience (fields/28), journal articles and reviews, 2000-2026, grouped by publication year and by authors' countries (filter and group_by API queries; every response cached). 2026. api.openalex.org/fields/28CC0 1.0 (public domain dedication)
- OurResearch. OpenAlex documentation: the work object (authorships and countries; fwci and citation_normalized_percentile, normalised for works of the same type, year and subfield). 2026. docs.openalex.org/api-entities/works/work-objectDocumentation, facts cited
- Frontiers. Yeung AWK, Goto TK, Leung WK. The changing landscape of neuroscience research, 2006-2015: a bibliometric study. Frontiers in Neuroscience 2017; 11: 120. 2017. doi.org/10.3389/fnins.2017.00120CC BY 4.0 (facts cited)
- World Bank. World Bank, World Development Indicators: Population, total (SP.POP.TOTL), 2000-2025. 2026. data.worldbank.org/indicator/SP.POP.TOTLCC BY 4.0
- World Bank. World Bank, World Development Indicators: Research and development expenditure, % of GDP (GB.XPD.RSDV.GD.ZS; UNESCO Institute for Statistics data), latest year per country. 2026. data.worldbank.org/indicator/GB.XPD.RSDV.GD.ZSCC BY 4.0
- World Bank. World Bank, World Development Indicators: Researchers in R&D per million people (SP.POP.SCIE.RD.P6), latest year per country. 2026. data.worldbank.org/indicator/SP.POP.SCIE.RD.P6CC BY 4.0
- World Bank. World Bank, World Development Indicators: Official exchange rate (PA.NUS.FCRF) and PPP conversion factor, GDP (PA.NUS.PPP), 2024. 2026. data.worldbank.org/indicator/PA.NUS.FCRFCC BY 4.0
- US National Institutes of Health. National Institutes of Health, RePORT: Estimates of Funding for Various Research, Condition, and Disease Categories (RCDC), category Neurosciences, FY2008-FY2025 (table published 23 June 2026). 2026. report.nih.gov/funding/categorical-spendingUS government work, public domain
- US National Institutes of Health. NIH BRAIN Initiative: Understanding the BRAIN Initiative Budget (FY2022-FY2025 totals; read from the Internet Archive copy of 8 June 2026, because the live page answers scripts with a bot check). 2025. braininitiative.nih.gov/funding/understanding-brain-initiative-budgetUS government work, public domain
- The White House (archived by the National Archives). The White House, Office of the Press Secretary: Fact Sheet: BRAIN Initiative, 2 April 2013 (National Archives copy). 2013. obamawhitehouse.archives.gov/the-press-office/2013/04/02/fact-sheet-brain-initiativeUS government work, public domain
- European Commission. European Commission press release IP/13/54: Graphene and Human Brain Project win largest research excellence award in history, Brussels, 28 January 2013. 2013. ec.europa.eu/commission/presscorner/detail/en/IP_13_54© European Union, reuse authorised (Commission Decision 2011/833/EU)
- European Commission, CORDIS. CORDIS: The Human Brain Project (HBP), grant agreement 604102, FP7 (ramp-up phase). 2026. cordis.europa.eu/project/id/604102© European Union, CC BY 4.0
- European Commission, CORDIS. CORDIS: Human Brain Project Specific Grant Agreement 1 (HBP SGA1), grant agreement 720270, Horizon 2020. 2026. cordis.europa.eu/project/id/720270© European Union, CC BY 4.0
- European Commission, CORDIS. CORDIS: Human Brain Project Specific Grant Agreement 2 (HBP SGA2), grant agreement 785907, Horizon 2020. 2026. cordis.europa.eu/project/id/785907© European Union, CC BY 4.0
- European Commission, CORDIS. CORDIS: Human Brain Project Specific Grant Agreement 3 (HBP SGA3), grant agreement 945539, Horizon 2020. 2026. cordis.europa.eu/project/id/945539© European Union, CC BY 4.0
- European Commission, CORDIS. CORDIS: EBRAINS 2.0, grant agreement 101147319, Horizon Europe (research infrastructures). 2026. cordis.europa.eu/project/id/101147319© European Union, CC BY 4.0
- Ministry of Science and Technology of China. Ministry of Science and Technology of the People's Republic of China: notice Guo Ke Fa Zi (2021) No. 265 and the 2021 application guide of the STI 2030 major project "Brain Science and Brain-Inspired Research" (16 September 2021; posted on ncsti.gov.cn, source: MOST website). 2021. www.ncsti.gov.cn/kjdt/tzgg/202109/t20210917_41775.htmlOfficial government notice, facts cited
- MEXT, Japan. Ministry of Education, Culture, Sports, Science and Technology (MEXT): FY2025 administrative project review, Brain Neuroscience Integrated Program (founded FY2014 as Brain/MINDS; FY2024 and FY2025 budgets). 2025. www.mext.go.jp/content/20250609-mxt_kaikesou02-000043010_19.pdfGovernment of Japan Standard Terms of Use 2.0 (CC BY 4.0 compatible); facts cited
- AMED. Japan Agency for Medical Research and Development (AMED): Brain/MINDS project summary (a 10-year project from FY2014). 2024. www.amed.go.jp/content/000138894.pdfFacts cited
- Government of Canada. Government of Canada news release: Government of Canada Supports Brain Canada's Research Programs to Improve Brain Health, May 2024 (Budget 2024: $80 million over four years; $200 million committed through Budgets 2011, 2016, 2019 and the 2021 renewal). 2024. www.canada.ca/en/environment-climate-change/news/2024/05/government-of-canada-supports-brain-canadas-research-programs-to-improve-brain-health-80-million-over-four-years-would-support-the-advancement-of-b.htmlGovernment of Canada, facts cited
- Health Canada. Health Canada: Evaluation of the Contribution to Brain Canada Foundation's Canada Brain Research Fund 2011-12 to 2015-16 (the 2011 federal budget allocation of $100 million and the 1:1 match). 2017. www.canada.ca/en/health-canada/corporate/transparency/corporate-management-reporting/evaluation/2011-2012-2015-2016-contribution-brain-research-fund.htmlGovernment of Canada, facts cited
- IQ Metrics. IQ Metrics Research: How many people have a brain chip? Every implant counted, 1998-2026 (our dataset, as of 29 October 2026). 2026. iqmetrics.org/research/brain-implant-countCC BY 4.0
Version history
- 2026.119 November 2026First release. Next update due November 2027 with the full 2026 counts (the first year China could pass the US on current growth), or sooner if NIH publishes the FY2026 BRAIN budget or China’s Ministry of Science and Technology publishes a total for its brain project.
Leon Falkner, Data & Research Analyst. Leon owns the arithmetic on IQ Metrics: the percentile tables, the score converter and the figures in everyone else's drafts. On the research desk Leon pulls the data, builds each index and writes the method. More about Leon.
Questions
Is China ahead of the US in neuroscience?
No. In 2025 US researchers were on 18,520 neuroscience papers and Chinese researchers on 14,534, 78% of the US count, by IQ Metrics' count of OpenAlex records. The US also leads the top 1% most-cited papers, 393 to 240.
Who leads the world in neuroscience research?
The United States, 1st in neuroscience papers every year from 2000 to 2026. China has been 2nd since 2013, ahead of the United Kingdom, Germany and Japan. Per person, Switzerland publishes the most: 146 papers per million people in 2025.
When will China overtake the US in neuroscience?
Nobody can say for certain. If China kept its 2020-2025 growth of 12.9% a year and the US count stayed flat, China would pass the US in about 2027. In 2026 so far China is at 89.7% of the US count, its closest yet.
Has China overtaken the US in science overall?
Yes, in paper counts. Across all fields in OpenAlex, China has had more papers than the United States every year since 2022, and more top 1% most-cited papers since 2022. Neuroscience is one of the fields where it has not.
What was the Human Brain Project?
The Human Brain Project was a European Union flagship research project from 2013 to 2023 that built brain simulation and data platforms. Its lasting product is EBRAINS, a European research infrastructure for brain data, atlases and models, funded again in 2024-2026.
How much did the Human Brain Project cost?
The European Commission announced it in 2013 as set to receive one billion euros over ten years. CORDIS records 381 million euros of EU grants across its four phases; the rest of the plan relied on national and other funding.
How much money does the BRAIN Initiative get?
The NIH BRAIN Initiative had $321 million in FY2025: $230 million base budget plus $91 million from the 21st Century Cures Act. Its peak was $680 million in FY2023, and the Cures Act money ends after FY2026.
What is the China Brain Project?
China's brain project is the "Brain Science and Brain-Inspired Research" major project of its Science and Technology Innovation 2030 programme. Its first call, in September 2021, offered 3.148 billion yuan of national funding across 59 research directions.
Do US and Chinese neuroscientists still publish together?
Yes, but less. Papers with authors in both countries peaked at 1,232 in 2018 and numbered 1,080 in 2025. The share of China's neuroscience papers with a US co-author fell from 18.5% to 7.4%.
Do these paper counts say anything about intelligence?
No. Paper counts measure research systems: how many researchers a country funds and where they publish. They say nothing about the intelligence of a population, and IQ Metrics does not rank countries or peoples by intelligence.
Share it, cite it, download it
You may reuse everything on this page under CC BY 4.0: in articles, reports, lessons and posts. The one condition is credit to IQ Metrics with a link to this page.
Cite this study
Version 2026.11. Citing the version lets readers find the exact numbers.
Archived copy with a DOI: 10.5281/zenodo.24074468 (report PDF and data on Zenodo).
Falkner, L. (2026). Is America losing the lead in brain science? US vs China neuroscience, 2000 to 2026 (Version 2026.11) [Data set]. IQ Metrics Research. https://iqmetrics.org/research/us-vs-china-brain-science/ (DOI: 10.5281/zenodo.24074468)
Falkner, Leon. "Is America losing the lead in brain science? US vs China neuroscience, 2000 to 2026." IQ Metrics Research, 9 Nov. 2026, iqmetrics.org/research/us-vs-china-brain-science/. DOI: 10.5281/zenodo.24074468.
Falkner, Leon. "Is America losing the lead in brain science? US vs China neuroscience, 2000 to 2026." IQ Metrics Research. November 9, 2026. https://iqmetrics.org/research/us-vs-china-brain-science/. DOI: 10.5281/zenodo.24074468.
@misc{iqmetrics2026usvschinabrainscience, author = {Falkner, Leon}, title = {Is America losing the lead in brain science? US vs China neuroscience, 2000 to 2026}, institution = {IQ Metrics}, year = {2026}, version = {2026.11}, doi = {10.5281/zenodo.24074468}, url = {https://iqmetrics.org/research/us-vs-china-brain-science/} }
Source: Leon Falkner, "Is America losing the lead in brain science? US vs China neuroscience, 2000 to 2026." IQ Metrics Research, version 2026.11, https://iqmetrics.org/research/us-vs-china-brain-science/ (DOI 10.5281/zenodo.24074468)
Embed the key numbers
Paste this into an article or post. It lists the main numbers and credits the source.
Get the data
One row per country and year (3601 rows, 2000-2026): neuroscience papers (OpenAlex field Neuroscience, journal articles and reviews, whole counting), papers in the top 1% most cited, shares of the world, ranks, population and papers per million (World Bank), the world totals with and without a known author country, and the US-China co-authored count on the US and China rows.
| Column | What it holds |
|---|---|
iso2, country | Two-letter country code as OpenAlex gives it (CN = mainland China; HK, TW separate) and the country name |
year, year_complete | Publication year; "no" for 2026, which runs to 9 November 2026 |
papers, papers_top1pct | Papers with at least one author in the country (whole counting), and those in the top 1% most cited of their year and subfield |
share_of_papers_with_country_pct, share_of_top1pct_pct | The country's papers as a percentage of all papers with a known author country that year, and its share of the top 1% papers (shares add up to more than 100) |
rank_papers, rank_top1pct | The country's rank among all countries that year (1 = most; ties share a rank) |
population, papers_per_million | World Bank population of the same year (blank where the World Bank has none) and papers per million people |
world_papers, world_papers_with_country, world_papers_no_country, world_top1pct | World totals that year: all neuroscience papers, those with at least one author country, those with none, and the top 1% papers |
us_china_coauthored_papers | Papers with authors in both the US and China that year (on the US and China rows only) |
counting, source | The counting rule and the sources of each row |
For journalists, researchers and teachers
Everything on this page may be quoted, charted and republished with credit. No embargo, no permission needed, no sign-up. If you need a number that is not here, ask.
Summary you can paste
Plain news style. Edit freely; keep the credit.
IQ Metrics Research counted every journal article and review in OpenAlex's Neuroscience field by author country, 2000-2026 (whole counting), with the top 1% most cited, US-China co-authored papers, eight subfields and papers per person, and read the money of the national brain projects from official sources. The United States had 18,520 neuroscience papers in 2025 and China 14,534 (78.5%); China has been 2nd since 2013 and is at 89.7% in 2026 so far. In the top 1% most cited the US leads 393 to 240. Across all sciences China has led since 2022. Source: IQ Metrics Research, https://iqmetrics.org/research/us-vs-china-brain-science/
Angles for a story
- China is at 78% of the US in neuroscience papers and closing (Figure 1)
- Neuroscience is the exception to China’s lead in science (Figure 7)
- From 14th to 2nd in 13 years (Figure 2)
- The US keeps a wide lead in the most-cited papers (Figure 6)
- US-China co-authored papers have fallen since 2018 (Figure 12)
- The Human Brain Project: one billion euros announced, 381 million in EU grants (Figure 14)
Quotes you can use
Attributable as written, with the name and title. For a different angle or a quote on a specific figure, ask through the contact page.
China out-publishes America in science as a whole, but not yet in neuroscience. In 2025 it was at 78% of the US count, and in 2026 so far it is closer than ever.
Leon Falkner, Data & Research Analyst, IQ Metrics ResearchThe American lead is widest where it matters most to other scientists: among the most-cited neuroscience papers, the US had 393 last year and China 240.
Leon Falkner, Data & Research Analyst, IQ Metrics ResearchThe flagship brain projects are small money. NIH spent about $11.9 billion on neuroscience in FY2025; the BRAIN Initiative was $321 million of that.
Leon Falkner, Data & Research Analyst, IQ Metrics Research
Files
- CSV of every country and year, 2000-2026: papers, top 1% most cited, share, rank, population and papers per million, with the world totals (CC BY 4.0)
- Every figure as a print-ready PNG: use the Image button under each figure
- Embed code and data table under every figure
- Share images for social media in three sizes, with the credit line built in
- Citations in APA, MLA, Chicago, BibTeX and plain text
Terms, contact and corrections
Credit: “IQ Metrics Research, Is America losing the lead in brain science? (2026)” with a link to this page. On air or in print, “IQ Metrics” and the page address are enough.
What it covers: journal articles and reviews in OpenAlex’s Neuroscience field, 2000-2026, whole counting, as of 9 November 2026; official budget figures of six national brain programmes. Output, not ability.
Contact: the research team, through the contact page. Corrections are made on this page with a dated note in the version history.
Related research