IIF Certified Assessment
Start IQ Test
IIF Certified Assessment
No state has a measured average IQ. The popular tables convert school test scores from 2005 into IQ points, the spread between typical states is about two points on that scale, and the poverty gap inside one state is bigger than the whole map.
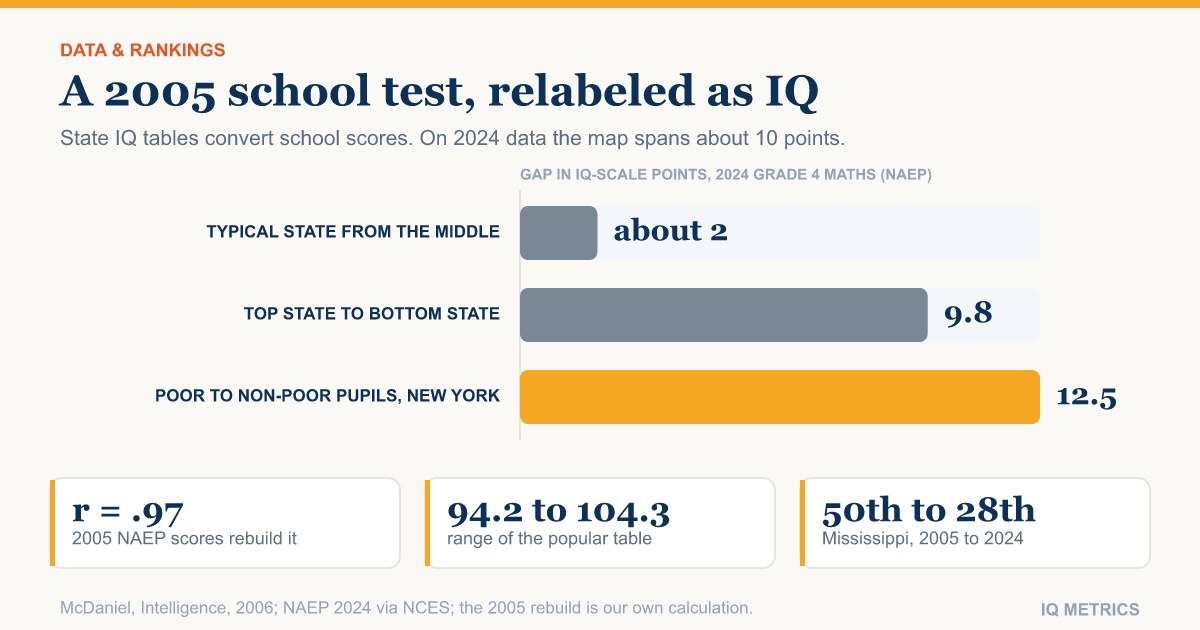
There is no official average IQ for any US state, and no state has tested a representative sample of its residents. Every “IQ by state” table is an estimate built from something else. The most widely copied one converts school test scores from 2005 into IQ points and lists Massachusetts first (104.3) and Mississippi last (94.2). This article shows where those numbers come from, the arithmetic that turns a test score into an “IQ”, and how large the differences really are.
Almost all of them trace back to a few papers, and none used an IQ test on a sample of each state’s residents. Three recipes sit behind the tables that circulate:
The tables on ranking sites are mostly copies of the first one. We compared the 50 values on World Population Review’s ranking page, updated 18 September 2026, with McDaniel’s column as reproduced from the paper’s table and found no differences, although that page credits the 2022 paper, whose own table differs (the two correlate at .91). In other words, a 2006 estimate built from 2005 pupils is circulating as current data under another author’s name.
The recipe is short. Take a state’s average on a school test, subtract the national average, divide by the standard deviation of student scores, multiply by 15 and add 100. On the 2024 grade 4 mathematics NAEP, the national average was 237.3 and the student standard deviation 34.7 points. Massachusetts averaged 246.5, which is 0.26 standard deviations above the nation, or +4.0 on the IQ scale. New Mexico averaged 223.9, 0.39 below, or −5.8. Testing the idea against the old table, we averaged four 2005 NAEP z-scores per state (grades 4 and 8, reading and mathematics) and scaled at about 15 points per standard deviation. That reproduces McDaniel’s column with a correlation of .97 across the 50 states. It is consistent with his method, though it is a reconstruction, not a replication of his formula, which we could not read in full.
Two assumptions sit inside that arithmetic. The first is that achievement stands in for ability. NAEP measures what pupils were taught as well as how well they reason, and Pesta’s paper quotes other researchers describing it as a mix of general ability and specific knowledge that leans toward learned skills, which is why achievement tests and IQ tests are not interchangeable. The second is that the spread of achievement scores can be relabeled as the spread of IQ scores: multiplying by 15 is a convention, not a measurement. Our explainer on SD 15 versus SD 16 shows how much a scale’s standard deviation alone changes the numbers.
Smaller than the maps suggest. Converted the same way, the gap between the top and bottom states on the four 2024 NAEP tests is 8.5 to 9.8 IQ-scale points, with Massachusetts first and New Mexico last every time. But the typical state is close to the middle: the standard deviation of the 50 state averages is 1.8 to 2.3 IQ-scale points, and by our rough, unweighted estimate differences between states account for only about 1.4% to 2.4% of the variation in pupils’ scores. The rest is variation among pupils inside states.
Inside New York’s 2024 grade 4 data, the gap between economically disadvantaged pupils and the rest, 223 against 252, is about 12.5 IQ-scale points: larger than the whole spread between the top and bottom states.
Because it describes 2005 pupils. State averages have moved since, and unevenly: the rank correlation between states’ 2005 and 2024 averages (mean of the four tests) is only about .65. Mississippi is the clearest example. It ranks 50th of 50 in the 2005 reconstruction and 28th in 2024. Its 2024 grade 4 mathematics average, 239, sat above the national 237 and was not statistically different from it, up from 211 in 2000, and it ranked 9th of 50 in grade 4 reading. New Mexico, by contrast, is last on all four 2024 tests.
The National Center for Education Statistics (NCES) also cautions that many pairs of states are not statistically distinguishable. New York’s grade 4 mathematics average of 234 was above 3 jurisdictions, below 18 and not significantly different from 30 others. A ranking that puts a single point between neighbors is ranking noise.
Because who sits the test decides the average. In the class of 2025, Illinois tested 99% of graduates and averaged 961 on the SAT; North Dakota tested about 1% and averaged 1,254. That 293-point gap is 1.25 standard deviations of the national SAT distribution (SD 235), produced almost entirely by who takes the test. The ACT shows the same pattern: Connecticut, with 6% of graduates tested, averaged 27.1, while Nevada, which tests all graduates, averaged 17.2. The College Board itself advises against comparing states on these averages. Our SAT-to-IQ guide covers the conversion problem for individuals.
Not in a form anyone has published as state averages. The adult skills survey PIAAC measured literacy and numeracy in adults aged 16 to 74, but its state figures are modeled: about 12,330 respondents pooled from 2012, 2014 and 2017, of whom 44 of the 51 areas had any at all (roughly 40 to 1,200 per state), combined with census covariates. They are predictions, not measurements. NCES reports Alaska, Minnesota, New Hampshire and Vermont among the top five for both literacy and numeracy, and Louisiana, Mississippi, Nevada, New Mexico and Texas as the bottom five. Alaska’s adult estimate sits beside its pupils’ 2024 NAEP rank of 46th to 49th of 50, a reminder that adults and pupils can rank states differently.
The National Longitudinal Survey of Youth 1979 gave 11,914 young people the military aptitude battery in 1980 and recorded where they lived, but the state codes are restricted and we found no published state averages from it. See ASVAB and AFQT scores for what that battery reports.
None has a measured one. On the older table, Massachusetts leads (104.3), then New Hampshire (104.2) and North Dakota (103.8). On Pesta’s 2022 estimate, New Hampshire leads (103.2), then Massachusetts (103.1) and Minnesota (102.9). On the 2024 NAEP, Massachusetts leads all four tests. Between neighboring states the differences are often a point or two on the IQ scale, the kind of gap NCES cautions readers not to rank without significance tests. On the bell curve, the whole 10-point spread between the top and bottom of the older table is two-thirds of a single standard deviation, and the percentile calculator shows how little a two-point difference moves a percentile.
A state average, however it is built, says nothing about any one person in it. An individual’s score comes from a full test with a stated scale, a percentile and a confidence range.
Find your IQ score now! →So: what is the average IQ by US state? Nobody knows, because nobody has measured it. The tables that circulate are 2005 school scores relabeled as IQ, the true spread between typical states is a couple of points on that scale, and the poverty gap inside a single state is larger than the gap between the top and bottom states. For the international version of the same problem, see country IQ rankings and what the data cannot support and average IQ by country. To see where your own reasoning sits, try the full IQ test.
No state has a measured IQ. The most-copied table, built from 2005 school test scores, lists Massachusetts first at 104.3. A 2022 estimate lists New Hampshire first at 103.2, and Massachusetts leads all four 2024 NAEP school tests.
No. Federal sources publish achievement scores (NAEP) and modeled adult-skill estimates (PIAAC), not IQ. Every state IQ table converts one of those, or SAT averages, into an IQ-style number.
Mostly from McDaniel’s 2006 paper in Intelligence, which converted NAEP reading and mathematics scores for grades 4 and 8 to an IQ scale. A 2022 paper by Pesta averaged NAEP-based and adult-skill (PIAAC) estimates.
No state has a measured IQ. The older table lists Mississippi last at 94.2, but Mississippi’s 2024 grade 4 mathematics average was not significantly different from the national average. New Mexico ranks last on all four 2024 NAEP tests, about 8.5 to 9.8 IQ-scale points below the top.
Small. On 2024 NAEP data the top-to-bottom range is about 8.5 to 9.8 IQ-scale points, and the typical state is within about 2 points of the middle. The gap between poor and non-poor pupils inside one state can be larger than that.
Corrections: spotted an error? Email corrections@iqmetrics.org and we will update this story and note the change here.
National reading results have dropped again, and around forty per cent of American fourth-graders are now below the NAEP Basic level. That is a fact about an achievement test, and achievement tests are built to show exactly the movement an IQ score is built to hide.
The tables that circulate as national IQ figures come from one compilation built out of whatever studies existed, in whatever years, on whatever samples. Several of the numbers were estimated rather than measured.
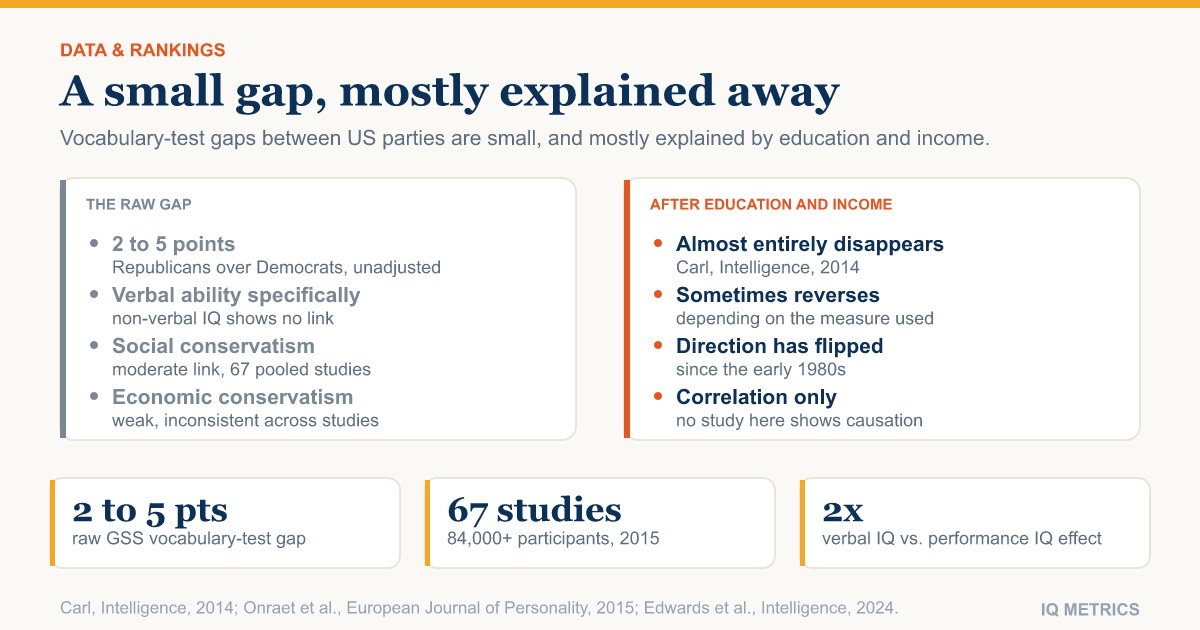
Surveys going back to the 1970s tie vocabulary-test scores to party identification. The gap is small, mostly explained by education and income, concentrated in verbal ability specifically, and has partly reversed since the 1980s.
Our IIF-certified assessment reports your score with its scale, percentile and confidence range — and a breakdown of the cognitive domains behind it.
Start IQ Test →