
Does IQ Predict School Success? What Fifty Years of Data Show
IQ predicts school achievement better than any other single measure psychologists have found, and still leaves roughly three-quarters of the variation unexplained. Both halves of that sentence get ignored by somebody. Here are the actual correlations, what they mean for one child, and what accounts for the rest.
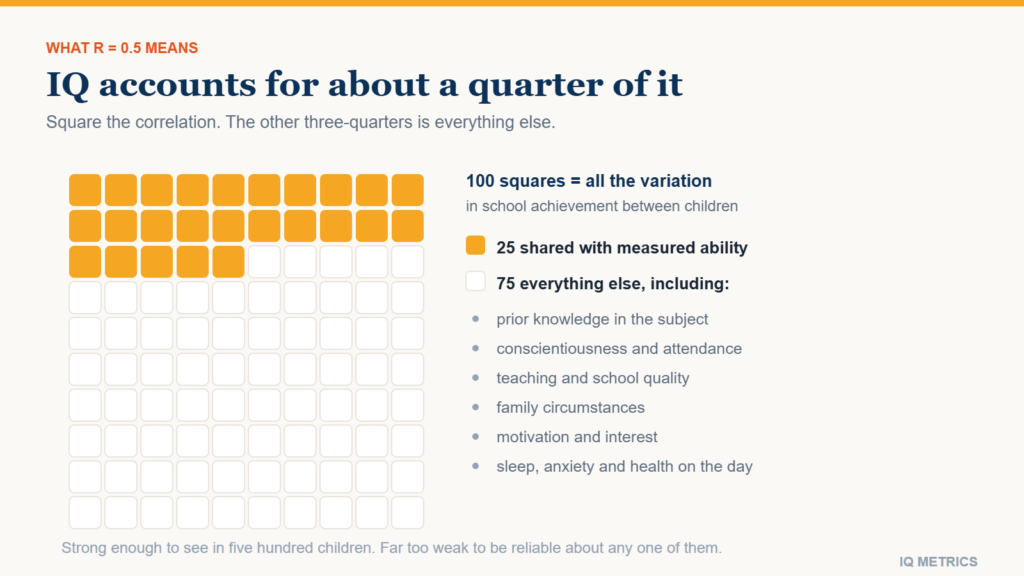
IQ predicts school success better than any other single measure psychologists have found, and it still leaves most of the variation unexplained. Correlations between cognitive ability scores and school achievement usually land around 0.5, sometimes as high as 0.7 for standardised achievement tests in younger samples. That is a strong result by the standards of social science. It also means roughly three-quarters of the differences between children are about something else.
Almost every argument about testing in schools comes from taking one half of that sentence and dropping the other. Advocates quote the strength of the correlation to justify selecting children by it; critics quote the unexplained remainder to argue the measure is worthless. Both are reading a real number as though it answered a question it does not address.
What a correlation of 0.5 actually means
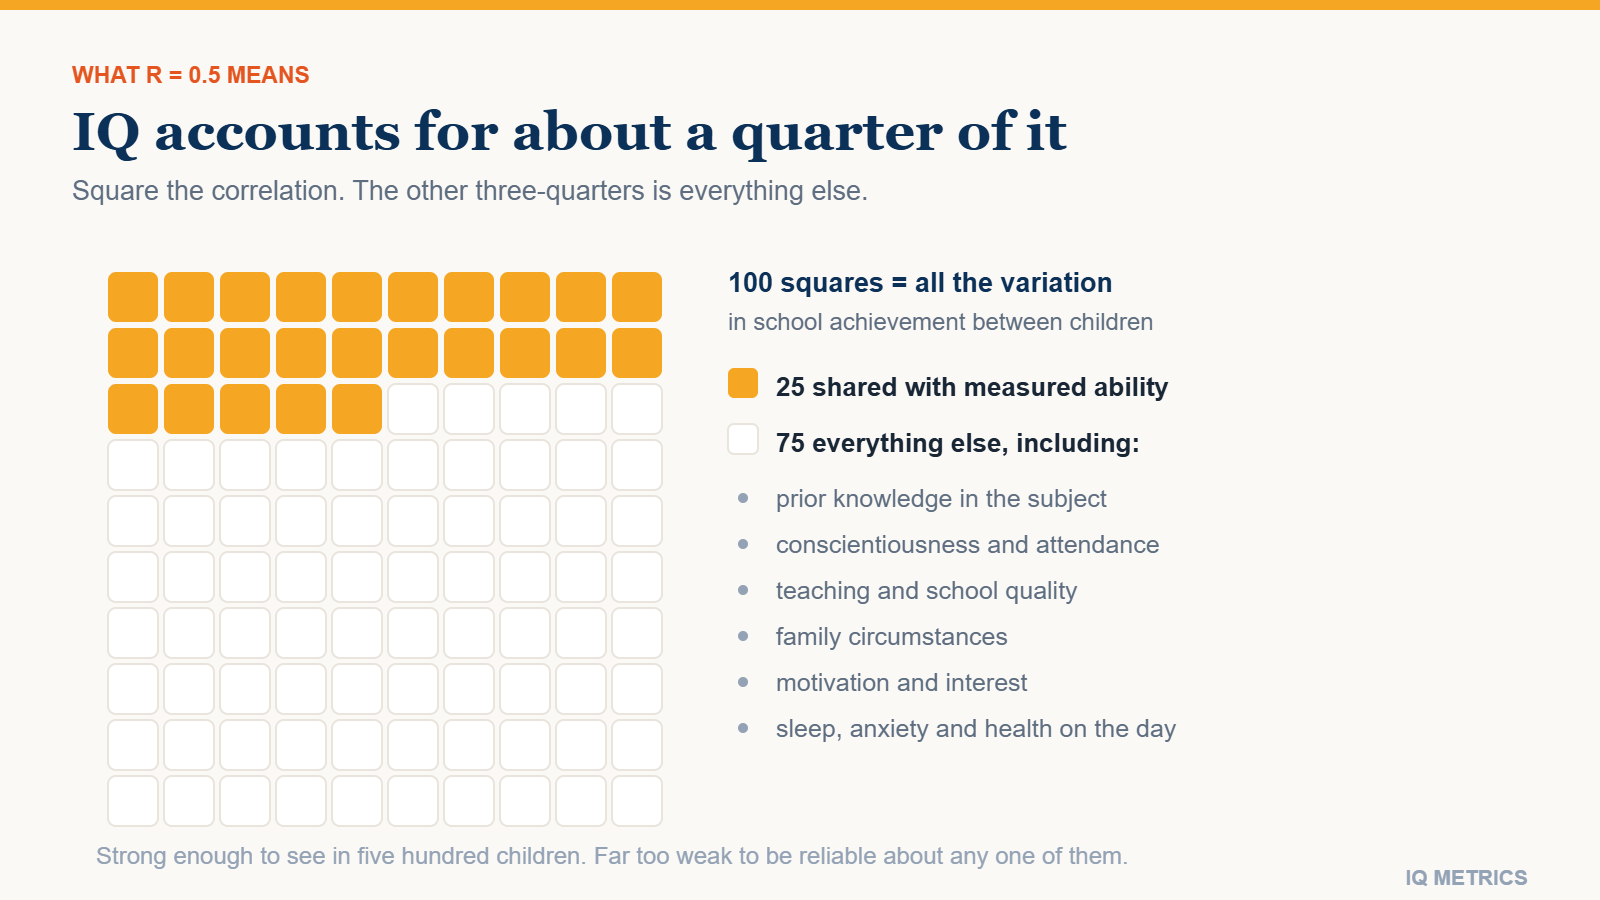
Square it. A correlation of 0.5 corresponds to about 25 per cent of the variance in the outcome being statistically associated with the predictor. Three-quarters is not.
Concretely: among children with the same IQ score, school achievement still varies enormously. The relationship is strong enough to be visible in a group of five hundred and far too weak to be reliable about any one of them. This is the single most common misreading of the literature — treating a solid group-level correlation as an individual-level forecast.
The numbers, outcome by outcome
The correlation is not one figure. It depends heavily on what is being predicted.
- Standardised achievement tests: about 0.5 to 0.7. The strongest relationship, and unsurprising — achievement tests and ability tests share format, timing and reasoning demands.
- School grades: about 0.4 to 0.5. Consistently lower, for reasons worth a section of their own.
- Years of education completed: around 0.5. Reasonably strong, but heavily entangled with family circumstances.
- Performance within a selective university: weak. Once a group has been filtered on ability, the remaining range is narrow and the correlation shrinks accordingly.
Age matters too, and in a direction that surprises people. The correlation between measured ability and achievement tends to be strongest in the primary years and to weaken through secondary school and beyond. Part of that is restriction of range as cohorts get filtered; part is that accumulated subject knowledge, study habit and choice of subject increasingly dominate as the material gets more specialised. A reasoning test predicts best when there is least to have already learned.
That last point is restriction of range, and it explains a great deal of apparently contradictory research. A predictor always looks weaker inside an already-selected group. The same effect appears when cognitive tests are used in hiring, where the candidate pool has usually been screened already.
Why grades track IQ less closely than test scores
A grade is not a measurement of what a student knows. It is a composite of what they know, whether they handed it in, whether they attended, how they behaved, and a teacher’s judgment of all of that.
The best-known study on this point followed eighth-graders and found that a measure of self-discipline outpredicted IQ for report card grades by a substantial margin — while IQ remained the better predictor of standardised achievement test scores in the same children. Both findings are in the same paper, and quoting either one alone misrepresents it. Conscientiousness wins where sustained daily compliance is measured; ability wins where a single unfamiliar reasoning task is measured.
What accounts for the other three-quarters
- Prior knowledge. The strongest predictor of learning something new is usually how much of the surrounding subject you already know.
- Conscientiousness and self-discipline. Homework completion, attendance, deadline behaviour.
- Teaching and school quality. Large effects, unevenly distributed.
- Family circumstances. Books, quiet space, illness, stability, adult time.
- Motivation and interest. Also partly a consequence of earlier success, which makes the causal arrows circular.
- Test conditions on the day. Sleep, anxiety and illness all move scores, as the evidence on test anxiety shows.
A word on grit specifically, since it is often offered as the answer. Meta-analytic work suggests grit is largely a relabelling of conscientiousness and adds modest incremental prediction of academic performance beyond it. The broader point survives; the specific construct is weaker than its popularity implies.
Where would your own score land?
Take the IIF-certified assessment and get your score with the scale it was measured on, the percentile it corresponds to and the confidence range around it — the three figures most online tests leave out.
The confound that will not go away
Socioeconomic status correlates with measured ability and with school achievement independently, which makes every simple comparison ambiguous. A family with more resources supplies more books, quieter study space, better nutrition, more adult conversation, less disruption from moving house or illness, and more experience of the conventions a test is written in. All of that raises the score and the achievement at once.
Studies control for it statistically, and controlling is not the same as removing it. The variables available in a dataset — parental income, parental education, an area deprivation index — are crude stand-ins for a diffuse advantage, so residual confounding is the norm rather than the exception. Treat any estimate of the ability-achievement link as an upper bound on the causal contribution of ability, not a measurement of it.
There is one finding worth flagging because it is frequently over-read in both directions: several studies report that the heritability of cognitive ability appears lower in more deprived environments, which would imply that circumstance constrains what ability can express. The result has replicated in some samples and failed to in others, and it should be held loosely. The wider evidence on inheritance is set out in what twin studies actually show.
Causation runs both ways
It is tempting to read all this as ability causing achievement. The arrow is not one-directional.
Natural experiments exploiting changes in compulsory schooling laws find that additional years of education raise IQ scores, with estimates commonly in the range of one to five points per year. Schooling does not merely reveal ability; it partly builds the thing the test measures. That is consistent with the twentieth century’s rising scores described in why IQ norms expire, and with the careful account of what can and cannot be changed in whether you can improve your IQ. It also sits alongside the genetic evidence rather than against it: heritability describes variation in a population under given conditions, and says nothing about how much a score would move if the conditions changed.
The practical consequence is that a low score in a child who has missed a great deal of school is not a stable trait measurement. It is a reading taken partly on the schooling. Repeating the assessment after a period of consistent attendance is not redundant — it is the only way to separate the two.
What this means for one child
Four things follow, and they are the practical payoff of everything above.
- A single score is a snapshot with an error band. Childhood scores are less stable than adult ones, as how scores change over time sets out.
- Extreme scores drift toward the average on retesting, for statistical reasons rather than psychological ones — regression to the mean is the mechanism.
- A test taken in a second language, or under an unfamiliar format, measures partly those things — the practical upshot of cultural bias in IQ tests.
- Predicting a group is not forecasting a person. A 25 per cent variance share is a headwind or a tailwind, not a destination.
What follows for schools
The prediction is good enough to be useful for allocating support and poor enough to be dangerous for allocating opportunity. Those two uses look similar and are not. Using a score to decide which children get extra reading help is a low-cost decision that is easily reversed if wrong. Using the same score to decide which children enter an academic track at eleven is a high-cost decision that is difficult to reverse and that compounds over years.
The historical case against selection by test at a fixed age was built on exactly this asymmetry rather than on the tests being meaningless, and how testing has been used in education and employment traces where that argument went.
The defensible summary
Cognitive ability is a real and useful predictor of school achievement, the best single one available, and a poor basis for deciding what any individual child will do. Those statements are consistent, and holding all three at once is the whole skill.
If you want a score read the way this article argues it should be — with its scale, its percentile and its confidence range stated rather than a bare number — that is what our IQ test reports, and the version for children is normed against age-matched peers rather than adults.
Keep reading
 Research & Evidence
Cultural Bias in IQ Tests
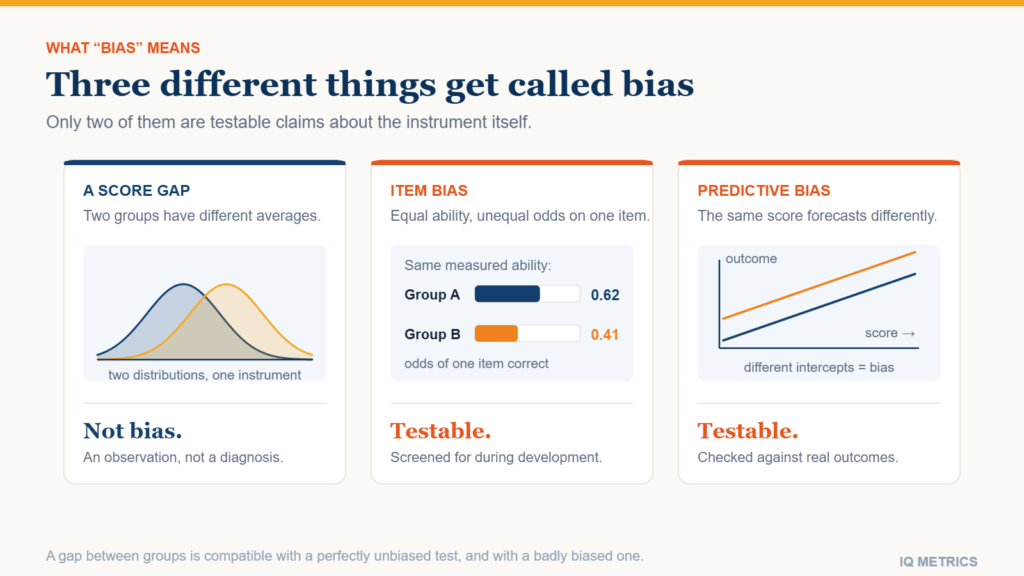
Ask whether IQ tests are culturally biased and you get two confident, opposite answers. Both are partly right, because the word means something far narrower to a psychometrician than it does in ordinary use. Here is what the item-level evidence shows, and where culture really does get into a score.
 Research & Evidence
Is IQ Genetic?
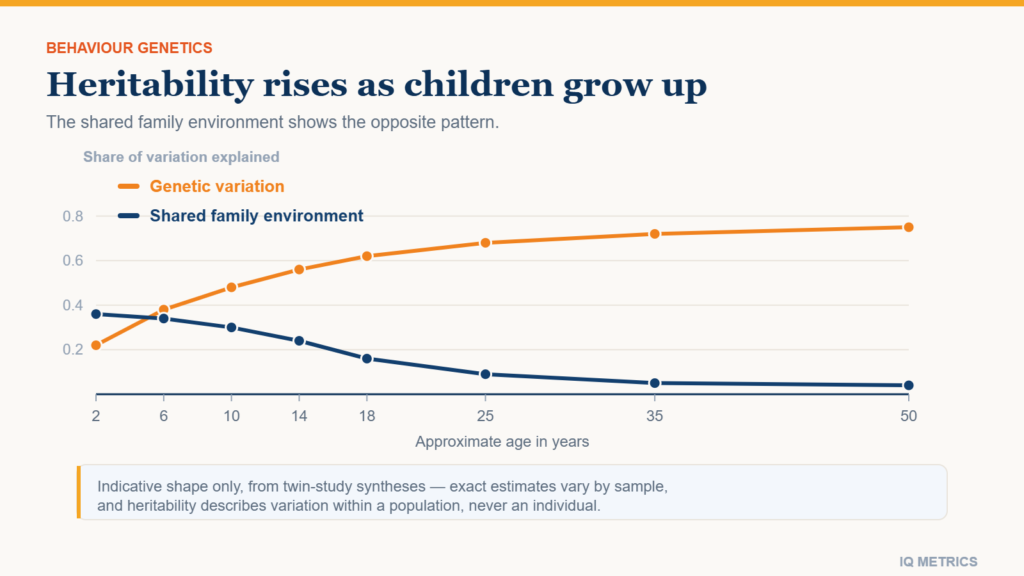
Heritability estimates for IQ rise from roughly 0.4 in childhood to 0.7 or higher in adulthood, which sounds decisive until you know what heritability measures. Here is what twin and adoption studies actually show, and the four conclusions people draw from them that the statistic does not support.
 Research & Evidence
The Importance of IQ Tests in Education and Employment
Academic achievement and professional success are of the utmost importance in today’s competitive employment market. Important to this strategy is the IQ test