





What Does an IQ of 100 Mean? Is It Average, Good or Low?
An IQ of 100 is the exact average: the 50th percentile on the standard scale, with half of people scoring below and half above. Major test charts label it Average. See why 100 is the average, whether it is good, how many people score it and what it predicts.

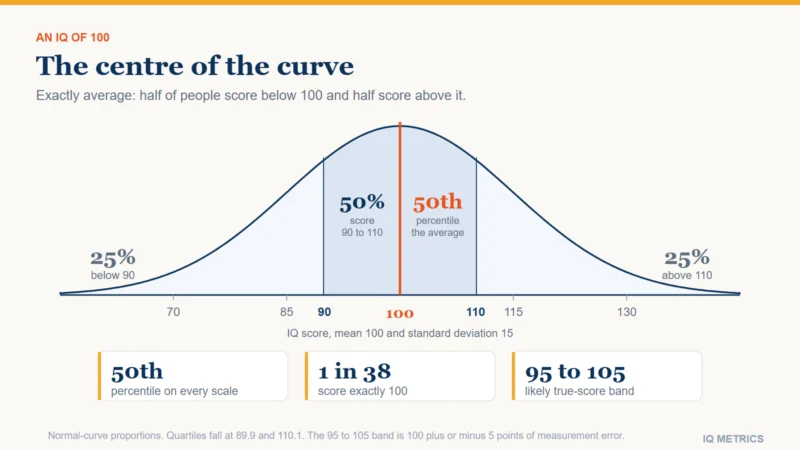
An IQ of 100 is the average: on the standard scale (mean 100, standard deviation 15) it is the 50th percentile, so half of all people score below it and half score above it. It is neither low nor high. The Wechsler children’s test (WISC-V), the Stanford-Binet 5 and the Woodcock-Johnson all label 100 Average, and about half of all people score between 90 and 110. It is the one score that sits at the 50th percentile on every scale, and about 1 person in 38 scores exactly 100. This guide shows where 100 sits on the bell curve, why 100 is the average at all, how the label differs by chart, whether 100 is good, and what it does and does not predict.
- Percentile: 50th on a standard deviation 15, 16 or 24 scale alike (our normal-curve arithmetic).
- Rarity: the opposite of rare. About 1 person in 38 scores exactly 100, and half of all people score between 90 and 110.
- Label: Average on the WISC-V and Stanford-Binet 5 (90 to 109) and on the Woodcock-Johnson (90 to 110); the first score of “high average” on our simplified chart (100 to 115).
- Accuracy: read a reported 100 as roughly 95 to 105.
- Retest: 100 is the one score that does not regress: the expected next score is 100.
- Prediction: a meta-analysis found IQ correlates .56 with education, .43 with occupation and .20 with income (Strenze, 2007): tendencies in groups, not limits on a person.
The figure marks the middle half of the curve: 25% of people score below 90, 49.5% score between 90 and 110, with 100 at the centre, and 25% score above 110. Our guides to an IQ of 90, an IQ of 97, an IQ of 110 and an IQ of 115 cover the scores around it.
What percentile is an IQ of 100?
By construction, the 50th. A 100 is the median and the mean of the norm sample (z = 0), which is why it sits at the middle of the bell curve. The table places the scores around it on the same curve, and our IQ percentile calculator does the same for any score. For the whole curve, see the IQ bell curve.
| IQ score | Scoring at or below | Scoring higher |
|---|---|---|
| 85 | 15.9% | 84.1% |
| 90 | 25.2% | 74.8% |
| 95 | 36.9% | 63.1% |
| 100 | 50.0% | 50.0% |
| 105 | 63.1% | 36.9% |
| 110 | 74.8% | 25.2% |
| 115 | 84.1% | 15.9% |
The printed number depends on the scale, but 100 is the exception. Most modern tests use a standard deviation of 15, older Stanford-Binet editions used 16 and the Cattell scales use 24. Because the average is fixed at 100 on all of them, a printed 100 is the 50th percentile on each, while a 110 is not: it falls at the 75th percentile on one scale and the 66th on another. Our explainer on standard deviation 15 versus 16 walks through the arithmetic, and the IQ score converter moves a score between scales. A percentile is a position within a norm sample of people, which is also why animals have no IQ score; our guide to pig IQ shows what researchers measure instead.
| Scale | Percentile of a printed 100 | Percentile of a printed 110 |
|---|---|---|
| Standard deviation 15 (Wechsler, current Stanford-Binet) | 50.0% | 74.8% |
| Standard deviation 16 (older Stanford-Binet, some school tests) | 50.0% | 73.4% |
| Standard deviation 24 (Cattell) | 50.0% | 66.2% |
Why is 100 the average IQ?
Because test makers set it there. An IQ scale is built, not discovered. On the old ratio formula, William Stern proposed the “mental quotient” in 1912 (mental age divided by chronological age) and Lewis Terman multiplied it by 100 for the 1916 Stanford-Binet, so a child performing exactly at their age scored 100. Wechsler’s 1939 Wechsler-Bellevue scale replaced the ratio with the deviation IQ: a score compared only with people of the same age, with the mean fixed at 100 and the spread at 15. Modern tests do the same with norm samples of thousands of people. Our guides to deviation IQ versus ratio IQ and IQ and mental age tell the story in full.
A 100 is therefore the average of the norm sample at the time the test was normed, and that matters because raw performance has drifted upward. A meta-analysis of 271 samples from 1909 to 2013 estimated gains of 0.28 full-scale IQ points a year, roughly 3 points a decade, and found that the gains have decreased in more recent decades (Pietschnig and Voracek, 2015). As an illustration only, twenty years at 0.28 a year is 5.6 points, which would turn a 100 on stale norms into roughly a 94 on fresh ones. That is why publishers re-norm their tests; see why IQ norms expire.
Is an IQ of 100 good, average or low?
It is average on every major chart. The table shows where 100 falls on the charts we cover and what sits on either side.
| Chart | Band that contains 100 | Band above it | Band below it |
|---|---|---|---|
| WISC-V (Wechsler, children) | 90 to 109: Average | 110 to 119: High Average | 80 to 89: Low Average |
| Stanford-Binet 5 | 90 to 109: Average | 110 to 119: High average | 80 to 89: Low average |
| Woodcock-Johnson | 90 to 110: Average | 111 to 120: High Average | 80 to 89: Low Average |
| Our simplified IQ ranges guide | 85 to 115: average range, with 100 to 115 called high average | 115 to 130: above average | 70 to 85: borderline to low average |
Whether it is “good” depends on what the score is for. It is as good as the typical person’s: enough for ordinary school, work and daily life, where most people do well with scores near it. It falls short of a selective cut-off such as the top 2% that societies like Mensa use (see Mensa IQ score requirements), and it says nothing about creativity, persistence or character. The detailed band tables are in our guides to WISC-V scores, the Stanford-Binet and the Woodcock-Johnson, and the simplified ranges are in IQ ranges and IQ classifications.
How many people have an IQ of exactly 100?
About 1 in 38 (2.7%) if you round to whole numbers, which makes 100 the most common single score but still a small slice of the whole curve. The first table shows how many people fall within a given distance of 100, and the second shows how fast the share at any one exact score drops as you move away from the centre.
| Range | Share of people | Share outside it |
|---|---|---|
| Within 5 points (95 to 105) | 26.1% | 1 in 1.4 |
| Within 10 points (90 to 110) | 49.5% | 1 in 2.0 |
| Within 15 points (85 to 115) | 68.3% | 1 in 3.2 |
| Within 30 points (70 to 130) | 95.4% | 1 in 22 |
| Exact score | Share of people | Rarity |
|---|---|---|
| 100 | 2.66% | 1 in 38 |
| 95 or 105 | 2.52% | 1 in 40 |
| 90 or 110 | 2.13% | 1 in 47 |
| 85 or 115 | 1.61% | 1 in 62 |
| 70 or 130 | 0.36% | 1 in 278 |
So a 100 is typical in two senses: it is the centre of the curve, and it is shared by the most people. A class of 30 pupils has, on average, one pupil whose score is exactly 100.
Is an IQ of 100 the average of the world?
Not as a measurement. A test’s 100 is the average of the norm sample it was built on, usually a census-matched sample from one country or region at one time. It is not a count of everyone on Earth. National averages quoted in rankings come from other sources of varying quality and disagree with one another, so they are not read from a single test with a single 100. Our pages on average IQ by country, the 2026 online ranking and average IQ by US state explain what each figure rests on.
Where would your own score land?
Take the IIF-certified assessment and get your score with the scale it was measured on, the percentile it corresponds to and the confidence range around it — the three figures most online tests leave out.
Find your IQ score now! →Is an IQ of 100 average for a 13-year-old?
Yes, and for a 40-year-old too. IQ is compared with people of the same age, so a 13-year-old who scores 100 performed like the average 13-year-old, and a 40-year-old who scores 100 performed like the average 40-year-old. Raw ability grows through childhood and falls later in life, but the score stays anchored at 100 for each age group. For how raw performance changes with age, see IQ and age, the IQ scale by age and at what age intelligence peaks.
What happens when a score of 100 is retested?
On average, nothing. Scores regress toward the average when they are repeated: the expected second score is 100 plus the correlation between the tests times the distance of the first score from 100. For a first score of 100 that distance is zero, so the expected second score is 100 whatever the correlation. An individual’s score still moves: the standard error of measurement is commonly 2 to 3 points on a full-scale adult battery, so a reported 100 is best read as 95 to 105, and adult rank order is stable at about .76 across five years rather than perfect (Breit and colleagues, 2024). The systematic change when the same test is taken again is practice: retesting raises cognitive test scores by about .26 standard deviations, roughly 4 points, and more with coaching (Hausknecht and colleagues, 2007). Our pages on regression to the mean and IQ score margin of error explain both effects.
What does an IQ of 100 predict?
Test scores predict later outcomes in groups, but loosely. A meta-analysis of longitudinal studies found correlations of .56 with educational attainment, .43 with occupational level and .20 with income (Strenze, 2007). Squared, those figures say how much of the spread in an outcome goes with the score: about 31% for education, 18% for occupation and 4% for income. A 100 is the centre of every one of those distributions, so it shifts the odds towards the middle and sets no ceiling and no floor for an individual.
For the detail behind those numbers, see does IQ predict school success, does IQ predict income, average IQ by education level and average IQ by occupation. For how a college entrance score maps onto this scale, see SAT score to IQ, and for the average itself see what the average IQ test score is.
What does "100 IQ" mean in memes and games?
Something different from the score. In gaming and meme slang, “100 IQ play” is often used to praise a clever move, which is a joke on the number: the literal score for an average player is 100. The bell-curve meme that puts 100 in the middle plays on the same idea; our piece on the midwit meme explains what it gets right and wrong. Neither usage tells you anything about a real test result.
Quick answers about an IQ of 100
- Is an IQ of 100 good? It is average: the 50th percentile, and the label on every major chart.
- Is 100 IQ above average? No. It is exactly the average, with half of people below and half above.
- Is 100 IQ low or dumb? No. “Dumb” is not a term any test manual uses, and 100 is the centre of the curve.
- What percentile is an IQ of 100? The 50th on a standard deviation 15, 16 or 24 scale.
- How rare is an IQ of 100? Not rare at all: about 1 person in 38 scores exactly 100, and half score between 90 and 110.
- Is 100 IQ good for a 13-year-old? It is average for a 13-year-old, because scores are compared with people of the same age.
- How accurate is a score of 100? Read it as roughly 95 to 105.
Sources
- Strenze, T. (2007): Intelligence and socioeconomic success: a meta-analytic review of longitudinal research, Intelligence, 35(5), 401-426.
- Pietschnig, J. and Voracek, M. (2015): One century of global IQ gains: a formal meta-analysis of the Flynn effect (1909-2013), Perspectives on Psychological Science, 10(3), 282-306.
- Breit, M., Scherrer, V., Tucker-Drob, E.M. and Preckel, F. (2024): The stability of cognitive abilities: a meta-analytic review of longitudinal studies, Psychological Bulletin, 150(4), 399-439.
- Hausknecht, J.P., Halpert, J.A., Di Paolo, N.T. and Moriarty Gerrard, M.O. (2007): Retesting in selection: a meta-analysis of coaching and practice effects for tests of cognitive ability, Journal of Applied Psychology, 92(2), 373-385.
- Percentile and rarity figures are computed from the normal distribution. The bands, the scale conversion, the ratio and deviation IQ history and the standard error of measurement are those described in our own guides to deviation IQ and ratio IQ, the Stanford-Binet, the Woodcock-Johnson, WISC-V scores and IQ score margin of error.
Keep reading
All articles →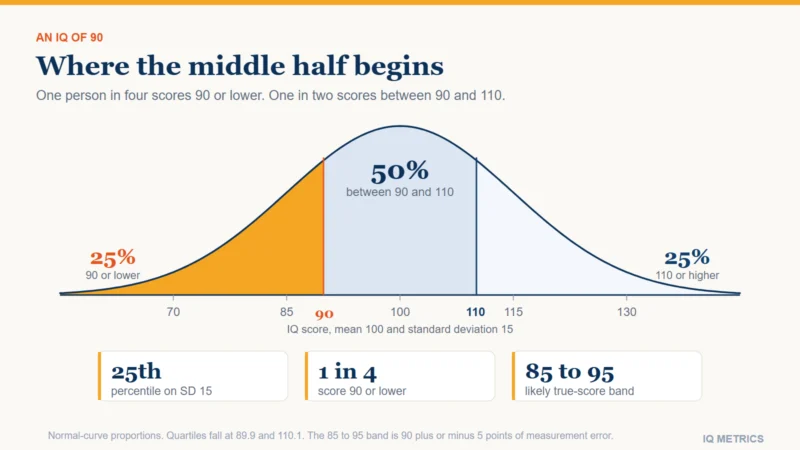 Scores & Scales
What Does an IQ of 90 Mean?
An IQ of 90 is the 25th percentile on the standard scale: about 1 person in 4 scores 90 or lower. Major test charts call it the bottom of the Average band, while simpler charts call it low average. See what 90 means, how accurate it is and what it predicts.
 Scores & Scales
What Does an IQ of 115 Mean?
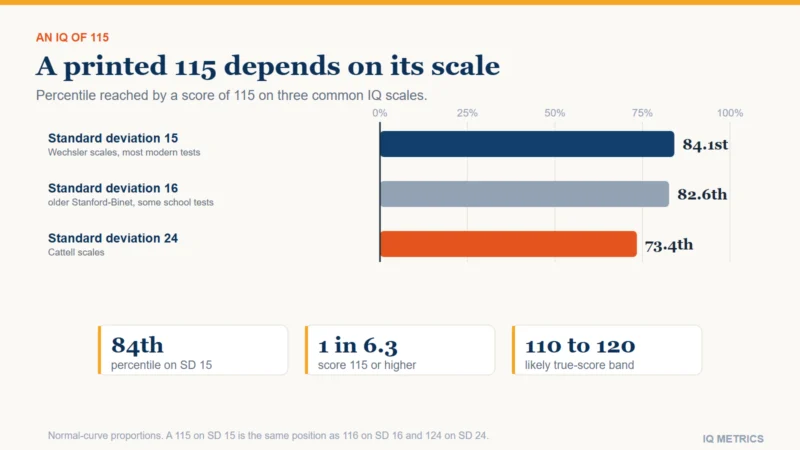
An IQ of 115 is one standard deviation above average: the 84th percentile, roughly 1 person in 6. It is High Average on the Wechsler children's scale and means the same at any age. See how accurate a single 115 is, why labels differ, and what a printed 115 means on other scales.
 Scores & Scales
What is Average IQ Test Score?
The average IQ test score is 100 by definition. About half of people score 90 to 109 and about 68% score 85 to 115. See the average range on each chart, why the average stays at 100, how scales differ and where to find averages for groups.