





Average IQ in Australia: Scores, Rankings and Skills Data
Average IQ in Australia is 100 on an Australian-normed test, so compare skills instead. Australia ranks 5th of 137 online but 10th on PISA 2025 school tests, trails Canada and the UK in maths, leads on research output and shows an 80-point gap by family background. See how Australian IQ norms are built too.

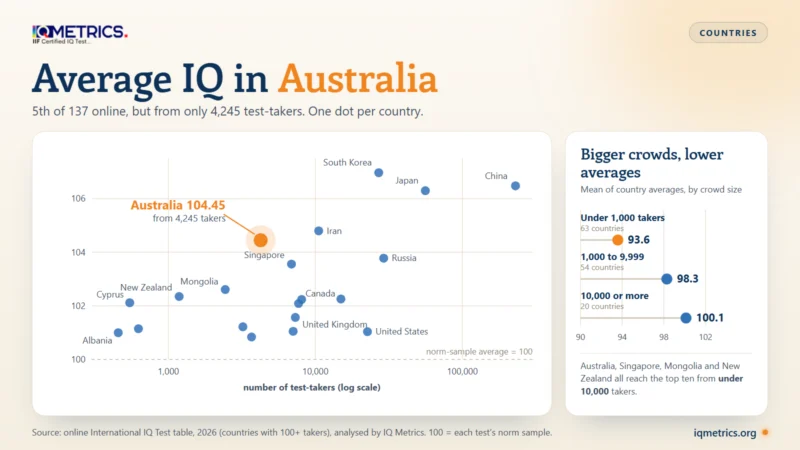
The average IQ in Australia is 100 on any IQ test normed on Australians, so the real question is how Australia compares with other countries on measures that are comparable. On those, Australia sits in the upper tier: about 99.2 in the studies behind our average IQ by country table, 104.5 among online test-takers (fifth of 137, from a small crowd), and 493 on the OECD’s PISA 2025 school tests, 10th of 86 systems on our index and well above the OECD average. This guide sets out each number, the gaps inside Australia, the fall in scores since 2012, and what Australian IQ norms actually are.
What is the average IQ in Australia?
By definition, 100. A test such as the Wechsler Adult Intelligence Scale, fourth edition, Australian and New Zealand adaptation (WAIS-IV A&NZ, published in 2008 for ages 16 to 90) is standardised on a local sample and rescaled so that the typical person scores 100 with a spread of 15. That is also why Canada and the UK and the US all average 100 on their own tests. A national “average IQ” only becomes a comparison when the same instrument is used in several countries, and the table shows where Australia lands on each such measure.
| Measure | Australia | Note |
|---|---|---|
| IQ tests, each normed on its own country | 100 | None by construction |
| Pooled IQ and school-test studies (our country table) | 99.2 | 5,962 people in 6 studies |
| Online International IQ Test, 2026 table | 104.5 | 5th of 137, but only 4,245 takers |
| PISA 2025, average of maths, reading, science | 493 | 10th of 86 on our combined index |
| Adult skills 2023 | Not in the table | Australia is not among the 31 entries we use |
Why is Australia 5th online but 10th on school tests?
The 104.45 comes from the online International IQ Test table that our report on the 2026 country ranking analysed, where Australia ranks fifth of 137 countries behind South Korea, China, Japan and Iran, ahead of Russia, Singapore, Mongolia and New Zealand. It rests on 4,245 test-takers, a modest crowd. Across the table, countries with fewer than 1,000 takers average 93.6, those with 1,000 to 9,999 average 98.3, and those with 10,000 or more average 100.1, and four of the top ten (Australia, Singapore, Mongolia and New Zealand) have fewer than 10,000 takers. The pattern fits a selection effect: who chooses to take an online test, and how they found it, varies by country, so a small crowd can drift well above or below the national picture.
Sampling error is not the issue here. With 4,245 takers and a spread near 15, the mean is pinned to about ±0.2 of a point by chance alone; the uncertainty is about who took the test. The school-test comparison, by contrast, samples more than 14,600 sampled 15-year-olds from 766 schools, which is why it is the sturdier of the two comparisons when they disagree.
Australia vs Canada, the UK, New Zealand and the US on PISA 2025
PISA 2025 is the most recent like-for-like comparison of English-speaking school systems. Australia averages 493 across maths, reading and science, a little behind Canada (495), the UK (498) and New Zealand (495) and ahead of the US (485). The differences between Australia and its closest peers are small, a few points, and several sit inside the margin of error. The one clear weakness is maths, where Australia (478) trails Canada (485) and the UK (488).
| Country | Maths | Reading | Science | Average | Low in all three (%) |
|---|---|---|---|---|---|
| Canada | 485 | 490 | 510 | 495 | 12.0 |
| United Kingdom | 488 | 494 | 511 | 498 | 12.0 |
| New Zealand | 480 | 497 | 509 | 495 | 13.8 |
| Australia | 478 | 491 | 509 | 493 | 14.0 |
| United States | 463 | 490 | 502 | 485 | 17.5 |
Against the OECD as a whole, Australia is comfortably ahead in all three subjects. Its share of students scoring low in all three, 14.0%, is higher than Canada’s or the UK’s (about 12%) and well below the US figure of 17.5%. The Australian Council for Educational Research (ACER) ranked Australia 10th in science and in reading and 16th in maths among the countries that took part in both 2022 and 2025; our index covers all 86 systems, including some that were not in the 2022 round, so its places differ.
| Subject | Australia | OECD average | Difference |
|---|---|---|---|
| Maths | 478 | 463 | +15 |
| Reading | 491 | 461 | +30 |
| Science | 509 | 482 | +27 |
| Learning in the Digital World (new in 2025) | 532 | 500 | +32 |
Does Australia punch above its weight in research?
One part of our smartest-countries index has nothing to do with school tests: it counts articles in the core scientific journals from 2021 to 2025 for every million residents (OpenAlex data). On that measure Australia, with a population under 27 million, ranks 9th of 86 and is well ahead of the other English-speaking countries here, which lifts its 12th place on school skills to 10th overall. Research output is not intelligence either, but it is a harder-to-game national indicator than an online quiz average.
| Country | Articles per million per year | Rank among 86 |
|---|---|---|
| Australia | 3,708 | 9th |
| United Kingdom | 2,823 | 16th |
| New Zealand | 2,703 | 19th |
| Canada | 2,662 | 20th |
| United States | 1,825 | 29th |
Gaps inside Australia
The national average hides large differences. ACER’s report on the 2025 results measures four of them, in PISA points, where a gap of about 20 points is a rough rule of thumb for a year of schooling:
| Comparison | Science | Reading | Maths |
|---|---|---|---|
| Highest vs lowest socio-economic quarter | 80 | 74 | 83 |
| First Nations students vs other students (lower by) | 72 | 76 | 74 |
| Major cities vs regional schools (higher by) | 24 | 27 | 30 |
| Independent vs government schools (higher by, before adjusting for background) | about 50 | about 50 | about 50 |
The socio-economic gap is the biggest and most consistent: students from the top quarter of family background outscore those from the bottom quarter by roughly four school years in maths on that rule of thumb. The gap between independent and government schools shrinks substantially once students’ backgrounds are taken into account, according to ACER, so it mostly reflects who attends rather than what each sector adds. First Nations students’ science scores rose 16 points between 2022 and 2025, the one bright spot in that comparison. None of these are differences in ability; they are differences in opportunity and measured outcomes.
Where would your own score land?
Take the IIF-certified assessment and get your score with the scale it was measured on, the percentile it corresponds to and the confidence range around it — the three figures most online tests leave out.
Find your IQ score now! →Australian scores have been falling since 2012
Like most countries, Australia has slipped. The OECD’s own comparison with 2012 shows a clear fall in maths of about 27 points and a clear fall in reading of about 21, with science down 12 but within the margin of error. Our combined school score is also down about 5 points since 2022. Falling test scores do not mean Australians have become less intelligent; they reflect changes in curriculum, attendance, reading habits and screen use that tests of school learning pick up and IQ tests largely do not. For why norms drift, see why IQ norms expire.
| Subject | Change (points) | Standard error | Verdict |
|---|---|---|---|
| Maths | -27 | 4.5 | Clear fall (z = -5.9) |
| Reading | -21 | 6.6 | Clear fall (z = -3.2) |
| Science | -12 | 6.6 | Within error (z = -1.9) |
How are IQ tests normed in Australia?
Australia shares its test norms with New Zealand. Pearson’s documentation lists a WAIS-IV A&NZ adaptation from 2008, and for children the WISC-V A&NZ was standardised on 528 children aged 6 to 16, stratified to match the 2011 Australian and 2013 New Zealand censuses, with about 5% of the Australian sample identifying as Aboriginal or Torres Strait Islander and 23% of the New Zealand sample as Māori (figures from Pearson’s own training slides, which we have not seen in the technical manual). Because the reference sample mixes both countries, a typical Australian and a typical New Zealander are both defined as 100 against the same tables.
Norms also age. A table built from a 2011 census sample reflects 2011 children, so test publishers renorm every decade or so, and a WAIS-5 A&NZ is now on sale. Our guide to the WAIS-IV and WAIS-5 index scores explains what changed.
How many Australians have a very high IQ?
On a bell curve with an average of 100 and a spread of 15, applied to Australia’s population of about 26.7 million (World Bank, 2023), the upper tail looks like this. These are theoretical counts, not a census of test scores.
| IQ score | Rarity | People in Australia |
|---|---|---|
| 130 (Mensa line) | 1 in 44 | 610,000 |
| 145 | 1 in 741 | 36,000 |
| 155 | 1 in 8,140 | 3,300 |
| 160 | 1 in 31,600 | 840 |
The 130 row is the usual line for Mensa; the rarer rows are explained in our guides to an IQ of 155 and an IQ of 160.
Is Australia smarter than the UK or New Zealand?
The honest answer is that the data cannot say. On PISA 2025, Australia is a few points behind the UK and Canada and level with New Zealand; on the online table, Australia is ahead of all three; on pooled studies Australia, Canada, the UK and New Zealand are within one point of each other. Gaps this small, from instruments this different, are noise. Our report on what country IQ rankings cannot support explains why a league table of national IQ is not something the evidence backs, and the smartest countries index shows the school and research data for 86 systems.
To see where you stand yourself, take the IQ Metrics IQ test and read the result against the IQ classification bands.
Sources
- Australian Council for Educational Research (8 September 2026): Australian students continue to shine in the world’s largest learning assessment (means, rankings, gaps).
- OECD (2026): PISA 2025 results, Volume I, Table I.B1.2a, as processed in our Smartest Countries Index (changes since 2012, low and top performers, rank among 86 systems).
- Pearson Clinical Australia: WAIS-IV A&NZ product information; WISC-V A&NZ standardisation (webinar slides).
- IQ Metrics: Average IQ by country (201 entries) and the 2026 online ranking of 137 countries. Population: World Bank (2023).
Keep reading
All articles →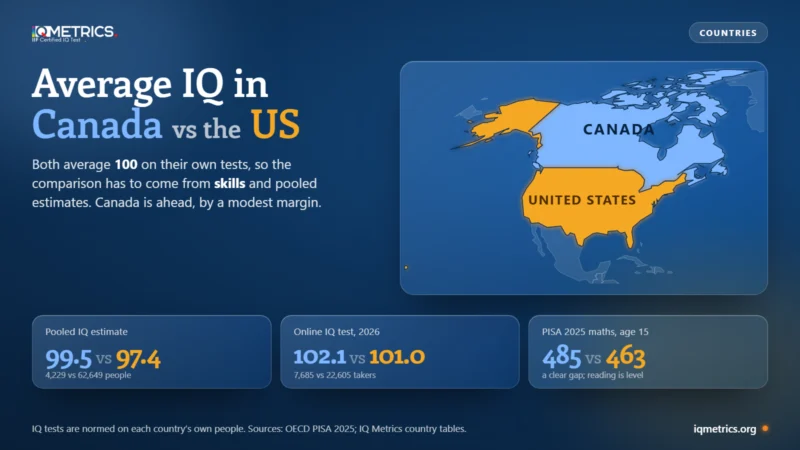 Scores & Scales
Average IQ in Canada (vs the US)
Average IQ in Canada vs the US: both are 100 on their own tests, so compare skills instead. Canada is ahead on PISA 2025 maths by 22 points and on adult skills by 16. See the provinces, why Canadian and US WAIS-IV norms give different scores, and how far Canada has fallen since 2012.
 Scores & Scales
Average IQ in the UK vs the US
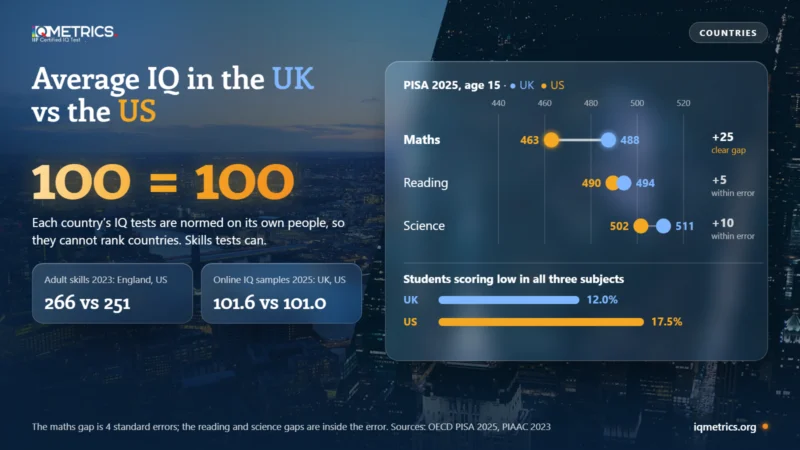
The average IQ in the UK vs the US is 100 in both, because each country's tests are normed on its own people. See what can be compared: PISA 2025 maths (UK 488, US 463), adult skills (266 vs 251), online samples, the Flynn effect in each country and where the real gaps sit.
 Understanding IQ
PISA Test vs IQ Test
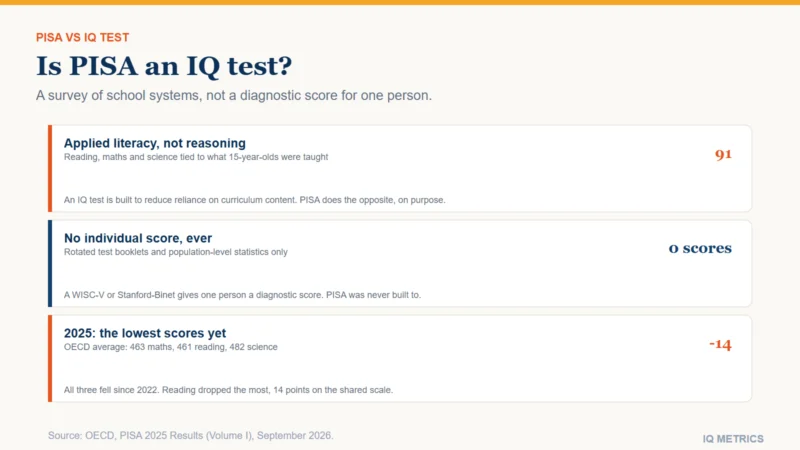
Is PISA an IQ test? No. PISA surveys applied school literacy across whole education systems and returns no individual score, while an IQ test diagnoses one person. See the new PISA 2025 results, published September 2026, and the real debate over using PISA as a national IQ proxy.