





Average IQ in Canada vs the US: What the Data Shows
Average IQ in Canada vs the US: both are 100 on their own tests, so compare skills instead. Canada is ahead on PISA 2025 maths by 22 points and on adult skills by 16. See the provinces, why Canadian and US WAIS-IV norms give different scores, and how far Canada has fallen since 2012.

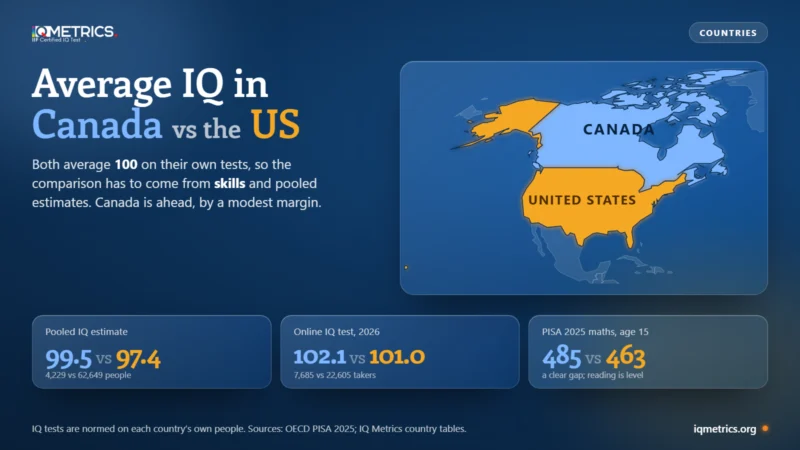
The average IQ in Canada is 100 on any IQ test normed on Canadians, and the average IQ in the US is 100 on a test normed on Americans, so an IQ test cannot say which country scores higher. What can be compared are pooled estimates and skills tests, and they put Canada slightly ahead: about 99.5 against 97.4 in the studies behind our average IQ by country table, 102.1 against 101.0 among online test-takers, and 495 against 485 on the OECD’s PISA 2025 school tests. This guide lays out each source, how big the Canada–US gap really is, what the provinces show, and why the same Canadian can score differently depending on which norm table is used.
What is the average IQ in Canada?
By construction, 100. Every major IQ test is standardised on a representative sample of one country’s people and then rescaled so that the middle of that sample scores 100 with a spread (standard deviation) of 15. A Canadian-normed test therefore returns 100 for the typical Canadian, and a US-normed test returns 100 for the typical American. The same rule is why the UK and the US both average 100 and why the figure is not a fact about a country’s brains. For a score of 100 in plain terms, see what an IQ of 100 means.
To say anything about Canada relative to another country you need something measured the same way in both. There are three kinds of evidence, and the table puts Canada and the US side by side on each.
| Measure | Canada | United States | What it tells you |
|---|---|---|---|
| IQ tests, each normed on its own country | 100 | 100 | None by construction |
| Pooled IQ and school-test studies (our country table) | 99.5 | 97.4 | 2 points; sizes 4,229 vs 62,649 people |
| Online International IQ Test, 2026 table | 102.1 | 101.0 | 1 point; 7,685 vs 22,605 takers |
| PISA 2025, average of maths, reading, science | 495 | 485 | 10 points; driven by maths |
| Adult skills 2023, average of three | 267 | 251 | 16 points; 9th vs 21st of 31 |
Read the table from top to bottom and the pattern is steady but modest: Canada is ahead on every comparable measure, by a point or two on the IQ-style estimates and by more on the skills tests. None of the gaps tells you about the genes or the potential of either population; they describe schooling, adult learning and who happened to take a test.
Why do estimates of Canada's IQ differ?
Because they measure different groups with different instruments. The 99.5 comes from a pool of 4,229 people in ten studies, a modest base; the US figure (97.4) pools 62,649 people in 58 studies, the largest sample in that dataset. The 102.1 comes from 7,685 Canadians who chose to take an online test in 2026, in a table where Canada ranks 13th of 137 countries and the US 18th at 101.0 from 22,605 takers (our report on that table).
The sampling error in the online figure is tiny: if the scores spread about 15 points, 7,685 takers pin the mean down to roughly ±0.2 of a point. The problem is not chance but selection. People who search for an IQ test are not a random slice of the country, and the share who do so differs from place to place. In the same table, countries with fewer than 1,000 takers average 93.6 and countries with 10,000 or more average 100.1, which is a sign that crowd size and who shows up matter as much as national ability. A one- or two-point gap between Canada and the US, in any of these sources, is inside that noise.
Canada vs the US on PISA 2025
PISA tests 15-year-olds in maths, reading and science every three years, and the 2025 results are the freshest comparison of the two school systems. Canada averages 495 across the three subjects and the US 485, but the gap is not spread evenly. It is large in maths, where the difference of 22 points is about 3.9 standard errors, and it disappears in reading, where the two countries are separated by a third of a point. Science favours Canada by 8 points, which is within the margin of error.
| Measure | Canada | US | Gap | Reading of the gap |
|---|---|---|---|---|
| Maths | 485 | 463 | 22 | Clear (z = 3.9) |
| Reading | 490 | 490 | 0 | No gap (z = 0.1) |
| Science | 510 | 502 | 8 | Within error (z = 1.4) |
| Top performers in at least one subject (%) | 17.4 | 17.8 | -0.4 | Level |
| Low performers in all three subjects (%) | 12.0 | 17.5 | 5.5 | Canada lower |
| Rank among 86 school systems (school-skills score) | 10th | 15th | 5 places |
A caution that applies to both countries: the OECD flags Canada and the United States (along with Albania, the Netherlands, New Zealand and Norway) for sampling caution in 2025, a flag that the sample did not fully meet the OECD’s technical standards, so the averages carry extra uncertainty. The US is also the less precise of the two, with standard errors three times Canada’s (5.4 against 1.9 in maths), which is part of why a 10-point gap can be clear in one subject and not in another. For what these tests do and do not share with IQ, see PISA vs an IQ test and our PISA 2025 results report.
Adult skills: Canada 9th, the US 21st of 31
The OECD’s Survey of Adult Skills (PIAAC 2023) tests adults aged 16 to 65 in literacy, numeracy and adaptive problem solving. Canada averages 267 across the three, ninth among the 31 countries and regions in our table, against 251 for the US in 21st. The largest gap is in numeracy, 22 points. Adults are closer to a general-population picture than a school sample, and this is the comparison where Canada’s lead is clearest.
| Skill | Canada | US | Gap |
|---|---|---|---|
| Literacy | 271 | 258 | 13 |
| Numeracy | 271 | 249 | 22 |
| Adaptive problem solving | 259 | 247 | 12 |
| Average of the three | 267 | 251 | 15 |
Canada's scores have fallen faster than America's since 2012
Both countries have slipped in maths since PISA 2012, and the OECD’s own comparison shows Canada dropping further. The picture differs by subject: Canada fell clearly in all three, while the US change is within error in reading and science. In reading the extra Canadian fall (about 25 points) is itself large enough to be unlikely to be chance; in maths the two falls are not statistically different from each other.
| Subject | Canada | Canada, tested against its error | US | US, tested against its error |
|---|---|---|---|---|
| Maths | -33 | Clear fall | -19 | Clear fall |
| Reading | -33 | Clear fall | -8 | Within error |
| Science | -15 | Clear fall | +4 | Within error |
Falling scores and a high rank can coexist: Canada is still 10th of 86 school systems on the combined score. For the wider decline and why it does not mean people have become less intelligent, see why IQ norms expire.
Where would your own score land?
Take the IIF-certified assessment and get your score with the scale it was measured on, the percentile it corresponds to and the confidence range around it — the three figures most online tests leave out.
Find your IQ score now! →Which Canadian provinces score highest?
Canada’s provinces run their own school systems, so PISA reports them separately. The Council of Ministers of Education, Canada, said Alberta, Ontario, British Columbia and Quebec performed at the top of the provinces in science. Alberta’s government reported scores of 520 in science, 499 in reading and 489 in maths for the province, first among provinces in science and reading and second in maths behind Quebec. Commentary in Policy Options notes the gap between the top province in science and the lowest, New Brunswick, is more than two grade levels, while a second piece there warns that many ranking differences between neighbouring provinces fall within measurement error. We have not seen the full provincial table, so treat single rankings as indicative.
There is no credible province-by-province “IQ”: no IQ test has been normed to compare the provinces, and the school results above reflect funding, language of instruction, immigration patterns and curriculum as well as anything about students.
Do Canadian and US IQ norms give different scores?
Yes, and this is the most Canada-specific fact in the IQ literature. Psychologists in Canada can score the WAIS-IV with either the US norm tables or a separate Canadian set. In a sample of 432 Canadian college and university students who had been referred for assessment, Harrison and colleagues found that the Canadian norms produced systematically lower IQ, index and subtest scores than the American norms, with agreement between the two systems (scores within five points, or in the same classification range) of only 49% to 76%, depending on the index. Because the sample was a clinical referral group it cannot say what the general population would get, but it shows the mechanism: an “average” score is relative to whichever reference group sits behind the table.
The practical lesson is the same one the Flynn effect teaches: before comparing two scores, check which norm table and which year they were converted with. A result of 100 means “typical of the norm sample”, not “typical of the country”.
How many Canadians have a very high IQ?
Assuming a bell curve with an average of 100 and a spread of 15, and a population of about 40 million (World Bank, 2023), the upper tail works out as follows. The numbers are theoretical counts for a normal curve, not a census of test scores.
| IQ score | Rarity | People in Canada |
|---|---|---|
| 130 (Mensa line) | 1 in 44 | 910,000 |
| 145 | 1 in 741 | 54,000 |
| 155 | 1 in 8,140 | 4,900 |
| 160 | 1 in 31,600 | 1,300 |
The 130 line is the usual entry point for Mensa, and the rarer rows are covered in our guides to an IQ of 155 and an IQ of 160.
So is Canada smarter than the US?
Not in any way an IQ test can establish. On the evidence above, Canadian 15-year-olds do better in maths and Canadian adults do better in numeracy and literacy, by margins that are real but modest, while reading and science for teenagers are about level. The online and pooled IQ estimates lean the same direction by one or two points, which is within the noise of how they were collected. Anyone claiming a national IQ difference from numbers like these is stretching them; our report on what country IQ rankings cannot support sets out why, and the smartest countries index shows the school and research data for all 86 systems.
If you are curious where you stand rather than your country, take the IQ Metrics IQ test and read the result against the IQ classification bands. For another English-speaking comparison, see the average IQ in Australia.
Sources
- OECD (2026): PISA 2025 results, Volume I, Table I.B1.2a (maths, reading and science means; changes since 2012), as processed in our Smartest Countries Index.
- OECD (2024): Survey of Adult Skills 2023 (PIAAC), Annex A tables.
- Council of Ministers of Education, Canada (September 2026): OECD report ranks Canadian students among top performers globally in science; provincial scores for Alberta as reported by the Government of Alberta; Policy Options (September 2026) on provincial gaps.
- Harrison, A.G., Armstrong, I.T., Harrison, L.E., Lange, R.T. and Iverson, G.L. (2014): Comparing Canadian and American normative scores on the Wechsler Adult Intelligence Scale-Fourth Edition, Archives of Clinical Neuropsychology.
- IQ Metrics: Average IQ by country (201 entries) and the 2026 online ranking of 137 countries. Population: World Bank (2023).
Keep reading
All articles →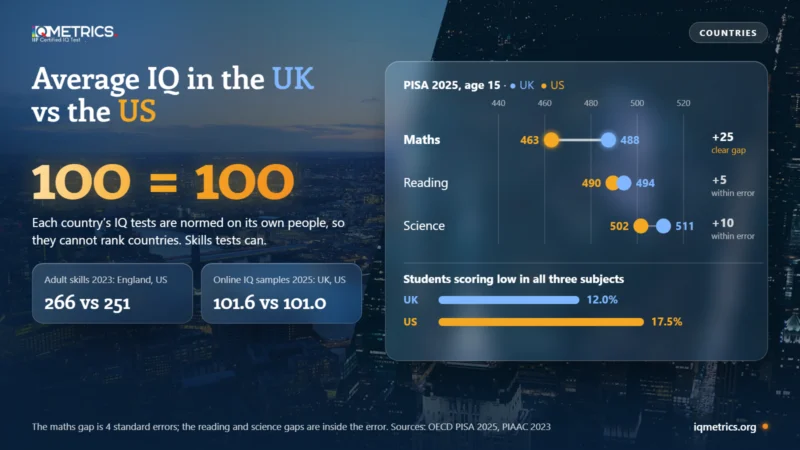 Scores & Scales
Average IQ in the UK vs the US
The average IQ in the UK vs the US is 100 in both, because each country's tests are normed on its own people. See what can be compared: PISA 2025 maths (UK 488, US 463), adult skills (266 vs 251), online samples, the Flynn effect in each country and where the real gaps sit.
 Scores & Scales
Average IQ in Australia
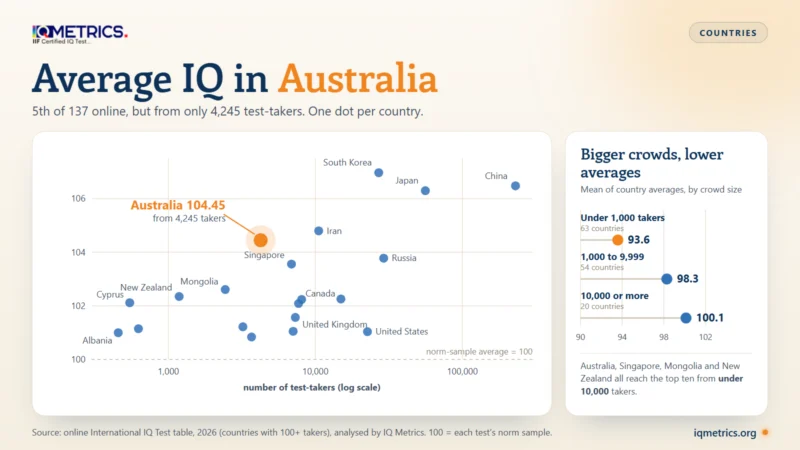
Average IQ in Australia is 100 on an Australian-normed test, so compare skills instead. Australia ranks 5th of 137 online but 10th on PISA 2025 school tests, trails Canada and the UK in maths, leads on research output and shows an 80-point gap by family background. See how Australian IQ norms are built too.
 Understanding IQ
PISA Test vs IQ Test
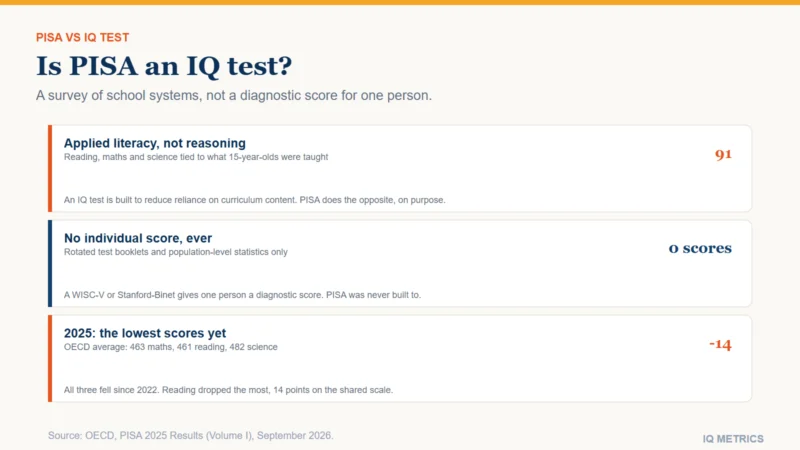
Is PISA an IQ test? No. PISA surveys applied school literacy across whole education systems and returns no individual score, while an IQ test diagnoses one person. See the new PISA 2025 results, published September 2026, and the real debate over using PISA as a national IQ proxy.