





Average IQ in the UK vs the US: What the Data Shows
The average IQ in the UK vs the US is 100 in both, because each country's tests are normed on its own people. See what can be compared: PISA 2025 maths (UK 488, US 463), adult skills (266 vs 251), online samples, the Flynn effect in each country and where the real gaps sit.

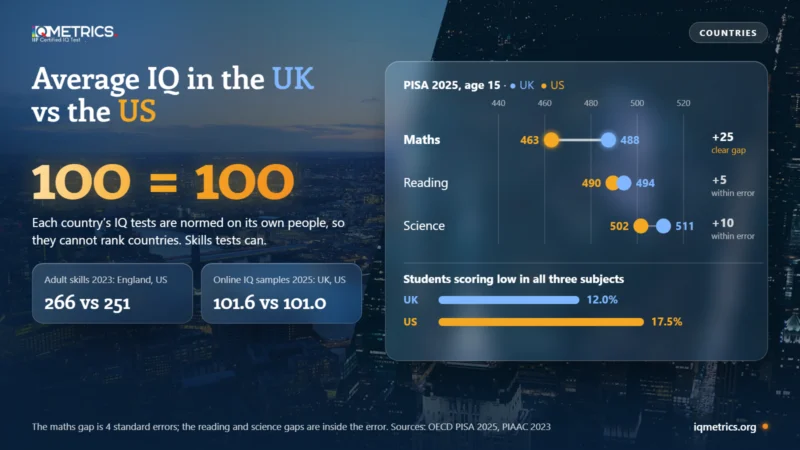
The average IQ is 100 in both the UK and the US, because every IQ test is standardised on its own national sample, so no IQ test can say which country scores higher. What can be compared are other measures, and the average IQ in the UK vs the US looks different on each. On the OECD’s PISA 2025 school tests the UK averages 498 across maths, reading and science against 485 for the US; in the 2023 Survey of Adult Skills England scores 266 against 251 for the US; and an online Raven’s-style test taken by thousands of people in 2025 puts the two countries within half an IQ point of each other, 101.6 and 101.0, which is well inside its own noise. This guide covers why both averages are 100, what each comparison measures, how large the gaps are against their error margins, how the Flynn effect is behaving in each country and where the real differences sit inside each one.
- By construction: 100 in both countries. The Wechsler tests are published in separate UK and US editions, each normed on its own population.
- School skills (PISA 2025): UK 498, US 485. The UK ranks 8th and the US 15th of 86 systems; the maths gap (25 points) is statistically clear, the reading and science gaps are not.
- Adult skills (PIAAC 2023): England 266, US 251, ranked 12th and 21st of 31 entries.
- Online IQ samples (2025): UK 101.6, US 101.0, from self-selected volunteers, so a difference this small carries no meaning.
Which country has the higher average IQ, the UK or the US?
Neither, on IQ tests; the UK is slightly ahead on school and adult skills tests, mainly in maths. The scoreboard puts the measures side by side, with the size of each gap read against its error margin.
| Measure | UK | US | Is the gap meaningful? |
|---|---|---|---|
| IQ tests, each normed on its own country | 100 | 100 | None by construction |
| Online Raven’s-style sample, 2025 test-takers | 101.6 | 101.0 | 0.5 points: within noise |
| PISA 2025 maths, age 15 | 488 | 463 | 25 points: clear gap |
| PISA 2025 reading, age 15 | 494 | 490 | 5 points: within error |
| PISA 2025 science, age 15 | 511 | 502 | 10 points: within error |
| Adult skills 2023, average of three (England for the UK) | 266 | 251 | 15 points: sizeable |
The pattern is consistent but modest. Where a clear gap exists it is in maths, and it is a gap in what 15-year-olds and adults have been taught and practised, not a difference in mental ability. The sections below take each row in turn.
Why the average IQ is 100 in both countries
An IQ score is a position, not a quantity. A publisher gives a test to a representative sample of a population, sets the sample’s average to 100 and its spread (standard deviation) to 15, and reports every later score against that sample. The UK and US editions of the Wechsler scales are standardised separately, so a 100 on the UK edition means “average for the UK norm sample” and a 100 on the US edition means “average for the US norm sample”. See what an IQ of 100 means and what the average IQ test score is.
That has two consequences. First, asking which country has the higher average IQ on a nationally normed test has a built-in answer, a tie. Second, a fair comparison needs one test, one scoring rule and comparable samples in both countries, and almost nothing published meets that standard. Norms also age (see below), so two editions normed in different years can sit a few points apart for that reason alone. The IQ percentile calculator places a score on a norm sample’s curve, and standard deviation 15 versus 16 covers the scale mechanics. A position score also loses meaning far from the average, which is why an IQ of 200 cannot be certified and why scores near 60, as in Prader-Willi syndrome, are read together with adaptive skills.
What do country IQ tables say about the UK and the US?
Lists of average IQ by country exist, and they are where most searches for this question end up. The 2026 edition of one online table, built from people who took a Raven’s-style test in 2025, gives the UK 101.57 (14th, from 7,310 test-takers) and the US 101.04 (18th, from 22,605). Its previous edition had 99.68 and 99.74. The 0.53-point gap between the two is far smaller than the swing between editions of the same table. Our review of that ranking adds two more problems: the country rows, weighted by number of takers, average 98.48 and not 100, and country scores track the logarithm of sample size (r = 0.60), which is what a self-selected sample looks like.
Older national-IQ compilations such as Lynn and Vanhanen’s 2002 book work differently: they average and adjust small studies of mixed quality, and for 104 of the 185 countries in the book no study was available, so values were estimated from neighbours. Neither kind of table measures the same thing in both countries with the same instrument, which is why country IQ rankings are weaker than the charts suggest, and why our average IQ by country page labels the source of every number.
School skills: PISA 2025, UK versus US
PISA tests 15-year-olds in maths, reading and science every three years, and the 2025 round covered 91 school systems. It is a test of what students have learned, not an IQ test (see PISA test vs IQ test and what the 2025 results do not show about IQ). Using the OECD’s published means and standard errors, which the Smartest Countries Index compiles, the UK and the US compare like this.
| Measure | UK | US | Gap | Is the gap clear? |
|---|---|---|---|---|
| Maths | 488 | 463 | 25 | Clear (z = 4.2) |
| Reading | 494 | 490 | 5 | Within error (z = 0.8) |
| Science | 511 | 502 | 10 | Within error (z = 1.6) |
| Average of the three | 498 | 485 | 13 | Ranked 8th vs 15th of 86 |
| Top performers in at least one subject (%) | 18.3 | 17.8 | 0.4 | Level |
| Low performers in all three subjects (%) | 12.0 | 17.5 | 5.5 | UK lower |
The maths gap is large against its error, about four standard errors. The reading gap (under one standard error) and the science gap (about 1.6) are not statistically clear, so the honest reading is that the UK is ahead in maths, and level or slightly ahead elsewhere. The two countries have almost the same share of top performers (18.3% and 17.8%), while the US has more students at the bottom: 17.5% score low in all three subjects, against 12.0% in the UK. The OECD marks the US data with a sampling caution, so US figures are less certain than the UK’s. Over time, the three-subject average has fallen 4.7 points in the UK and 7.5 in the US since 2012, and between the 2022 and 2025 rounds it rose 3.4 points in the UK and fell 4.8 in the US. In our own index, which blends school skills (70%) with research output (30%), the UK ranks 9th and the US 18th of 86.
Adult skills: the 2023 Survey of Adult Skills
The OECD’s Survey of Adult Skills (PIAAC) tests adults aged 16 to 65 in literacy, numeracy and adaptive problem solving. The UK took part through England, which stands for the UK in the table; the US took part as a whole.
| Skill | England (UK) | US | Gap |
|---|---|---|---|
| Literacy | 272 | 258 | 13 |
| Numeracy | 268 | 249 | 20 |
| Adaptive problem solving | 259 | 247 | 11 |
| Average of the three | 266 | 251 | 15 |
England ranks 12th of 31 entries and the US 21st. The gap is widest in numeracy. Adult skills are learned, depend on schooling, language background and the age mix of the population, and correlate with IQ without being IQ. They show the same direction as PISA: a modest UK lead, largest in maths.
The Flynn effect in the UK and the US
Norm samples go stale because raw scores have risen about three IQ points a decade for much of the 20th century (see why IQ norms expire). Flynn’s 2009 analysis found that British children aged 5 to 15 gained about 14 points on Raven’s matrices between 1942 and 2008, with gains slowing in the later decades. For the US, Dworak, Revelle and Condon (2023) analysed 394,378 adults who took an online cognitive battery between 2006 and 2018 and found a decline in composite scores and in matrix reasoning, letter and number series and verbal reasoning, with the steepest drop among people aged 18 to 22 and those with less education. Three-dimensional rotation scores rose. The authors did not test causes, and an online sample is not a representative one.
For comparing the two countries the lesson is practical: a score is only comparable with scores on the same norm date. A US test normed in one year and a UK test normed in another are measuring against two different yardsticks, and either may be a few points off today.
Where would your own score land?
Take the IIF-certified assessment and get your score with the scale it was measured on, the percentile it corresponds to and the confidence range around it — the three figures most online tests leave out.
Find your IQ score now! →The gaps inside each country are larger than the gap between them
Differences between places inside the UK, and between US states, are much larger than the UK-US gap, and they follow schooling and qualifications. Our Smartest Places in the UK 2026 ranks England’s 294 council areas: Richmond upon Thames is first and Fenland last, and in Fenland 19.0% of adults hold degree-level qualifications against 33.9% across England. The Smartest States 2026 ranks all 50 US states on NAEP 2024 test scores and college degrees, with Massachusetts first and West Virginia last. See also the smartest cities in America and average IQ by US state. Within a country, who you compare matters far more than which flag they carry, and socioeconomic status and IQ covers the strongest driver.
Does the average IQ in the UK change with age?
By definition, no. IQ norms are built in age bands, so the average is 100 at every age: a 70-year-old is compared with other 70-year-olds, not with 25-year-olds. What changes with age is raw performance. Speed and fluid reasoning peak in early adulthood and decline later, while vocabulary and knowledge keep rising for decades (see peak brain age and the IQ scale by age). A UK and a US adult of the same age have the same average on their own norms, for the same reason a UK and a US adult do overall.
How to compare two countries fairly
- Use one instrument. A comparison needs the same test, translated and scored the same way, in both samples.
- Ask who was sampled. A random school sample (PISA) is not an online volunteer sample, and the difference can exceed the gap you are trying to measure.
- Read the gap against its error. A 25-point maths gap with standard errors of 2 and 5 is clear; a 5-point reading gap with the same errors is not.
- Match the norm date. Scores from tests normed years apart are not on the same yardstick.
- Separate skills from ability. School and adult skills tests measure learning, which depends on schooling and opportunity (see cultural bias in IQ tests). To see where your own score sits, start with the IQ Metrics IQ test.
Quick answers
- What is the average IQ in the UK? 100 on UK-normed tests. Online samples report about 100 to 102.
- What is the average IQ in the US? 100 on US-normed tests. The same online table reports about 101.
- Is the UK smarter than the US? IQ tests cannot say, because each is normed on its own population. School and adult skills tests favour the UK modestly, mostly in maths.
- What is the average IQ in the UK in 2026? Still 100 by construction. The 2025 online sample gives 101.6.
- Why do sites list different numbers? They use different tests, samples and adjustments, and several adjust small studies or estimate from neighbouring countries.
- Does the average IQ differ by age in the UK? No, norms are age-banded. Raw performance does change with age.
The bottom line
The average IQ in the UK vs the US is 100 versus 100, because each country’s IQ tests are normed on its own people. The measures that can be compared put the UK modestly ahead: 488 against 463 in PISA 2025 maths (a clear gap), 266 against 251 in adult skills, and a half-point difference in online IQ samples that means nothing. Treat any single “UK IQ” or “US IQ” number as a label for a particular test, sample and date, and use the IQ tests hub to see how a score is built.
Sources
- OECD (2026): PISA 2025 Results (Volume I), mean scores and standard errors in maths, reading and science, top and low performers and change over time; OECD (2024): Survey of Adult Skills 2023, literacy, numeracy and adaptive problem solving. Both as compiled in our Smartest Countries Index, where the US sampling caution is noted.
- International IQ Test (2026): country table of 2025 test-takers, as analysed in our average IQ by country review.
- Lynn, R. and Vanhanen, T. (2002): IQ and the Wealth of Nations, Praeger, for the method of national estimates.
- Flynn, J.R. (2009): Requiem for nutrition as the cause of IQ gains: Raven’s gains in Britain 1938-2008, Economics & Human Biology 7(1):18-27, as summarised in its abstract.
- Dworak, E.M., Revelle, W. and Condon, D.M. (2023): Looking for Flynn effects in a recent online US adult sample, Intelligence 98, as summarised in its abstract.
- Gap sizes against standard errors are our arithmetic from the OECD figures. Place rankings follow our UK places and US states studies.
Keep reading
All articles → Scores & Scales
What is Average IQ Test Score?
The average IQ test score is 100 by definition. About half of people score 90 to 109 and about 68% score 85 to 115. See the average range on each chart, why the average stays at 100, how scales differ and where to find averages for groups.
 Understanding IQ
PISA Test vs IQ Test
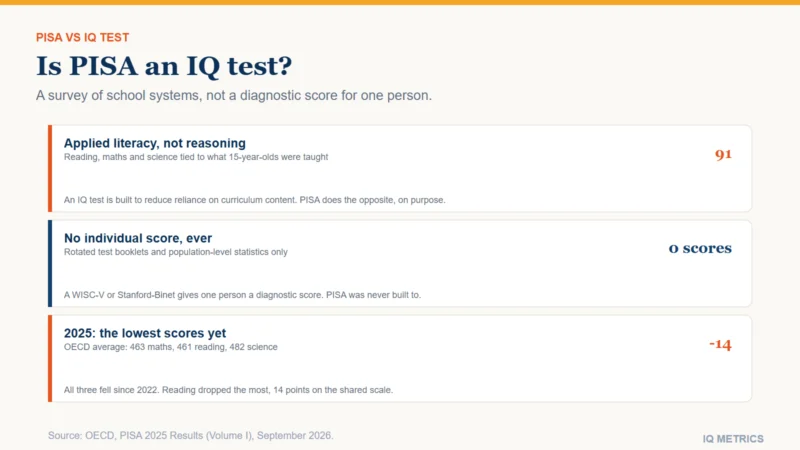
Is PISA an IQ test? No. PISA surveys applied school literacy across whole education systems and returns no individual score, while an IQ test diagnoses one person. See the new PISA 2025 results, published September 2026, and the real debate over using PISA as a national IQ proxy.
 Scores & Scales
IQ Scale By Age
The IQ scale is the same at every age, with an average of 100, but the test changes: the WPPSI-IV covers ages 2.5 to 7.5, the WISC-V ages 6 to 16 and the WAIS-IV and WAIS-5 ages 16 to 90. See which test fits each age, how a child's IQ was once calculated and how stable IQ is over a lifetime.