





Average IQ in the USA: 100 by Design, and What US Skills Data Show
The average IQ in the USA is 100 on any US-normed test, by design. What the 2024 WAIS-5 norm sample is, how US adult literacy and numeracy changed from 2017 to 2023, what an online study found from 2006 to 2018, and why a new test can hide a decline.

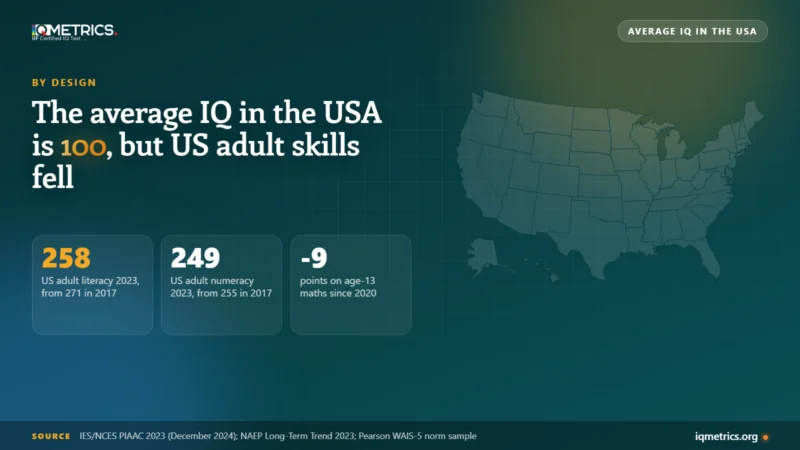
The average IQ in the USA is 100 on any IQ test normed on Americans, because every test is built that way. A publisher tests a sample of the US population, sets its average to 100 and reports later scores against it. The number is not a fact about Americans. What can be measured is skills, and they are slipping: US adult literacy fell from 271 to 258 between 2017 and 2023, and numeracy from 255 to 249.
Below: why the US average is 100, how big and how recent the US norm samples are, what skills tests say about Americans now, whether IQ scores are falling, and where to find the average by state and by age.
What is the average IQ in the USA?
One hundred, by design. An IQ score is a position in a norm sample, not a count of anything. The test maker gives the test to a group chosen to match the population, fixes that group’s average at 100 and its spread (standard deviation) at 15, and scores everyone else against it.
The newest US adult sample is the WAIS-5, published by Pearson in 2024 for ages 16 to 90. Its normative sample is 2020 examinees. A research paper describes Wechsler norming data as stratified to match the US Census on “sex, ethnicity, geographic region, and highest level of educational attainment”, and adds that these methods “do not eliminate all selection bias”. So 100 means the middle of that sample on the day it was tested.
The same logic gives the UK and Canada an average of 100 on their own tests, as our guides to the UK versus the US and Canada versus the US explain. For what a score of 100 means for one person, see what the average IQ test score is.
How do Americans compare with other countries?
On measures that are not re-normed country by country, the US is close to Canada on most of them and lower in maths. These are the figures from our own country guides, each with a different test and sample:
| Measure | US result | Compared with | Source |
|---|---|---|---|
| IQ tests, each normed on its own country | 100 | 100 in every country | By construction |
| Pooled IQ and school-test studies | 97.4 | Canada 99.5 | 62,649 people in 58 studies (our country table) |
| Online IQ test takers, 2025 | 101.04 | UK 101.57; US ranks 18th | 22,605 volunteers |
| PISA 2025, age 15, maths | 463 | Canada 485 | OECD, a clear gap |
| PISA 2025, age 15, reading and science | 490 and 502 | Canada 490 and 510 | Within error |
Read the table as a set of different yardsticks, not one ranking. The average IQ by country page lists the source of every number, and our review of country IQ rankings explains why such tables carry less weight than they appear to.
Is the average American IQ going down?
Some US measures have fallen, but the evidence is mixed. A 2023 paper in the journal Intelligence by Dworak, Revelle and Condon used 394,378 US adults who took online reasoning tasks between 2006 and 2018. It found “a pattern consistent with a reversed Flynn effect” for the composite score, for matrix reasoning and for letter and number series, and a gain on three-dimensional rotation. Verbal reasoning did not change enough to count.
The sample is a self-selected online group that is 65% female with a mean age of 34, and the authors warn of selection bias. The study measures puzzle skills on an open-source test, not Wechsler IQ. It suggests that, in this sample, scores did not keep rising after 2006.
For comparison, a meta-analysis of 285 studies found that IQ scores rose by 2.31 points per decade, or 2.93 points per decade after excluding older data, in data from 1951 on, mostly from the US and UK (Trahan and colleagues, 2014). That rise is the Flynn effect, and our guide to why IQ norms expire covers it.
What do skills tests say about Americans now?
They say adult skills fell. The 2023 Survey of Adult Skills (PIAAC), reported by the US Department of Education on 10 December 2024, gave US adults an average of 258 in literacy, against an international average of 260, and 249 in numeracy, against 263. Compared with 2017, when the averages were 271 in literacy and 255 in numeracy, NCES reports literacy 12 points lower on unrounded scores and numeracy about 6 points lower.
| Skill | US 2023 | US 2017 | International average 2023 | Share at or below Level 1, 2017 to 2023 |
|---|---|---|---|---|
| Literacy | 258 | 271 | 260 (not statistically different) | 19% to 28% |
| Numeracy | 249 | 255 | 263 (US below) | 29% to 34% |
The share of adults at or below Level 1 in literacy rose from 19% to 28%, about 47% more people in the lowest group. In numeracy it rose from 29% to 34%. School scores moved the same way. On the 2023 National Assessment of Educational Progress, average scores of 13-year-olds fell 4 points in reading and 9 in maths from 2020, and 7 and 14 points from 2012. These measure skills and schooling, not IQ.
Why can a new IQ test hide a decline?
Because every new edition resets the average to 100. If raw performance falls, a freshly normed test still gives its sample an average of 100. The decline shows up only in surveys that are not re-centred, such as PIAAC and NAEP, which use fixed scales. This is our reasoning from how norming works, not a finding in any one study.
It is why a US average of 100 and falling adult skills can both be true. The first is a definition. The second is a measurement. Keep them apart when you read a headline about American intelligence.
Where would your own score land?
Take the IIF-certified assessment and get your score with the scale it was measured on, the percentile it corresponds to and the confidence range around it — the three figures most online tests leave out.
Find your IQ score now! →What is the average IQ by state or by age?
No census-style IQ average exists for US states, so state tables rest on proxies such as test scores and education. Our average IQ by US state guide shows all 50 states and what each number rests on, and the smartest states in America study lists the data behind the ranking.
By age, scores are placed against people of the same age, so a 100 means average for your age. For how ability changes across life, see IQ and age, and for how children’s thinking develops before adult scores apply, see Piaget’s stages of cognitive development. For a position on the curve, use the IQ percentile calculator and the IQ bell curve.
What should you do with the number 100?
Treat it as the reference point, not a result. If you want your own score placed against a norm sample, take the IQ test and read the percentile next to the number.
Quick answers
- What is the average IQ in America? 100 on a US-normed test, by definition.
- Is the average American IQ above 100? No test can say. Every test sets its own sample to 100.
- Are Americans getting less intelligent? Some measures fell: US adult literacy from 271 to 258 and numeracy from 255 to 249 between 2017 and 2023, and in one online reasoning study from 2006 to 2018. These are skills and puzzle scores, not Wechsler IQ.
- How big is the newest US norm sample? The WAIS-5, published in 2024, was normed on 2020 examinees.
The bottom line
The average IQ in the USA is 100 because tests are built to say so. The facts worth tracking are skills: US adults scored 258 in literacy and 249 in numeracy in 2023, both down from 2017, and numeracy sits below the international average.
Sources
- IES/NCES press release, 10 December 2024: US PIAAC 2023 results.
- NCES, Highlights of the 2023 U.S. PIAAC results: change since 2017 and shares at the lowest levels.
- Dworak, Revelle and Condon (2023), Intelligence 98, 101734: reversed Flynn effect in a US online sample.
- The Nation’s Report Card, Long-Term Trend 2023: age-13 reading and maths changes.
- Pearson, WAIS-5 by the numbers: normative sample of 2020 examinees.
- Trahan et al. (2014), Psychological Bulletin 140(5): meta-analysis of the Flynn effect.
Keep reading
All articles →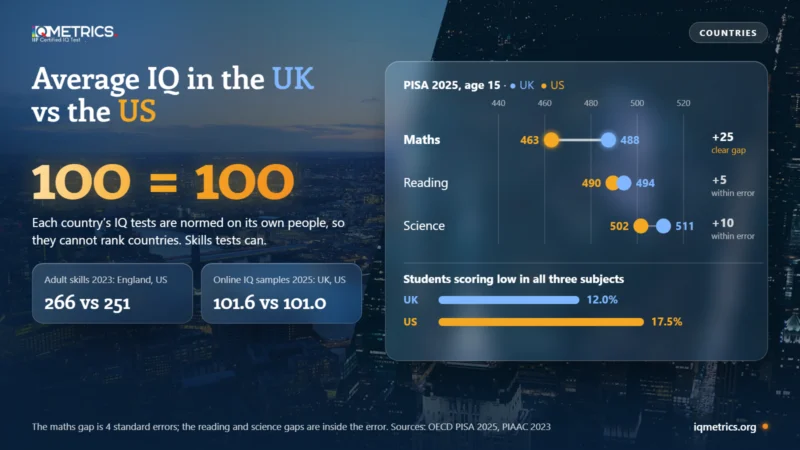 Scores & Scales
Average IQ in the UK vs the US
The average IQ in the UK vs the US is 100 in both, because each country's tests are normed on its own people. See what can be compared: PISA 2025 maths (UK 488, US 463), adult skills (266 vs 251), online samples, the Flynn effect in each country and where the real gaps sit.
 Scores & Scales
Average IQ in Canada (vs the US)
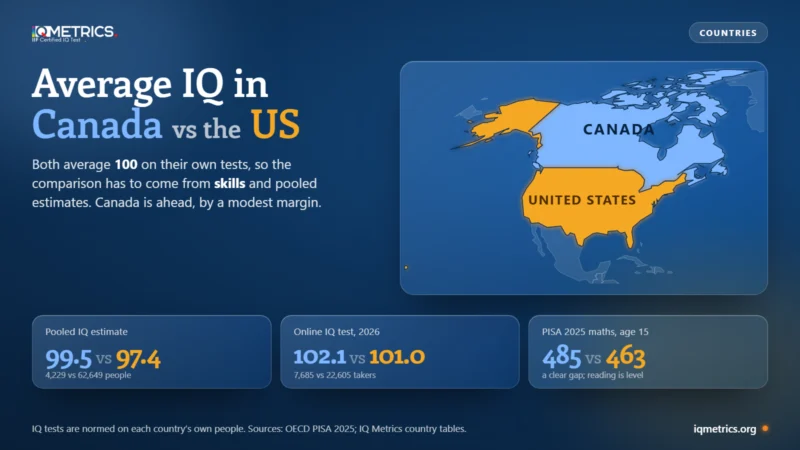
Average IQ in Canada vs the US: both are 100 on their own tests, so compare skills instead. Canada is ahead on PISA 2025 maths by 22 points and on adult skills by 16. See the provinces, why Canadian and US WAIS-IV norms give different scores, and how far Canada has fallen since 2012.
 Scores & Scales
What is Average IQ Test Score?
The average IQ test score is 100 by definition. About half of people score 90 to 109 and about 68% score 85 to 115. See the average range on each chart, why the average stays at 100, how scales differ and where to find averages for groups.