





What Is a Normal Person's IQ? The 85 to 115 Range on Each Scale
A normal IQ is 100, and the normal range is 85 to 115, which holds 68.3% of people on the standard scale (SD 15). The same band holds 65.1% on SD 16 and only 46.8% on the Cattell scale. The full range by band, by scale and by age, with sources and the arithmetic.

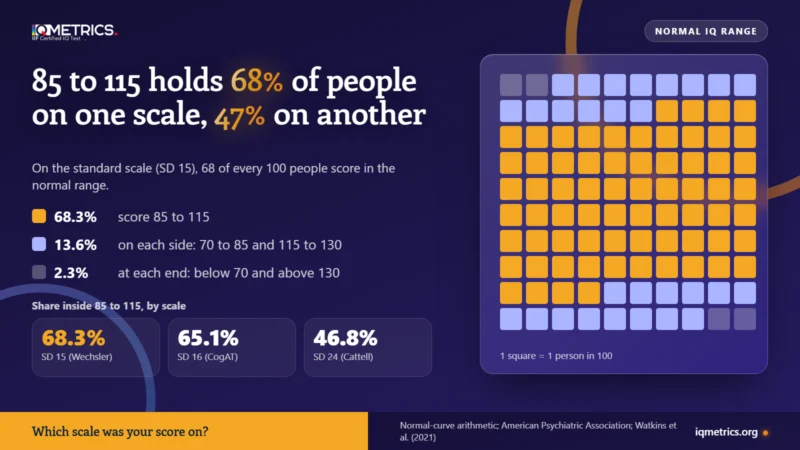
A normal person's IQ is 100, and the normal range is 85 to 115. On the standard scale (average 100, standard deviation 15) that range holds 68% of people, about 2 in 3. The narrower Average band on the WPPSI-IV, a Wechsler test, is 90 to 109 and holds about half. The range depends on the scale: 85 to 115 holds 65% of people on an SD 16 test and only 47% on the Cattell scale.
Below: each band with its share of people, a table showing how “normal” shifts between scales, and what normal means at every age. The new part is that table. We worked out how many people sit inside 85 to 115 and 70 to 130 on three scales. The answers differ.
Key takeaways
- Normal IQ: 100 is the average and 85 to 115 is the normal range, one standard deviation either side. It holds 68.3% of people on SD 15.
- Average band: the WPPSI-IV, a Wechsler test, calls 90 to 109 Average, which holds 49.5% of people.
- Other scales: the same 85 to 115 holds 65.1% of people on SD 16 and 46.8% on SD 24. On those scales the band that holds about 68% is 84 to 116 and 76 to 124.
- Age: scores are compared with people of the same age, so the normal range is the same for a child and an adult.
- Precision: one score is a range of about 5 to 6 points either side, so 84 and 86 are not reliably different.
What is a normal person's IQ?
A normal person's IQ is 100, the average, and the normal range runs from 85 to 115. That is one standard deviation (SD) below and above the average. The SD tells you how spread out scores are, and on most modern IQ tests one SD is 15 points.
Why is the average always 100? Because tests are built that way. A large reference group takes the test, and the scores are set so that their average is 100. Watkins and colleagues (2021) describe the Wechsler scores this way: standard index scores have a mean of 100 and an SD of 15. A score is then a place in that group, not a count of anything.
On a normal curve, 68.3% of people fall within one SD of the average. So 2 in 3 people have an IQ between 85 and 115, and the other third is split evenly above and below. Our IQ percentile calculator places any single score on the same curve.
The American Psychiatric Association gives the same figure on its page about intellectual disability: the majority of people, 68%, have IQ scores between 85 and 115.
What is the normal IQ range?
The normal IQ range is 85 to 115, the band within one SD of average. Test publishers also use a narrower Average band: Pearson’s WPPSI-IV report says index scores of 90 to 109 are considered average.
| IQ band | Share of people | In plain words |
|---|---|---|
| 130 and above | 2.3% | About 1 in 44, near the top 2% line for Mensa |
| 115 to 130 | 13.6% | Above the normal range |
| 85 to 115 | 68.3% | The normal range, about 2 in 3 people |
| 70 to 85 | 13.6% | Below the normal range |
| Below 70 | 2.3% | Far below average |
The Woodcock-Johnson IV chart from Riverside Insights draws its Average band a little wider, from 90 to 110. Publishers differ on the exact edges, so check the chart for the test you took. Our IQ test range guide and average IQ score guide show the bands side by side.
The edges above are exact points on the curve, from 85.0 to 115.0. If you count whole-number scores from 85 to 115 inclusive, which runs from 84.5 to 115.5, the share rises to 69.9%.
Is a normal human IQ the same on every scale?
No. The band 85 to 115 holds 68.3% of people on SD 15, 65.1% on SD 16 and only 46.8% on the Cattell scale, which has an SD of 24. The scale decides how wide “normal” is.
| Scale | Used by | Inside 85 to 115 | Inside 70 to 130 | Band that holds 68.3% |
|---|---|---|---|---|
| SD 15 | Wechsler tests, Stanford-Binet 5 | 68.3% | 95.4% | 85 to 115 |
| SD 16 | CogAT standard age score, NNAT3, older Stanford-Binet forms | 65.1% | 93.9% | 84 to 116 |
| SD 24 | Cattell scale | 46.8% | 78.9% | 76 to 124 |
The formula is simple. The share of people within a points of 100 is erf(a / (SD x the square root of 2)). Here erf is the error function of the normal curve. For 85 to 115, a is 15. For 70 to 130, a is 30. We rounded each answer to one decimal place.
Riverside Insights gives the CogAT standard age score an SD of 16, and Pearson’s NNAT3 manual gives its ability index an SD of 16. Wikipedia’s entry on the Cattell Culture Fair test says it was built with an SD of 24. Our guide to SD 15 versus SD 16 explains why the scales differ.
The effect is large at the edges. An 85 is the 15.9th percentile on SD 15, the 17.4th on SD 16 and the 26.6th on the Cattell scale. A score that looks borderline on one test can look ordinary on another.
Is 100 the normal IQ at every age?
Yes. Tests such as the Wechsler scales compare each person with others of the same age, so the average stays at 100 for a child and for an adult.
Pearson’s WPPSI-IV report, for example, gives each child a percentile rank that shows standing relative to other children the same age. A normal IQ for a 10-year-old and for a 60-year-old is therefore the same 85 to 115. What changes with age is the raw performance behind the score. Our guide to the IQ scale by age covers that.
What is the average human being IQ, and has anyone measured it?
The average human being IQ is 100 on any test normed on a general population, because the test is built to give that result. Nobody has tested all of humanity, so there is no measured world average.
Country averages come from tests given to very different samples, which is why they differ so much between sources. Our average IQ by country page lists them. For a comparison built on tested skills instead, see the smartest countries index, which ranks 86 countries on PISA 2025 results and is not an IQ ranking.
Where would your own score land?
Take the IIF-certified assessment and get your score with the scale it was measured on, the percentile it corresponds to and the confidence range around it — the three figures most online tests leave out.
Find your IQ score now! →What IQ is below normal, and what IQ is above it?
Below 85 is below the normal range, and above 115 is above it. About 1 person in 6 scores under 85, and about 1 in 6 scores over 115.
The stretch from 70 to 84 is often called borderline. Our guide to the borderline IQ range covers what it does and does not mean. A score near 70 is one of the things clinicians weigh when they consider an intellectual disability. The AAIDD says a score of around 70 or as high as 75 indicates a significant limitation. It also requires difficulty in everyday skills that began before age 22.
At the other end, Mensa International admits people in the top 2% on a supervised test. That starts at 130.8 on SD 15, well above the normal range. See what an IQ of 131 means for how that line plays out test by test, and our Mensa statistics study for the member numbers.
How exact is a normal IQ score?
Not very, at the level of single points. A full-scale score on a well-built adult test has a standard error of measurement of about 2 to 3 points.
A 95% interval is then roughly 5 to 6 points either side. A reported 90 and a reported 95 can describe the same person. Our explainer on the margin of error in an IQ score shows how to read it. To see where you land, take the IQ test and compare the result with the bands above.
Quick answers
- What is the IQ of a normal person? 100 is the average, and 85 to 115 is the normal range on the standard scale (SD 15).
- What is a normal IQ range? 85 to 115 holds 68.3% of people. The WPPSI-IV Average band, 90 to 109, holds 49.5%.
- Is the normal human IQ the same on every test? No. The band 85 to 115 holds 65.1% of people on SD 16 and 46.8% on SD 24.
- What is the average human being IQ? 100 on any normed test, by design. No one has measured a world average.
- Is an IQ of 85 normal? It is the bottom of the normal range, the 15.9th percentile on SD 15.
The bottom line
A normal person's IQ is 100, and the normal range is 85 to 115. How many people that range holds depends on the scale: 68.3% on SD 15, 65.1% on SD 16 and 46.8% on the Cattell scale. Always ask which scale a score uses before you call it normal, low or high.
Sources
- Watkins et al. (2021), Applied Neuropsychology: Child: Wechsler standard index scores have a mean of 100 and an SD of 15.
- Pearson, WPPSI-IV interpretive report: index scores of 90 to 109 are considered average, and percentile ranks compare a child with others of the same age.
- Pearson, NNAT3 manual: the Naglieri Ability Index has an average of 100 and a standard deviation of 16.
- Riverside Insights, CogAT score descriptions and Woodcock-Johnson IV classification chart.
- Wikipedia, Cattell Culture Fair Intelligence Test: built with a standard deviation of 24.
- AAIDD, definition of intellectual disability, American Psychiatric Association, what is intellectual disability (68% between 85 and 115) and Mensa International, how to join.
- Shares of people are our arithmetic from the normal curve: the share within a points of 100 is erf(a divided by SD times the square root of 2), rounded to one decimal place.
Keep reading
All articles → Scores & Scales
What is Average IQ Test Score?
The average IQ test score is 100 by definition. About half of people score 90 to 109 and about 68% score 85 to 115. See the average range on each chart, why the average stays at 100, how scales differ and where to find averages for groups.
 Scores & Scales
IQ Score Ranges Explained: What Your IQ Number Really Means
The range of an IQ test is the span of scores it can report: about 40 to 160 for the major individually given tests. See the range by test, the percentile and band for every score from 85 to 145, why online tests report numbers outside the range and how far a score can move between sittings.
 Scores & Scales
IQ Classifications
IQ classification sorts scores into named bands, and the names depend on the test: Average is 90 to 109 on the Wechsler scales, but 130 and above is Very Superior on one test and Extremely High on another. See the labels side by side, where they came from and what they do not mean.