
Can a brain scan show your IQ? Every MRI study, sample size against result
We collected every published MRI study of healthy people we could read that relates the brain to an intelligence score, 2008-2026, and set each result against its sample size, method and whether family background was taken into account.

By Leon Falkner, Data & Research Analyst · Reviewed by Aarav Vardhan, Editor-in-Chief · Published 11 November 2026 · 15 min read
About this study
- Report type
- Data study: our ledger of published MRI-intelligence results, sample size against result
- Data
- 23 results from 18 papers, 2008-2026; healthy samples of 107 to 18,363 people (UK Biobank, ABCD, HCP, cohorts)
- Sources
- OpenAlex searches (2,208 records), 78 records read, Europe PMC open full texts, the 2026 Science paper
- Years
- Results 2008 to 2026; searches as of 11 November 2026
- Licence
- CC BY 4.0 (our dataset and charts)
- Version
- 2026.11
- Sources
- 30
No: a brain scan cannot show one person’s IQ. In the 12 largest results we found (1,022 to 18,363 people), brain MRI and intelligence scores correlate at a median r = .35, so the scan accounts for about 12% of the differences in test scores. IQ Metrics Research ledger of 23 results, 2008-2026, as of 11 November 2026.
01 Key findings
- A scan is not an IQ test. In the 12 results with 1,000 or more people, the median r is .35: the brain measure accounts for about 12% of the differences in scores, and nothing about any one person.IQ Metrics calculation
- Brain size matters least. Total brain volume, the oldest measure, links at r = .18 to .28 in the three volume results with 1,000+ people: about 4% of score differences.Nave, Cox, Lee
- Bigger studies did not shrink the link in our ledger. The rank correlation between sample size and r is -.02; studies of 1,000+ people report a median of .35 against .42 for 100-999.IQ Metrics calculation
- Neighbourhood opportunity explains part of it. In ABCD children, adjusting for neighbourhood social and economic opportunity cut the brain-IQ link by 30 to 40% (connectivity r = .36 to .23).Marek et al. 2026
- Few studies check. 4 of 23 results adjust for family income, SES or the family; one prints the link both ways.IQ Metrics ledger
- Prediction got stricter. All 12 results since 2021 either test their model on unseen people or do not say; same-sample correlations are mostly pre-2020.IQ Metrics ledger
02 Statistics to quote
median link between brain MRI and an intelligence score in the 12 results with 1,000 or more people (about 12% of score differences).
IQ Metrics calculationof the differences in intelligence scores accounted for by total brain volume in the three volume results with 1,000+ people (median r = .19).
IQ Metrics calculationtotal brain volume and a g factor in the largest result, 18,363 UK Biobank adults aged 44-81 (95% CI .25 to .30).
Cox et al. 2019brain-IQ prediction from resting connectivity after adjusting for neighbourhood social and economic opportunity: r .36 to .23 in ABCD children tested on 2,263 unseen children (Marek 2026).
Marek et al. 2026results in our ledger take family income, an SES index or the family into account; only one study prints the link both before and after.
IQ Metrics ledgerrank correlation between sample size and reported r across all 23 results: bigger studies did not report smaller links on average (IQ Metrics calculation).
IQ Metrics calculationmedian for 13 results tested on unseen people vs 7 same-sample correlations, which are mostly of brain volume.
IQ Metrics calculationchildren enrolled in the ABCD Study sample behind the 2026 SES result; 4,579 were analysed after quality checks.
Marek et al. 2026results from 18 papers, 2008-2026, with n from 107 to 18,363, in healthy samples (no patient groups).
IQ Metrics ledgerUK Biobank adults in the preregistered brain-size study: total brain volume and fluid intelligence r = .19 with income-related status in the model.
Nave et al.pooled brain volume-IQ link in the Pietschnig 2015 meta-analysis (88 studies, more than 8,000 people), which also found the published links overestimated.
Pietschnig et al. 2015the most any ledger result accounts for (Choi 2008, r = .71 from 50%%, 225 people, regions picked and tested within one study).
Choi et al. 200803 Can a brain scan show your IQ?
No: in the 12 largest published results we found, brain MRI accounts for about 12% of the differences in intelligence scores between people (median r = .35), far too little to read one person’s IQ from a scan. Our ledger holds 23 results from 18 papers, 2008-2026, each relating an MRI measure (brain volume, the cortex, white matter, connectivity at rest or during tasks) to a general intelligence score in a healthy sample, with the sample size, the method and whether family circumstances were taken into account.
A correlation of r = .35 describes a group. It says that, across thousands of people, those with a given brain pattern score a little higher on average; it does not say that a scan can place any individual on the IQ scale. The brain-imaging results most often quoted in the news were found in a few hundred people; the largest samples, from the UK Biobank, the Adolescent Brain Cognitive Development (ABCD) Study and the Human Connectome Project (HCP), report links of r = .19 to .54. An IQ score itself is measured with a test, as our guide to the IQ score range explains.
We built our own ledger because the nearest existing work is one systematic review: Vieira and colleagues (Intelligence, 2022) reviewed 30 machine-learning studies found by a Scopus search to 15 December 2020 and estimated r = .42 for predicting general intelligence from fMRI [28] [6]. That review covers out-of-sample prediction only, does not flag which studies took family income into account, and ends before the biobank-sized studies of 2021-2026. Our ledger adds same-sample correlations, results through November 2026, the SES flag, sample-size bands, the share of score differences in plain words and an open CSV.
- Brain MRI
- Magnetic resonance imaging: a scanner measures brain structure (volume, cortical thickness, white matter) or, with functional MRI (fMRI), changes in blood oxygen that track brain activity. It does not use radiation.
- Correlation (r)
- A number from -1 to +1 for how closely two measures move together across people. r = 0 means no link; r = .30 is a modest link; r = 1 would mean one predicts the other exactly.
- Share of score differences (r squared)
- r x r, as a percentage: how much of the spread in test scores between people a brain measure accounts for, in that sample. r = .30 gives 9%. It is a property of a group, not a person.
- Out-of-sample prediction
- A model is built on some people and tested on others it has never seen (cross-validation or a held-out sample). It guards against fitting noise, which same-sample correlations cannot do.
- Resting-state functional connectivity
- How closely the activity of brain regions rises and falls together while a person lies in the scanner doing nothing. Task fMRI records the same during a task such as remembering a sequence.
- General intelligence (g)
- What different mental tests share: people who do well on one tend to do well on others. Studies here use full-scale IQ, a g factor, a fluid reasoning score or a test battery total.
- Socioeconomic status (SES)
- A family’s social and economic position: income, parental education or the opportunities of the neighbourhood. It is linked both to test scores and to brain measures, so it can make a brain-IQ link look stronger.
- Brain-wide association study (BWAS)
- A study that links one trait, such as an IQ score, to measures across the whole brain. Marek and colleagues showed in 2022 that such studies need thousands of people to give stable numbers [21].
04 How many MRI studies link brain scans to intelligence?
We found 23 results from 18 papers that print both a sample size and a usable correlation, published 2008-2026. They came from 2,208 unique records in 12 OpenAlex searches, of which 564 named an MRI measure and an intelligence score, 409 passed a filter for patient groups and reviews and 51 printed a correlation in the abstract; with 27 named leads from the reviews and the news, we read 78 records by hand. The count is a lower bound: many studies print their result only in a figure or a table we could not open, and we list every record we read and left out.
From 2,208 search records to 13 kept papers, plus 5 from named leads
Stage 1: unique records from 12 OpenAlex searches. Stages 2-4: scripted word rules on titles and abstracts (written before screening). Stage 5: the 51 survivors read by hand; 13 kept. The 27 named leads read the same way added 5 papers: 18 papers and 23 results in all; 4 reviews went to a separate table. As of 11 November 2026.
Source: OpenAlex [1]; Europe PMC [2]; screening by IQ Metrics (data/screen_decisions.tsv)
Data table
| stage | count | pct_of_first | pct_of_previous |
|---|---|---|---|
| Unique OpenAlex records (12 searches) | 2208 | 100 | 100 |
| Names an MRI measure and an intelligence score | 564 | 25.5 | 25.5 |
| No disorder, patient or animal words in the title; not a review | 409 | 18.5 | 72.5 |
| Abstract prints a correlation or variance explained | 51 | 2.3 | 12.5 |
| Kept after reading the abstract or open text | 13 | 0.6 | 25.5 |
Embed this chart
Paste this HTML into your page: it carries the numbers and the credit link to this figure.
Most results come from three big shared datasets: 8 from the ABCD Study of American children aged 9-10, 7 from the Human Connectome Project of young adults and 2 from middle-aged and older UK Biobank adults; the other 6 come from cohorts and samples of a single laboratory. The search for intelligence in brain scans began before MRI: in 1988 Haier and colleagues measured glucose use in the cortex with positron emission tomography (PET) while people solved an abstract reasoning test [5]. We show that study as history, not as a row.
From one PET study in 1988 to biobank-sized MRI samples
Every ledger result by year and brain measure, plus the 1988 PET study that started the search for intelligence in brain scans (history only). Colour = same-sample correlation, test on unseen people, or not stated. 18 of the 23 results appeared in 2018 or later. As of 11 November 2026.
Source: Our ledger [1]; Haier et al. 1988 [5]
Data table
| brain measure | type | from | to | label | detail |
|---|---|---|---|---|---|
| History | event | 1988 | Haier 1988 | Haier and colleagues: glucose use in the cortex during an abstract reasoning test, PET (history only, not a ledger row) | |
| Brain volume | event | 2009 | Shenkin 2009 | Shenkin 2009: r = .21, n = 107, Own sample (community volunteers, Scotland) | |
| Brain volume | event | 2018 | Nave 2018 | Nave 2018: r = .19, n = 13,608, UK Biobank | |
| Brain volume | event | 2019 | Cox 2019 | Cox 2019: r = .28, n = 18,363, UK Biobank | |
| Brain volume | event | 2019 | Lee 2019 | Lee 2019: r = .18, n = 1,022, Human Connectome Project (siblings) | |
| Cortex thickness or area | event | 2024 | Michel 2024 (grey) | Michel 2024 (grey): r = .39, n = 11,876, ABCD Study | |
| Cortex thickness or area | event | 2026 | Marek 2026 (thickness) | Marek 2026 (thickness): r = .23, n = 2,263, ABCD Study | |
| White matter | event | 2011 | Ganjavi 2011 | Ganjavi 2011: r = -.15, n = 198, NIH MRI Study of Normal Brain Development | |
| White matter | event | 2018 | Alnaes 2018 | Alnaes 2018: r = .39, n = 729, Philadelphia Neurodevelopmental Cohort | |
| White matter | event | 2024 | Michel 2024 (white) | Michel 2024 (white): r = .35, n = 11,876, ABCD Study | |
| Resting connectivity | event | 2016 | Hearne 2016 | Hearne 2016: r = .38, n = 317, Human Connectome Project | |
| Resting connectivity | event | 2018 | Dubois 2018 | Dubois 2018: r = .45, n = 884, Human Connectome Project | |
| Resting connectivity | event | 2021 | Sripada 2021 | Sripada 2021: r = .42, n = 5,937, ABCD Study | |
| Resting connectivity | event | 2022 | Marek 2022 | Marek 2022: r = .34, n = 3,604, ABCD Study | |
| Resting connectivity | event | 2026 | Marek 2026 (RSFC) | Marek 2026 (RSFC): r = .36, n = 2,263, ABCD Study | |
| Task fMRI | event | 2020 | Sripada 2020 | Sripada 2020: r = .50, n = 967, Human Connectome Project | |
| Task fMRI | event | 2022 | Tetereva 2022 (tasks) | Tetereva 2022 (tasks): r = .56, n = 873, Human Connectome Project | |
| Several measures together | event | 2008 | Choi 2008 | Choi 2008: r = .71, n = 225, Own sample (young adults) | |
| Several measures together | event | 2015 | Ritchie 2015 | Ritchie 2015: r = .42, n = 672, Lothian Birth Cohort 1936 | |
| Several measures together | event | 2022 | Tetereva 2022 | Tetereva 2022: r = .57, n = 873, Human Connectome Project | |
| Several measures together | event | 2024 | Michel 2024 | Michel 2024: r = .44, n = 11,876, ABCD Study | |
| Several measures together | event | 2024 | Popp 2024 | Popp 2024: r = .25, n = 1,030, Human Connectome Project | |
| Several measures together | event | 2024 | Popp 2024 (new sample) | Popp 2024 (new sample): r = .19, n = 567, Independent sample (not named in the abstract) | |
| Several measures together | event | 2025 | Wang 2025 | Wang 2025: r = .54, n = 10,754, ABCD Study |
Embed this chart
Paste this HTML into your page: it carries the numbers and the credit link to this figure.
05 Do bigger studies find a weaker link between the brain and IQ?
Not in our ledger: results with 1,000 or more people report a median r = .35, against .42 for studies of 100-999 people, and the rank correlation between sample size and r is -.02, which is no relation. Marek and colleagues showed the inflation directly inside one dataset: when they drew small samples from the ABCD Study, “irreproducible, inflated effect sizes were ubiquitous”, and the links stabilised only with about 2,000 people or more [21]. Our ledger cannot show that shrinking because it holds no result with fewer than 100 people: the classic small studies (for example Andreasen 1993, 67 volunteers) print no r in the text we could read [8].
Sample size against result: 23 brain-scan results from 107 to 18,363 people
Each dot is one result: people scanned (across, log scale) and the reported link between the brain measure and an intelligence score (up, r). Results with 1,000 or more people have a median r of .35 against .42 for 100-999 people; the rank correlation between sample size and r is -.02 (IQ Metrics calculation). As of 11 November 2026.
Reported link with intelligence (r)
People scanned (log scale)
r from R squared (square root) is an IQ Metrics calculation for 7 results.
Source: Our ledger of 23 results [1]; r and n as printed in each paper
Data table
| result | n | r | group |
|---|---|---|---|
| Ganjavi 2011 | 198 | -0.1 | White matter |
| Shenkin 2009 | 107 | 0.2 | Volume |
| Choi 2008 | 225 | 0.7 | Multimodal |
| Ritchie 2015 | 672 | 0.4 | Multimodal |
| Hearne 2016 | 317 | 0.4 | Resting FC |
| Dubois 2018 | 884 | 0.4 | Resting FC |
| Alnaes 2018 | 729 | 0.4 | White matter |
| Nave 2018 | 13608 | 0.2 | Volume |
| Cox 2019 | 18363 | 0.3 | Volume |
| Lee 2019 | 1022 | 0.2 | Volume |
| Sripada 2020 | 967 | 0.5 | Task fMRI |
| Sripada 2021 | 5937 | 0.4 | Resting FC |
| Marek 2022 | 3604 | 0.3 | Resting FC |
| Tetereva 2022 | 873 | 0.6 | Multimodal |
| Tetereva 2022 (tasks) | 873 | 0.6 | Task fMRI |
| Michel 2024 | 11876 | 0.4 | Multimodal |
| Michel 2024 (grey) | 11876 | 0.4 | Cortex |
| Michel 2024 (white) | 11876 | 0.4 | White matter |
| Popp 2024 | 1030 | 0.2 | Multimodal |
| Popp 2024 (new sample) | 567 | 0.2 | Multimodal |
| Wang 2025 | 10754 | 0.5 | Multimodal |
| Marek 2026 (RSFC) | 2263 | 0.4 | Resting FC |
| Marek 2026 (thickness) | 2263 | 0.2 | Cortex |
Embed this chart
Paste this HTML into your page: it carries the numbers and the credit link to this figure.
The flat pattern hides two opposite trends. Brain-volume studies are large and report modest links (r = .18 to .275 in samples of 1,000 or more), while prediction studies of connectivity and combined scans moved from a few hundred young adults in the HCP to thousands of ABCD children and kept reporting r = .34 to .54 [21] [20] [25]. The highest result, r = .71, comes from 225 young adults whose brain regions were picked and tested within the same study [11]; the second highest, r = .57, combines seven task scans, structure and resting connectivity in 873 HCP adults [22].
Every result with its 95% interval, largest sample first
Square = reported r (area = people scanned); line = 95% interval. Only Cox 2019 prints an interval; the other 22 are Fisher-z intervals from r and n (IQ Metrics calculation), which ignore model choices and so are too narrow for prediction studies. No pooled estimate: the rows mix measures and methods. As of 11 November 2026.
Reported link with an intelligence score (r)
Source: Our ledger; intervals by IQ Metrics except Cox 2019 [17]
Data table
| result | study | detail | n | estimate | ci_low | ci_high |
|---|---|---|---|---|---|---|
| All 23 results | Cox 2019 | Volume, UK Biobank | 18363 | 0.3 | 0.3 | 0.3 |
| All 23 results | Nave 2018 | Volume, UK Biobank | 13608 | 0.2 | 0.2 | 0.2 |
| All 23 results | Michel 2024 | Combined, ABCD | 11876 | 0.4 | 0.4 | 0.5 |
| All 23 results | Michel 2024 (grey) | Cortex, ABCD | 11876 | 0.4 | 0.4 | 0.4 |
| All 23 results | Michel 2024 (white) | White m., ABCD | 11876 | 0.4 | 0.3 | 0.4 |
| All 23 results | Wang 2025 | Combined, ABCD | 10754 | 0.5 | 0.5 | 0.6 |
| All 23 results | Sripada 2021 | Rest FC, ABCD | 5937 | 0.4 | 0.4 | 0.4 |
| All 23 results | Marek 2022 | Rest FC, ABCD | 3604 | 0.3 | 0.3 | 0.4 |
| All 23 results | Marek 2026 (RSFC) | Rest FC, ABCD | 2263 | 0.4 | 0.3 | 0.4 |
| All 23 results | Marek 2026 (thickness) | Cortex, ABCD | 2263 | 0.2 | 0.2 | 0.3 |
| All 23 results | Popp 2024 | Combined, HCP | 1030 | 0.2 | 0.2 | 0.3 |
| All 23 results | Lee 2019 | Volume, HCP | 1022 | 0.2 | 0.1 | 0.2 |
| All 23 results | Sripada 2020 | Task, HCP | 967 | 0.5 | 0.5 | 0.5 |
| All 23 results | Dubois 2018 | Rest FC, HCP | 884 | 0.4 | 0.4 | 0.5 |
| All 23 results | Tetereva 2022 | Combined, HCP | 873 | 0.6 | 0.5 | 0.6 |
| All 23 results | Tetereva 2022 (tasks) | Task, HCP | 873 | 0.6 | 0.5 | 0.6 |
| All 23 results | Alnaes 2018 | White m., PNC | 729 | 0.4 | 0.3 | 0.5 |
| All 23 results | Ritchie 2015 | Combined, LBC1936 | 672 | 0.4 | 0.4 | 0.5 |
| All 23 results | Popp 2024 (new sample) | Combined, new sample | 567 | 0.2 | 0.1 | 0.3 |
| All 23 results | Hearne 2016 | Rest FC, HCP | 317 | 0.4 | 0.3 | 0.5 |
| All 23 results | Choi 2008 | Combined, own sample | 225 | 0.7 | 0.6 | 0.8 |
| All 23 results | Ganjavi 2011 | White m., NIH MRI study | 198 | -0.1 | -0.3 | -0 |
| All 23 results | Shenkin 2009 | Volume, own sample | 107 | 0.2 | 0 | 0.4 |
Embed this chart
Paste this HTML into your page: it carries the numbers and the credit link to this figure.
The intervals are narrow for the biobank-sized studies (Cox and colleagues print .25 to .30 for 18,363 people [17]) and wide for studies of a few hundred. A model tested on a new sample can do worse than in its own: Popp and colleagues report r = .25 in 1,030 HCP adults and r = .19 in a completely independent sample of 567 [24].
Samples grew from hundreds to thousands; the reported links did not fall to zero
Each bubble is one result by publication year (across) and reported r (up); bubble area = people scanned. Every result since 2021 in the ledger tests its model on people it was not trained on, or does not say; 12 of the 12 results with 1,000 or more people appeared from 2018 on. As of 11 November 2026.
Reported link with intelligence (r)
Publication year
Source: Our ledger [1]
Data table
| result | year | r | group | n |
|---|---|---|---|---|
| Ganjavi 2011 | 2011 | -0.1 | in-sample | 198 |
| Shenkin 2009 | 2009 | 0.2 | in-sample | 107 |
| Choi 2008 | 2008 | 0.7 | out-of-sample | 225 |
| Ritchie 2015 | 2015 | 0.4 | in-sample | 672 |
| Hearne 2016 | 2016 | 0.4 | in-sample | 317 |
| Dubois 2018 | 2018 | 0.4 | out-of-sample | 884 |
| Alnaes 2018 | 2018 | 0.4 | out-of-sample | 729 |
| Nave 2018 | 2018 | 0.2 | in-sample | 13608 |
| Cox 2019 | 2019 | 0.3 | in-sample | 18363 |
| Lee 2019 | 2019 | 0.2 | in-sample | 1022 |
| Sripada 2020 | 2020 | 0.5 | out-of-sample | 967 |
| Sripada 2021 | 2021 | 0.4 | out-of-sample | 5937 |
| Marek 2022 | 2022 | 0.3 | out-of-sample | 3604 |
| Tetereva 2022 | 2022 | 0.6 | out-of-sample | 873 |
| Tetereva 2022 (tasks) | 2022 | 0.6 | out-of-sample | 873 |
| Michel 2024 | 2024 | 0.4 | not stated | 11876 |
| Michel 2024 (grey) | 2024 | 0.4 | not stated | 11876 |
| Michel 2024 (white) | 2024 | 0.4 | not stated | 11876 |
| Popp 2024 | 2024 | 0.2 | out-of-sample | 1030 |
| Popp 2024 (new sample) | 2024 | 0.2 | out-of-sample | 567 |
| Wang 2025 | 2025 | 0.5 | out-of-sample | 10754 |
| Marek 2026 (RSFC) | 2026 | 0.4 | out-of-sample | 2263 |
| Marek 2026 (thickness) | 2026 | 0.2 | out-of-sample | 2263 |
Embed this chart
Paste this HTML into your page: it carries the numbers and the credit link to this figure.
Most results sit between r = .1 and r = .6
All 23 results in bins of 0.1. Median r = .38. One result is negative (corpus callosum area after correcting for brain size, [[ganjavi2011]]); the highest is .71 (Choi 2008, regions chosen and tested in one study of 225 people). As of 11 November 2026.
Reported r
Source: Our ledger; bins by IQ Metrics
Data table
| from | to | results |
|---|---|---|
| -0.2 | -0.1 | 1 |
| -0.1 | 0 | 0 |
| 0 | 0.1 | 0 |
| 0.1 | 0.2 | 3 |
| 0.2 | 0.3 | 4 |
| 0.3 | 0.4 | 6 |
| 0.4 | 0.5 | 4 |
| 0.5 | 0.6 | 4 |
| 0.6 | 0.7 | 0 |
| 0.7 | 0.8 | 1 |
Embed this chart
Paste this HTML into your page: it carries the numbers and the credit link to this figure.
06 Does brain size correlate to intelligence?
Yes, weakly: in the three largest brain-volume results (1,022 to 18,363 people) total brain volume correlates with intelligence scores at r = .18 to .275, about 4% of the differences in scores at the median. The largest, 18,363 UK Biobank adults aged 44-81, gives r = .275 between total brain volume and a g factor from four tests [17]; a preregistered UK Biobank study of 13,608 adults gives r = .19 for fluid intelligence with height and socioeconomic status in the model [16].
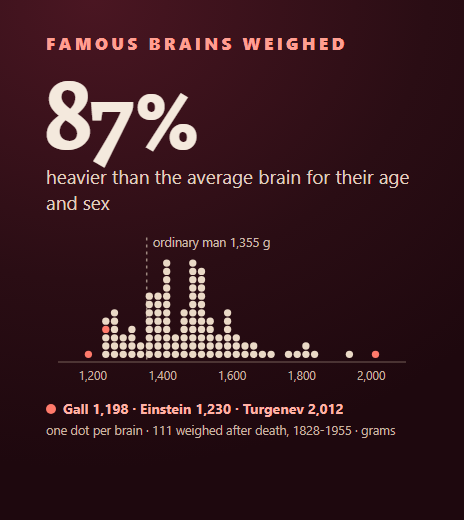
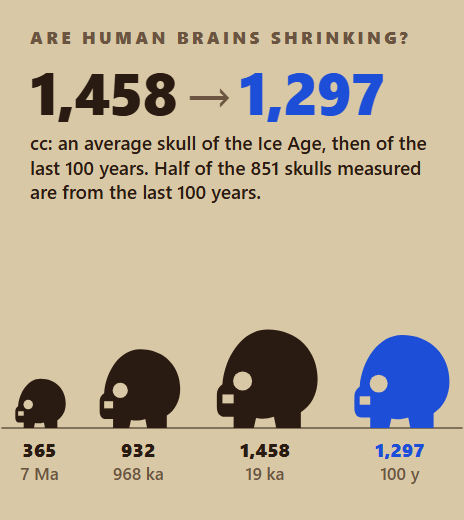
The link survives inside families, which rules out the simplest version of a family-background explanation: Lee and colleagues found that, among siblings in the HCP (1,022 people), the sibling with the larger brain tends to score higher, a correlation of .18 after correcting for measurement error [18]. The 2015 meta-analysis by Pietschnig and colleagues pooled 88 studies of more than 8,000 people, healthy and clinical, to r = .24 and reported that “strong and positive correlation coefficients have been reported frequently” while small ones were often left out [27]. Our news article on what a correlation of 0.24 means and our study of famous brains weighed after death show why a heavy brain is not a sign of genius; brain size has also changed over human evolution, as our study of whether human brains are shrinking shows.
One brain-structure result runs the other way: in 198 healthy American children and adolescents, a larger corpus callosum (the band of fibres between the hemispheres) went with slightly lower IQ once total brain size was taken into account (r = -.147) [9]. In 107 community-dwelling adults aged 75-81, whole brain volume correlated r = .21 with a g factor, but the link nearly vanished (.03) once intracranial area, an estimate of the brain’s largest size earlier in life, was taken into account [10].
07 Which kind of brain scan is most linked to IQ?
Task fMRI and combined models report the strongest links (median r = .53 and .44), brain volume the weakest (.20), with white matter (.35), the cortex (.31) and resting connectivity (.38) between them. The groups are small, two to seven results each, and they differ in method: almost every volume result is a same-sample correlation, while almost every connectivity and task result is a model tested on unseen people, so the comparison mixes brain measure and method.
Brain volume shows the weakest links; combined and task scans the strongest
One dot per result; box = middle half, whiskers = lowest and highest. Median r: brain volume .20 (4 results), cortex .31 (2), white matter .35 (3), resting connectivity .38 (5), task fMRI .53 (2), several measures together .44 (7). Groups of 2-7 results: read the dots, not the boxes. As of 11 November 2026.
Reported r.
Source: Our ledger; quartiles by IQ Metrics
Data table
| brain measure | n | low | q1 | median | q3 | high |
|---|---|---|---|---|---|---|
| Brain volume | 4 | 0.2 | 0.2 | 0.2 | 0.2 | 0.3 |
| Cortex thickness or area | 2 | 0.2 | 0.3 | 0.3 | 0.4 | 0.4 |
| White matter | 3 | -0.1 | 0.1 | 0.4 | 0.4 | 0.4 |
| Resting connectivity | 5 | 0.3 | 0.4 | 0.4 | 0.4 | 0.4 |
| Task fMRI | 2 | 0.5 | 0.5 | 0.5 | 0.5 | 0.6 |
| Several measures together | 7 | 0.2 | 0.3 | 0.4 | 0.6 | 0.7 |
Embed this chart
Paste this HTML into your page: it carries the numbers and the credit link to this figure.
Task scans do well partly because the tasks themselves are tests: Sripada and colleagues predicted general cognitive ability at r = .50 from the brain’s response to a working-memory task in 967 HCP adults [19], and Marek and colleagues note that task-fMRI links with cognitive ability shrink once performance on the scanner task is taken out [21]. Combining many kinds of scan helps: in 10,754 ABCD children, Wang and colleagues reached r = .54 with 45 kinds of MRI together, and the same children’s family and environment factors alone reached r = .49 [25]. In 11,876 ABCD children, grey matter and white matter together accounted for 19.0% of differences in cognitive performance, more than either alone [23].
Median r by brain measure and sample size
Median reported r per cell; empty = no result. Counts: brain volume 1 and 3; cortex thickness or area 0 and 2; white matter 2 and 1; resting connectivity 2 and 3; task fmri 2 and 0; several measures together 4 and 3. No result in the ledger has fewer than 100 people: the classic small studies print no r we could read. As of 11 November 2026.
Source: Our ledger; medians by IQ Metrics
Data table
| brain measure | 100-999 people | 1,000 or more |
|---|---|---|
| Brain volume | 0.2 | 0.2 |
| Cortex thickness or area | 0.3 | |
| White matter | 0.1 | 0.4 |
| Resting connectivity | 0.4 | 0.4 |
| Task fMRI | 0.5 | |
| Several measures together | 0.5 | 0.4 |
Embed this chart
Paste this HTML into your page: it carries the numbers and the credit link to this figure.
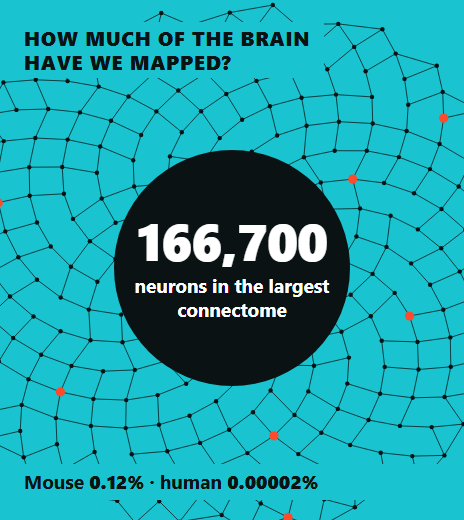
Whole-brain summaries do worst. In Molloy and colleagues’ study of 5,937 ABCD children (Cerebral Cortex, 2025), whole-brain graph measures such as global efficiency and small-worldness “fail to exhibit meaningful relationships” with general cognitive ability, while measures of single brain regions do, a result repeated in 847 HCP adults [4]. We did not make it a row because its abstract prints no r and we could not open its text. Our study of how much of the brain has been mapped explains what a connectome is, and our news article on what MRI scans of gifted children show covers the smaller studies of high scorers.
08 Can an MRI predict intelligence in people it has never seen?
Partly: 13 results test a brain model on people it was not built on, with a median r = .42, which is about 18% of the differences in scores; the 7 same-sample correlations have a median of .21, mostly for brain volume. Even the best-tested models miss individuals widely: Hilger and colleagues, predicting IQ from grey matter in 308 adults, found errors of more than ten IQ points and predictions that “varied closely around the sample mean” [7].
The field moved from same-sample correlations to tests on unseen people
Results in the ledger by publication period and analysis. 9 of the 12 results from 2021-2026 test the model on people it was not trained on; the other 3 do not say in the abstract. Testing on unseen people is the stricter check, but it is not a test on a new population unless the sample is new (2 results). As of 11 November 2026.
Source: Our ledger
Data table
| period | Same-sample correlation | Tested on unseen people | Not stated in the abstract | total |
|---|---|---|---|---|
| 2008-2015 | 3 | 1 | 4 | |
| 2016-2020 | 4 | 3 | 7 | |
| 2021-2026 | 9 | 3 | 12 |
Embed this chart
Paste this HTML into your page: it carries the numbers and the credit link to this figure.
Testing on unseen people is not the same as testing on a new population. Most out-of-sample results split one dataset (HCP or ABCD) into training and test parts; only two use a separate sample: Popp’s model fell from r = .25 to .19 on a new sample of 567 people [24], and Choi’s explained 50% of IQ differences in an independent sample whose size the abstract does not give [11]. Vieira’s review found that “small sample sizes” and untreated confounders, including kinship, were common risks of bias in this literature [28].
09 Do family income and neighbourhood explain the link between brain scans and IQ?
Partly: in the one study that prints both numbers, adjusting for the social and economic opportunity of the child’s neighbourhood cut the link between children’s brain scans and IQ scores by 30 to 40%, the paper’s own figure (resting connectivity r = .36 to .23, cortical thickness r = .23 to .13). Family income and parental education, used the same way, weakened the brain-IQ models less than the neighbourhood measure did. Marek and colleagues (Science, June 2026) analysed 4,579 ABCD children aged 9-10 from 11,878 enrolled, building models on 2,316 and testing them on 2,263 [26].
Adjusting for neighbourhood opportunity cut the brain-IQ link by 30 to 40%
Marek and colleagues (Science, 2026), ABCD Study children aged 9-10: out-of-sample r between brain-based predictions and IQ scores (NIH Toolbox total), trained on 2,316 children and tested on 2,263, before and after adjusting for the social and economic domain of the Child Opportunity Index. Resting connectivity .36 to .23; cortical thickness .23 to .13; the paper reports a reduction of 30 to 40%. The only ledger study that prints both numbers. As of 11 November 2026.
Out-of-sample r with IQ scores
Source: Marek et al. 2026 [26]; drop in % by IQ Metrics
Data table
| brain measure | After adjusting for SES | Before |
|---|---|---|
| Connectivity | 0.2 | 0.4 |
| Thickness | 0.1 | 0.2 |
Embed this chart
Paste this HTML into your page: it carries the numbers and the credit link to this figure.
Of 649 measures of children’s lives, the one most strongly linked to brain connectivity was the social and economic opportunity of the child’s neighbourhood (r = .24 for the strongest single connection, against .16 for IQ scores) [26]. Adjusting for it weakened 95% of the single brain-IQ links, and about 70% were no longer statistically significant. The authors also report that brain-IQ models trained only on children from better-off neighbourhoods failed, and conclude that the link is consistent with “confounding by socioeconomics”. The paper reports a reduction, not a disappearance: the adjusted link (r = .23) is still there.
4 of 23 results take family circumstances into account
One square per result, coloured by whether the model behind the printed r adjusts for family income, an SES index, parental education or neighbourhood, or uses a within-family design. 4 results from 3 papers do; only Marek 2026 prints the r both ways (2 results). As of 11 November 2026.
23 resultsone square = one result
Source: Our ledger; flags read from each paper [16] [18] [26]
Data table
| result | group | label | detail |
|---|---|---|---|
| marek2026ct | Before and after printed | Marek 2026 (thickness) | Marek 2026 (thickness): Before and after printed |
| marek2026rs | Before and after printed | Marek 2026 (RSFC) | Marek 2026 (RSFC): Before and after printed |
| nave2019 | Adjusted only | Nave 2018 | Nave 2018: Adjusted only |
| lee2019 | Adjusted only | Lee 2019 | Lee 2019: Adjusted only |
| choi2008 | Not adjusted for family circumstances | Choi 2008 | Choi 2008: Not adjusted for family circumstances |
| shenkin2009 | Not adjusted for family circumstances | Shenkin 2009 | Shenkin 2009: Not adjusted for family circumstances |
| ganjavi2011 | Not adjusted for family circumstances | Ganjavi 2011 | Ganjavi 2011: Not adjusted for family circumstances |
| ritchie2015 | Not adjusted for family circumstances | Ritchie 2015 | Ritchie 2015: Not adjusted for family circumstances |
| hearne2016 | Not adjusted for family circumstances | Hearne 2016 | Hearne 2016: Not adjusted for family circumstances |
| alnaes2018 | Not adjusted for family circumstances | Alnaes 2018 | Alnaes 2018: Not adjusted for family circumstances |
| dubois2018 | Not adjusted for family circumstances | Dubois 2018 | Dubois 2018: Not adjusted for family circumstances |
| cox2019 | Not adjusted for family circumstances | Cox 2019 | Cox 2019: Not adjusted for family circumstances |
| sripada2020 | Not adjusted for family circumstances | Sripada 2020 | Sripada 2020: Not adjusted for family circumstances |
| sripada2021 | Not adjusted for family circumstances | Sripada 2021 | Sripada 2021: Not adjusted for family circumstances |
| marek2022 | Not adjusted for family circumstances | Marek 2022 | Marek 2022: Not adjusted for family circumstances |
| tetereva2022 | Not adjusted for family circumstances | Tetereva 2022 | Tetereva 2022: Not adjusted for family circumstances |
| tetereva2022t | Not adjusted for family circumstances | Tetereva 2022 (tasks) | Tetereva 2022 (tasks): Not adjusted for family circumstances |
| michel2024 | Not adjusted for family circumstances | Michel 2024 | Michel 2024: Not adjusted for family circumstances |
| michel2024g | Not adjusted for family circumstances | Michel 2024 (grey) | Michel 2024 (grey): Not adjusted for family circumstances |
| michel2024w | Not adjusted for family circumstances | Michel 2024 (white) | Michel 2024 (white): Not adjusted for family circumstances |
| popp2024 | Not adjusted for family circumstances | Popp 2024 | Popp 2024: Not adjusted for family circumstances |
| popp2024x | Not adjusted for family circumstances | Popp 2024 (new sample) | Popp 2024 (new sample): Not adjusted for family circumstances |
| wang2025 | Not adjusted for family circumstances | Wang 2025 | Wang 2025: Not adjusted for family circumstances |
Embed this chart
Paste this HTML into your page: it carries the numbers and the credit link to this figure.
Only 4 of 23 results (3 papers) in our ledger take family circumstances into account at all: the UK Biobank brain-size study, with socioeconomic status in its model [16], the sibling study, where a within-family design holds the family constant [18], and the 2026 ABCD study. Most prediction studies adjust for age, sex, head motion or brain size but not for income, so their r may include the part of the link that runs through family circumstances. Sripada and colleagues found in 5,937 ABCD children that brain connectivity patterns linked to cognitive ability “significantly statistically mediated” the effect of SES, an analysis that treats the brain as a path, not a confounder [20].
10 How much of the difference in IQ scores can a brain scan explain?
About 12% in the biggest studies (median r = .35 across 12 results of 1,000 or more people), from 4% for total brain volume to 29% for the best combined model (r = .54 in 10,754 ABCD children) [25]. Squaring r converts it into the share of the spread in test scores that the brain measure accounts for, in that sample: r = .275 in 18,363 UK Biobank adults is 7.6% [17], and the 2026 ABCD cortical-thickness result after SES adjustment, r = .13, is 1.7% [26].
The rest, the large majority, is everything a scan does not capture: the parts of thinking that no current scanner resolves, the test’s own measurement error, and the person’s experience, schooling and circumstances on the day. A share of differences is a statement about a population; it does not mean that 12% of any one person’s IQ “comes from” the brain region measured. The same caution applies to the popular brain claims checked in our brain statistics fact-check, the myths in left brain, right brain and five other myths about intelligence and our news article on what brain scans actually show.
11 What does this mean, and what does it not?
Brain MRI and intelligence scores are linked, modestly and reliably, in large healthy samples; the link is a correlation, not a cause, and part of it runs through family circumstances. None of the 23 results shows that a scan can read one person’s intelligence, and none supports sorting people into kinds of brain by intelligence. Where a model was tried on a new sample, its r fell (.25 to .19) [24].
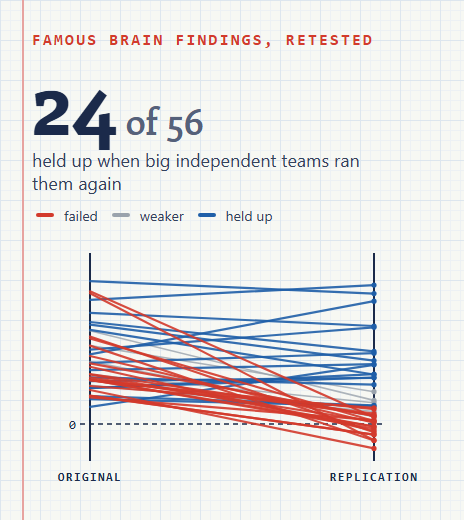
Replication is the test that matters here, as in our replication scorecard of famous psychology findings: the biobank-era studies are the replications of the small early ones, and they report smaller, steadier numbers for brain volume. For what intelligence covers beyond a test score, see whether intelligence is limited to IQ and human brain facts; to exercise working memory and attention, try our brain games.
A scan cannot give your IQ. A test is how IQ is measured.
Our IQ test measures pattern reasoning and compares your result with adults, with a percentile.
Take the IQ test12 Every result in our ledger
Every result in our ledger (23 rows from 18 papers)
Largest sample first. * = r from a printed R squared or share of variance (square root; IQ Metrics calculation). Share = r squared x 100 (IQ Metrics calculation). SES = whether the model behind the printed r adjusts for family circumstances. The CSV adds journal, DOI, intervals and licences. As of 11 November 2026.
| Cox 2019 [17] | 2019 | UK Biobank | 44-81 | 18,363 | Brain volume | Same-sample correlation | .28 | 7.6% | No | – | Total brain volume with a latent g factor, age- and sex-corrected |
| Nave 2018 [16] | 2018 | UK Biobank | adults | 13,608 | Brain volume | Same-sample correlation | .19 | 3.6% | Adjusted | – | Preregistered; total brain volume with fluid intelligence; SES in the model, no unadjusted r printed in the abstract |
| Michel 2024 [23] | 2024 | ABCD Study | about 10 | 11,876 | Several measures together | Not stated in the abstract | .44 * | 19.0% | No | – | Grey plus white matter structure, regularised structural equation models |
| Michel 2024 (grey) [23] | 2024 | ABCD Study | about 10 | 11,876 | Cortex thickness or area | Not stated in the abstract | .39 * | 15.4% | No | – | Grey matter volume, thickness and surface area together |
| Michel 2024 (white) [23] | 2024 | ABCD Study | about 10 | 11,876 | White matter | Not stated in the abstract | .35 * | 12.4% | No | – | White matter volume, FA and MD |
| Wang 2025 [25] | 2025 | ABCD Study | 9-10 | 10,754 | Several measures together | Tested on unseen people | .54 | 29.2% | No | – | 45 kinds of MRI stacked; environment (incl. family income) modelled separately (r = .49) |
| Sripada 2021 [20] | 2021 | ABCD Study | 9-10 | 5,937 | Resting connectivity | Tested on unseen people | .42 * | 18.0% | No | – | Leave-one-site-out; printed as cross-validated partial eta squared |
| Marek 2022 [21] | 2022 | ABCD Study | 9-10 | 3,604 | Resting connectivity | Tested on unseen people | .34 | 11.6% | No | – | Largest replicable multivariate association in the paper (univariate maximum r = 0.14) |
| Marek 2026 (RSFC) [26] | 2026 | ABCD Study | 9-10 | 2,263 | Resting connectivity | Tested on unseen people | .36 | 13.0% | Before and after | .23 | Ridge regression trained on 2,316 children, tested on 2,263; SES = Child Opportunity Index social and economic domain |
| Marek 2026 (thickness) [26] | 2026 | ABCD Study | 9-10 | 2,263 | Cortex thickness or area | Tested on unseen people | .23 | 5.3% | Before and after | .13 | Cortical thickness, same design |
| Popp 2024 [24] | 2024 | Human Connectome Project | young adults | 1,030 | Several measures together | Tested on unseen people | .25 | 6.2% | No | – | Structural-functional coupling (diffusion plus resting fMRI), cross-validated |
| Lee 2019 [18] | 2019 | Human Connectome Project (siblings) | young adults | 1,022 | Brain volume | Same-sample correlation | .18 | 3.2% | Adjusted | – | Within-family correlation (sibling differences), corrected for measurement error; a family design holds family income and upbringing constant |
| Sripada 2020 [19] | 2020 | Human Connectome Project | young adults | 967 | Task fMRI | Tested on unseen people | .50 | 25.0% | No | – | N-back 2-back vs 0-back contrast |
| Dubois 2018 [14] | 2018 | Human Connectome Project | young adults | 884 | Resting connectivity | Tested on unseen people | .45 * | 20.0% | No | – | Cross-validated; controlled for gender, age and brain volume |
| Tetereva 2022 [22] | 2022 | Human Connectome Project | young adults | 873 | Several measures together | Tested on unseen people | .57 | 32.5% | No | – | Stacked model of task fMRI, structural MRI and resting connectivity |
| Tetereva 2022 (tasks) [22] | 2022 | Human Connectome Project | young adults | 873 | Task fMRI | Tested on unseen people | .56 | 31.4% | No | – | Seven task fMRI scans stacked |
| Alnaes 2018 [15] | 2018 | Philadelphia Neurodevelopmental Cohort | 8-22 | 729 | White matter | Tested on unseen people | .39 | 15.2% | No | – | Diffusion MRI, 10-fold cross-validation; general cognitive factor |
| Ritchie 2015 [12] | 2015 | Lothian Birth Cohort 1936 | about 73 | 672 | Several measures together | Same-sample correlation | .42 * | 18.0% | No | – | Six structural measures together; the paper prints 18-21%: the lower end is used |
| Popp 2024 (new sample) [24] | 2024 | Independent sample (not named in the abstract) | adults | 567 | Several measures together | Tested on unseen people | .19 | 3.6% | No | – | Same model applied to a new sample |
| Hearne 2016 [13] | 2016 | Human Connectome Project | young adults | 317 | Resting connectivity | Same-sample correlation | .38 | 14.4% | No | – | Mean connectivity of the edges the same study picked; in-sample by design |
| Choi 2008 [11] | 2008 | Own sample (young adults) | young adults | 225 | Several measures together | Tested on unseen people | .71 * | 50.0% | No | – | Cortical thickness plus task fMRI during reasoning; regions chosen in the same study |
| Ganjavi 2011 [9] | 2011 | NIH MRI Study of Normal Brain Development | 6-18 | 198 | White matter | Same-sample correlation | -.15 | 2.2% | No | – | Corpus callosum midsagittal area, after correcting for total brain volume and age; the only negative link in the ledger |
| Shenkin 2009 [10] | 2009 | Own sample (community volunteers, Scotland) | 75-81 | 107 | Brain volume | Same-sample correlation | .21 | 4.4% | No | – | Whole brain volume with a g factor; falls to .03 after correcting for intracranial area |
Reviews and meta-analyses (kept apart, never pooled with the ledger)
These pool other studies, so they are not rows. Two well-known meta-analyses are listed without a number because their abstracts are withheld by the publisher in every index we can read and we could not open their texts.
| Review | Year | What it pools | Studies | People | Result | Note |
|---|---|---|---|---|---|---|
| Pietschnig et al. 2015 [27] | 2015 | Meta-analysis of brain volume and IQ | 88 | more than 8,000 | r = .24 | Pools healthy and clinical samples; reports that published effects declined over time and were overestimated |
| Vieira et al. 2022 [28] | 2022 | Systematic review of predicting intelligence from MRI with machine learning | 30 | – | r = .42 (95% CI .35 to .50) | Out-of-sample prediction studies only; search to 15 December 2020; fluid intelligence from a single test r = 0.15 (0.13-0.17) |
| McDaniel 2005 [29] | 2005 | Meta-analysis of in vivo brain volume and intelligence | – | – | Not read: no number | Abstract withheld by the publisher in OpenAlex and Semantic Scholar; full text not open: no number printed here |
| Gignac and Bates 2017 [30] | 2017 | Meta-analysis of brain volume and intelligence by test quality | – | – | Not read: no number | Abstract withheld by the publisher; the author copy refused our request (HTTP 403): no number printed here |
Source: Each review as cited; read by IQ Metrics
Records we read and left out (56) and why
Reasons follow data/INCLUSION-RULE.md, written before screening. Leaving a paper out says nothing about its quality: most were left out because the abstract prints no usable r, or because the sample is a patient group, which this ledger does not cover.
| Haier 1988 | Cortical glucose metabolic rate correlates of abstract reasoning and attention studied with positron emission tomography | PET, 1988: history only (timeline) |
| Willerman 1991 | In vivo brain size and intelligence | Classic small MRI study: no abstract online, n and r could not be read |
| Andreasen 1993 | Intelligence and brain structure in normal individuals | Classic small MRI study (n = 67): the abstract prints no r |
| Posthuma 2003 | Genetic Correlations Between Brain Volumes and the WAIS-III Dimensions of Verbal Comprehension, Working Memory, Perceptual Organization, and | Score is one WAIS-III dimension (working memory), not a general score |
| Peng 2004 | Diffusion tensor images in children with early-treated, chronic, malignant phenylketonuric: correlation with intelligence assessment | Patient group (phenylketonuria) |
| Witelson 2005 | Intelligence and brain size in 100 postmortem brains: sex, lateralization and age factors | Post-mortem brain weight, not MRI |
| Garde 2005 | Decline in intelligence is associated with progression in white matter hyperintensity volume | Outcome is decline in intelligence over time in older adults, not a score level |
| Hasan 2008 | Quantitative diffusion tensor imaging and intellectual outcomes in spina bifida | Patient group (spina bifida) |
| Rhein 2014 | Neuroanatomical Correlates of Intelligence in Healthy Young Adults: The Role of Basal Ganglia Volume | Only sex-split r for parts of a test; no r for a general score |
| Bódizs 2014 | Sleep spindling and fluid intelligence across adolescent development: sex matters | EEG (sleep spindles), not MRI |
| Ohtani 2014 | Medial Frontal White and Gray Matter Contributions to General Intelligence | n = 26: below the n >= 100 cut and not a classic named by the volume meta-analyses |
| Hai-b 2014 | Preliminary study of high resolution MR structural imaging of cerebral cortex in infants and correlated with intelligence development | Infants and young children; no general intelligence score in the abstract |
| Nestor 2015 | Attentional Control and Intelligence: MRI Orbital Frontal Gray Matter and Neuropsychological Correlates | Attentional-control tasks and regional grey matter; no r for a general score with n printed |
| Hernández 2015 | Brain iron deposits and lifespan cognitive ability | Brain iron in older people with lifespan cognitive change; not a general score link in a healthy sample |
| Luciano 2015 | Structural Brain MRI Trait Polygenic Score Prediction of Cognitive Abilities | Polygenic scores of brain traits, not a brain measurement |
| Finn 2015 | Functional connectome fingerprinting: identifying individuals using patterns of brain connectivity | No intelligence r in the abstract (fingerprinting paper; fluid intelligence result not read) |
| Basten 2015 | Where smart brains are different: A quantitative meta-analysis of functional and structural brain imaging studies on intelligence | Coordinate meta-analysis of brain regions; no r |
| Fu 2016 | Diffusion tensor imaging study in Duchenne muscular dystrophy | Patient group (Duchenne muscular dystrophy) |
| Greene 2018 | Task-induced brain state manipulation improves prediction of individual traits | Prints only bounds (over 20% and under 6%) for variance explained, no point estimate |
| Dubois 2018 | Resting-State Functional Brain Connectivity Best Predicts the Personality Dimension of Openness to Experience | Outcome is personality (openness), not intelligence |
| Shen 2018 | Resting-State Connectivity and Its Association With Cognitive Performance, Educational Attainment, and Household Income in the UK Biobank | Effect printed as standardised betas of single connections, not a correlation |
| Parham 2019 | Prediction of General Intelligence Using DTI Data | n not printed in the abstract; journal could not be checked |
| Lett 2019 | Cortical Surfaces Mediate the Relationship Between Polygenic Scores for Intelligence and General Intelligence | Variance explained is for polygenic scores, not for a brain measure |
| Schmitt 2019 | The genetics of cortical myelination in young adults and its relationships to cerebral surface area, cortical thickness, and intelligence: A | Genetics of cortical myelin; no brain-intelligence r |
| Kremen 2019 | Influence of young adult cognitive ability and additional education on later-life cognition | Education and later-life cognition; no brain-intelligence r |
| He 2019 | Deep neural networks and kernel regression achieve comparable accuracies for functional connectivity prediction of behavior and demographics | Abstract prints no r for fluid intelligence |
| Mihalik 2019 | ABCD Neurocognitive Prediction Challenge 2019: Predicting Individual Fluid Intelligence Scores from Structural MRI Using Probabilistic Segme | Challenge proceedings: no abstract we could read |
| Elliott 2019 | General functional connectivity: Shared features of resting-state and task fMRI drive reliable and heritable individual differences in funct | Abstract prints no r |
| Jiang 2019 | Gender Differences in Connectome-based Predictions of Individualized Intelligence Quotient and Sub-domain Scores | Abstract prints no r |
| Frith 2020 | Intelligence and creativity share a common cognitive and neural basis | Printed r is between intelligence and creativity, not brain and intelligence |
| Vanderwal 2020 | Stability and similarity of the pediatric connectome as developmental measures | Connectome stability as a developmental measure; no general intelligence r with n |
| Hilger 2020 | Predicting intelligence from brain gray matter volume | Abstract prints the error in IQ points, not r |
| Judd 2020 | Cognitive and brain development is independently influenced by socioeconomic status and polygenic scores for educational attainment | Outcome is working memory, not a general score |
| Serin 2021 | NBS-Predict: A prediction-based extension of the network-based statistic | Methods paper (also a schizophrenia sample); n for the intelligence result not in the abstract |
| Rasero 2021 | Integrating across neuroimaging modalities boosts prediction accuracy of cognitive ability | Abstract prints only the gain in variance explained (1% to 4%), not the prediction r |
| Wallert 2021 | Cognitive dedifferentiation as a function of cognitive impairment in the ADNI and MemClin cohorts | Cognitive impairment cohorts (ADNI) |
| Martins 2021 | Gray matter correlates of reading fluency deficits: SES matters, IQ does not | Outcome is reading fluency, not intelligence |
| Dadi 2021 | Population modeling with machine learning can enhance measures of mental health | Abstract prints no brain-only r |
| Feilong 2021 | The neural basis of intelligence in fine-grained cortical topographies | Prints a range across 360 brain regions, no single whole-brain r |
| Tian 2021 | Machine learning prediction of cognition from functional connectivity: Are feature weights reliable? | Prints a range (r = 0.2-0.4) across models, no single r |
| Thiele 2021 | Multitask brain network reconfiguration is inversely associated with human intelligence | Abstract prints no r |
| Wu 2022 | A multicohort geometric deep learning study of age dependent cortical and subcortical morphologic interactions for fluid intelligence predic | Deep-learning prediction across cohorts; the printed R is not for a general intelligence score with n |
| Muri 2022 | Cortical thickness and its relationship to cognitive performance and metabolic control in adults with phenylketonuria | Patient group (phenylketonuria) |
| Cecelja 2022 | Aortic Distensibility Measured by Automated Analysis of Magnetic Resonance Imaging Predicts Adverse Cardiovascular Events in UK Biobank | Aortic MRI, not the brain |
| Wei 2022 | Functional connectome of vicarious traumatization: detecting and helping individuals vulnerable to mental illness | Outcome is vicarious traumatization, not intelligence |
| Tong 2022 | Transdiagnostic connectome signatures from resting-state fMRI predict individual-level intellectual capacity | Transdiagnostic psychiatric sample |
| Ooi 2022 | Comparison of individualized behavioral predictions across anatomical, diffusion and functional connectivity MRI | Abstract prints no r for cognition and no open full text was found |
| Kristanto 2022 | What do neuroanatomical networks reveal about the ontology of human cognitive abilities? | Abstract prints no r |
| Kirkegaard 2023 | A Multimodal MRI-based Predictor of Intelligence and Its Relation to Race/Ethnicity | Race and ethnicity comparison: outside this ledger (no group comparisons of intelligence) |
| Voldsbekk 2023 | Shared pattern of impaired social communication and cognitive ability in the youth brain across diagnostic boundaries | Sample mixes diagnostic groups; social communication focus |
| Thiele 2023 | Multimodal Brain Signal Complexity Predicts Human Intelligence | EEG, not MRI |
| Fürtjes 2023 | General dimensions of human brain morphometry inferred from genome‐wide association data | Genome-wide data on brain morphometry; no brain-intelligence r |
| Joseph 2023 | Greater maltreatment severity is associated with smaller brain volume with implication for intellectual ability in young children | Sample selected for maltreatment |
| Hofmann 2025 | The utility of explainable AI for MRI analysis: Relating model predictions to neuroimaging features of the aging brain | Brain-age model; the printed r is not with intelligence |
| Molloy 2025 | Regional, but not brain-wide, graph theoretic measures are robustly and reproducibly linked to general cognitive ability | Whole-brain graph measures showed no meaningful link; abstract prints no r and no open full text found (text only) |
| Parham 2026 | Structural Connectivity of Brain Regions May Predict Human Intelligence | No DOI and no journal in the record; could not be checked |
Source: OpenAlex [1]; screening by IQ Metrics
13 How we built the dataset
- 01
Rule first
We wrote the inclusion rule (data/INCLUSION-RULE.md) on 11 November 2026 before screening: healthy samples, MRI, a general intelligence score, a printed r or R squared and a printed n; bands and brain-measure classes fixed in advance.
- 02
Search
12 OpenAlex title and abstract searches (2,208 unique records) and 27 named leads from the reviews, the brief and the news hooks. OpenAlex metadata is CC0 [1].
- 03
Screen
Scripted word rules kept 51 records that print a correlation; we read 78 records by hand (abstracts, plus the open full text in Europe PMC where the abstract printed no usable r [2]). Every decision and reason is in data/screen_decisions.tsv.
- 04
Check
Each typed value has a quote; a script found every quote in the cached abstract or text and every n, r, R squared and interval inside a quote (248 checks), and confirmed that no paper is flagged retracted in OpenAlex.
- 05
Compute
r from R squared (square root), bands, medians, quartiles, the share of score differences (r squared), Fisher-z intervals and rank correlations: all IQ Metrics calculations, scripted in data/analyse.py.
Read every number with these in mind
- The ledger is a lower bound: 23 results whose abstract or open text prints both n and r. Many studies print results only in figures or paywalled tables; “we found none” means none in what we could read.
- No result has fewer than 100 people, so the ledger cannot show the inflated small-study effects that Marek and colleagues demonstrate by resampling; those come from their paper, not from our rows.
- Results are not independent: several come from the same HCP or ABCD participants, and three from one ABCD paper.
- Methods differ (same-sample correlations, cross-validation, held-out sets, structural equation models), so medians mix kinds of evidence; we show every result rather than pool them.
- 7 results are converted from a printed share of variance (r = square root); one uses the low end of a printed range (18-21%); one is a within-family correlation corrected for measurement error.
- Intervals other than Cox 2019 are Fisher-z intervals from r and n; for prediction studies the true uncertainty is larger.
- Patient groups are out by design. Nothing here is medical advice, and no result describes a group’s or a person’s intelligence.
Sources
- OurResearch. OpenAlex works API: 12 title and abstract searches (2,208 unique records) and 37 named-lead look-ups; metadata, abstracts, citation counts and retraction flags. 2026. openalex.orgCC0: "Every record is released under a CC0 public-domain license" (help.openalex.org/hc/en-us/articles/24397762024087-Pricing); abstracts read by script and cited as facts
- EMBL-EBI. Europe PMC REST API: open-access full texts of four papers and one abstract. 2026. europepmc.org/RestfulWebServiceEach text keeps its article licence; facts cited only
- Allen Institute for AI. Semantic Scholar Graph API: abstract look-ups for four papers whose abstracts OpenAlex does not carry. 2026. api.semanticscholar.orgAPI terms; abstracts cited as facts only
- Cerebral Cortex. Molloy and Sripada (2025). Regional, but not brain-wide, graph theoretic measures are robustly and reproducibly linked to general cognitive ability. Cerebral Cortex (ABCD n = 5,937; HCP n = 847). 2025. doi.org/10.1093/cercor/bhaf074Publisher copyright: facts cited only (n, r, ages, dataset)
- Intelligence. Haier et al. (1988). Cortical glucose metabolic rate correlates of abstract reasoning and attention studied with positron emission tomography. Intelligence (history only). 1988. doi.org/10.1016/0160-2896(88)90016-5Publisher copyright: facts cited only (n, r, ages, dataset)
- bioRxiv. Vieira et al. (2021). Preprint of the systematic review (bioRxiv, posted 28 October 2021): search date and methods read from the text. 2021. doi.org/10.1101/2021.10.19.462649CC BY-ND 4.0 (preprint): facts cited only
- Brain Structure and Function. Hilger et al. (2020). Predicting intelligence from brain gray matter volume. Brain Structure and Function (n = 308; abstract read, no r printed). 2020. doi.org/10.1007/s00429-020-02113-7CC BY (article licence as recorded by OpenAlex); facts cited
- American Journal of Psychiatry. Andreasen et al. (1993). Intelligence and brain structure in normal individuals. American Journal of Psychiatry (67 volunteers; abstract prints no r). 1993. doi.org/10.1176/ajp.150.1.130Publisher copyright: facts cited only (n, r, ages, dataset)
- PLoS ONE. Ganjavi et al. (2011). PLoS ONE (NIH MRI Study of Normal Brain Development, n = 198). 2011. doi.org/10.1371/journal.pone.0019698CC BY (article licence as recorded by OpenAlex); facts cited
- BMC Geriatrics. Shenkin et al. (2009). BMC Geriatrics (Own sample (community volunteers, Scotland), n = 107). 2009. doi.org/10.1186/1471-2318-9-12CC BY (article licence as recorded by OpenAlex); facts cited
- Journal of Neuroscience. Choi et al. (2008). Journal of Neuroscience (Own sample (young adults), n = 225). 2008. doi.org/10.1523/jneurosci.3259-08.2008CC BY-NC-SA article licence: facts cited only, nothing reproduced
- Intelligence. Ritchie et al. (2015). Intelligence (Lothian Birth Cohort 1936, n = 672). 2015. doi.org/10.1016/j.intell.2015.05.001CC BY (article licence as recorded by OpenAlex); facts cited
- Scientific Reports. Hearne et al. (2016). Scientific Reports (Human Connectome Project, n = 317). 2016. doi.org/10.1038/srep32328CC BY (article licence as recorded by OpenAlex); facts cited
- Philosophical Transactions of the Royal Society B Biological Sciences. Dubois et al. (2018). Philosophical Transactions of the Royal Society B Biological Sciences (Human Connectome Project, n = 884). 2018. doi.org/10.1098/rstb.2017.0284Publisher copyright: facts cited only (n, r, ages, dataset)
- JAMA Psychiatry. Alnæs et al. (2018). JAMA Psychiatry (Philadelphia Neurodevelopmental Cohort, n = 729). 2018. doi.org/10.1001/jamapsychiatry.2017.4277Publisher copyright: facts cited only (n, r, ages, dataset)
- Intelligence. Cox et al. (2019). Intelligence (UK Biobank, n = 18,363). 2019. doi.org/10.1016/j.intell.2019.101376CC BY (article licence as recorded by OpenAlex); facts cited
- Intelligence. Lee et al. (2019). Intelligence (Human Connectome Project (siblings), n = 1,022). 2019. doi.org/10.1016/j.intell.2019.01.011Publisher copyright: facts cited only (n, r, ages, dataset)
- Human Brain Mapping. Sripada et al. (2020). Human Brain Mapping (Human Connectome Project, n = 967). 2020. doi.org/10.1002/hbm.25007CC BY (article licence as recorded by OpenAlex); facts cited
- Translational Psychiatry. Sripada et al. (2021). Translational Psychiatry (ABCD Study, n = 5,937). 2021. doi.org/10.1038/s41398-021-01704-0CC BY (article licence as recorded by OpenAlex); facts cited
- Nature. Marek et al. (2022). Nature (ABCD Study, n = 3,604). 2022. doi.org/10.1038/s41586-022-04492-9CC BY (article licence as recorded by OpenAlex); facts cited
- NeuroImage. Tetereva et al. (2022). NeuroImage (Human Connectome Project, n = 873). 2022. doi.org/10.1016/j.neuroimage.2022.119588CC BY-NC-ND article licence: facts cited only, nothing reproduced
- Journal of Neuroscience. Michel et al. (2024). Journal of Neuroscience (ABCD Study, n = 11,876). 2024. doi.org/10.1523/jneurosci.0465-23.2023CC BY (article licence as recorded by OpenAlex); facts cited
- NeuroImage. Popp et al. (2024). NeuroImage (Human Connectome Project, n = 1,030). 2024. doi.org/10.1016/j.neuroimage.2024.120563CC BY-NC-ND article licence: facts cited only, nothing reproduced
- eLife. Wang et al. (2025). eLife (ABCD Study, n = 10,754). 2025. doi.org/10.7554/elife.105537.3CC BY (article licence as recorded by OpenAlex); facts cited
- Science. Marek et al. (2026). Science (ABCD Study, n = 2,263). 2026. doi.org/10.1126/science.aee6213CC BY-NC article licence: facts cited only, nothing reproduced
- Neuroscience & Biobehavioral Reviews. Pietschnig et al. 2015. Meta-analysis of brain volume and IQ. Neuroscience & Biobehavioral Reviews. 2015. doi.org/10.1016/j.neubiorev.2015.09.017Publisher copyright: facts cited only
- Intelligence. Vieira et al. 2022. Systematic review of predicting intelligence from MRI with machine learning. Intelligence. 2022. doi.org/10.1016/j.intell.2022.101654Publisher copyright (journal version); facts cited only
- Intelligence. McDaniel 2005. Meta-analysis of in vivo brain volume and intelligence. Intelligence. 2005. doi.org/10.1016/j.intell.2004.11.005Publisher copyright: facts cited only
- Intelligence. Gignac and Bates 2017. Meta-analysis of brain volume and intelligence by test quality. Intelligence. 2017. doi.org/10.1016/j.intell.2017.06.004Publisher copyright: facts cited only
Version history
- 2026.1111 November 2026First release. Next update due May 2027 (searches re-run every six months; ABCD and UK Biobank papers appear monthly), sooner if a study in the ledger is corrected or retracted, or if a new study prints the brain-IQ link before and after family-income adjustment.
Leon Falkner, Data & Research Analyst. Leon owns the arithmetic on IQ Metrics: the percentile tables, the score converter and the figures in everyone else's drafts. On the research desk Leon pulls the data, builds each index and writes the method. More about Leon.
Questions
Can a brain scan show your IQ?
No. In the 12 largest published results (1,022 to 18,363 people), brain MRI links to intelligence scores at a median r = .35, about 12% of the differences between people. That describes groups; a scan cannot place one person on the IQ scale. IQ is measured with a test.
Does brain size correlate to intelligence?
Weakly. Total brain volume correlates with intelligence scores at r = .18 to .275 in the three largest volume studies (1,022 to 18,363 people), about 4% of score differences. A 2015 meta-analysis of 88 studies found r = .24 and evidence that published effects were inflated.
Can an MRI measure intelligence?
Not for an individual. MRI models tested on people they were not built on predict intelligence scores at a median r = .42 across 13 results, so errors of ten IQ points or more are normal. One study of 308 adults found predictions clustered around the average.
Does brain size affect IQ?
A larger brain goes with a slightly higher score on average, and the link holds between siblings in 1,022 young adults (r = .18 after correcting for measurement error). The authors read their genetic analyses as pointing to a causal effect; a correlation alone cannot show cause.
Does family income explain the link between the brain and IQ?
Partly. In a 2026 Science study of 4,579 ABCD children, adjusting for neighbourhood social and economic opportunity cut the brain-IQ link by 30 to 40%; family income and parental education weakened it less. A smaller link remained (r = .23 and .13).
What did the 2026 study of 12,000 children find?
Marek and colleagues started from 11,878 ABCD children and analysed 4,579 with brain scans. Socioeconomic measures had the strongest brain links of 649 measures, and adjusting for neighbourhood opportunity reduced the brain-IQ prediction from r = .36 to .23. It did not reduce it to zero.
Which part of the brain is linked to intelligence?
No single part. Studies find links spread across the frontal, parietal and temporal cortex, white matter tracts and connections between networks; a 2025 study of 5,937 children found whole-brain efficiency measures unrelated to ability while single-region measures were related. Task and combined scans report the strongest links (median r = .53 and .44).
Are bigger brains smarter?
On average, very slightly: total brain volume and fluid intelligence correlate at r = .19 in a preregistered study of 13,608 UK Biobank adults, about 4% of score differences. Many people with smaller brains score higher than people with larger ones.
How much of IQ can a brain scan explain?
About 12% of the differences in test scores in the biggest studies (median r = .35), from about 4% for brain volume to 29% for the best combined model. The rest reflects what scans miss, test error and life circumstances.
Why do small brain-imaging studies report stronger results?
Chance swings are larger in small samples, and studies with striking results are more likely to be published. Marek and colleagues showed in the ABCD Study that brain-behaviour links became stable only with about 2,000 people; our ledger has no result under 100 people.
Share it, cite it, download it
You may reuse everything on this page under CC BY 4.0: in articles, reports, lessons and posts. The one condition is credit to IQ Metrics with a link to this page.
Cite this study
Version 2026.11. Citing the version lets readers find the exact numbers.
Archived copy with a DOI: 10.5281/zenodo.24126068 (report PDF and data on Zenodo).
Falkner, L. (2026). Can a brain scan show your IQ? Every MRI study, sample size against result (Version 2026.11) [Data set]. IQ Metrics Research. https://iqmetrics.org/research/can-a-brain-scan-show-your-iq/ (DOI: 10.5281/zenodo.24126068)
Falkner, Leon. "Can a brain scan show your IQ? Every MRI study, sample size against result." IQ Metrics Research, 11 Nov. 2026, iqmetrics.org/research/can-a-brain-scan-show-your-iq/. DOI: 10.5281/zenodo.24126068.
Falkner, Leon. "Can a brain scan show your IQ? Every MRI study, sample size against result." IQ Metrics Research. November 11, 2026. https://iqmetrics.org/research/can-a-brain-scan-show-your-iq/. DOI: 10.5281/zenodo.24126068.
@misc{iqmetrics2026canabrainscanshowyouriq, author = {Falkner, Leon}, title = {Can a brain scan show your IQ? Every MRI study, sample size against result}, institution = {IQ Metrics}, year = {2026}, version = {2026.11}, doi = {10.5281/zenodo.24126068}, url = {https://iqmetrics.org/research/can-a-brain-scan-show-your-iq/} }
Source: Leon Falkner, "Can a brain scan show your IQ? Every MRI study, sample size against result." IQ Metrics Research, version 2026.11, https://iqmetrics.org/research/can-a-brain-scan-show-your-iq/ (DOI 10.5281/zenodo.24126068)
Embed the key numbers
Paste this into an article or post. It lists the main numbers and credits the source.
Get the data
One row per published result (23 rows, 18 papers): an MRI brain measure related to a general intelligence score in a healthy sample. Sample size, dataset, ages, brain-measure class, analysis type, r as printed or converted from R squared, the share of score differences (r squared), a 95% interval, whether family circumstances were adjusted for and the r after adjustment where printed. Empty = not printed in the text we could read.
| Column | What it holds |
|---|---|
row_id, study, first_author, year, journal, doi | Our id, first author and year, publication year (OpenAlex), journal and DOI |
dataset, ages, n, n_note | Sample (UK Biobank, ABCD, HCP, cohort or own sample), ages as printed, people behind the printed r, and what that n counts |
sample_size_band | <100, 100-999 or 1,000+ (fixed before computing) |
modality | Volume, Cortex (thickness, area), White matter, Resting FC, Task fMRI or Multimodal |
analysis | in-sample (same-sample correlation), out-of-sample (cross-validation or held-out sample) or not stated |
r_printed, r_squared_printed | The effect as printed: a correlation, or a share of variance explained |
r_used, r_from_r_squared_iqm_calc | r used on the page; yes = square root of the printed share (IQ Metrics calculation) |
share_of_score_differences_pct_iqm_calc | r squared x 100 (IQ Metrics calculation) |
ci_low, ci_high, ci_source | 95% interval: printed, or Fisher z from r and n (IQ Metrics calculation) |
ses_controlled, r_after_ses_control | Whether the model adjusts for family income, SES, parental education, neighbourhood or uses a within-family design; r after adjustment where both are printed |
note, paper_licence_openalex | Our note; the article licence recorded by OpenAlex (facts only are cited) |
For journalists, researchers and teachers
Everything on this page may be quoted, charted and republished with credit. No embargo, no permission needed, no sign-up. If you need a number that is not here, ask.
Summary you can paste
Plain news style. Edit freely; keep the credit.
IQ Metrics Research built a ledger of 23 published results (18 papers, 2008-2026) relating brain MRI to a general intelligence score in healthy samples, with sample size, method and whether family circumstances were taken into account. In the 12 results with 1,000 or more people, the median correlation is r = .35: the scan accounts for about 12% of the differences in scores, total brain volume about 4%. Only 4 results adjust for family circumstances; in the one study that prints both, adjusting for neighbourhood opportunity cut the link by 30 to 40% (the paper's figure). Source: IQ Metrics Research, https://iqmetrics.org/research/can-a-brain-scan-show-your-iq/
Angles for a story
- A scan accounts for about 12% of score differences in the biggest studies (Figure 12)
- The 2026 ABCD study: neighbourhood opportunity cut the brain-IQ link by 30 to 40%, not to zero (Figure 10)
- Brain size and intelligence: r = .18 to .275 in samples of 1,022 to 18,363 (the section)
- Only 4 of 23 results adjust for family income or background (Figure 11)
- Sample size against result, every study on one chart (Figure 3)
Quotes you can use
Attributable as written, with the name and title. For a different angle or a quote on a specific figure, ask through the contact page.
A correlation of about .35 between a scan and a test score is real and it replicates. It is also far too weak to read anyone’s IQ off a brain image, and nobody in these studies claims it is.
Leon Falkner, Data & Research Analyst, IQ Metrics ResearchOnly four of the twenty-three results take family circumstances into account. The one study that shows the number both ways finds the link drops by a third or more.
Leon Falkner, Data & Research Analyst, IQ Metrics ResearchBrain size is the oldest idea in this field and it explains the least: about four per cent of the differences in scores in the largest samples.
Leon Falkner, Data & Research Analyst, IQ Metrics Research
Files
- CSV of every result: study, year, journal, DOI, dataset, ages, n, brain measure, analysis, r as printed, r used, share of score differences, interval, SES flag, r after SES, licence (CC BY 4.0)
- Every figure as a print-ready PNG: use the Image button under each figure
- Embed code and data table under every figure
- Share images for social media in three sizes, with the credit line built in
- Citations in APA, MLA, Chicago, BibTeX and plain text
Terms, contact and corrections
Credit: “IQ Metrics Research, Can a brain scan show your IQ? (2026)” with a link to this page. On air or in print, “IQ Metrics” and the page address are enough.
What it covers: published MRI studies of healthy samples that print a sample size and a correlation (or R squared) with a general intelligence score; reviews are listed apart; patient groups are out of scope.
Contact: the research team, through the contact page. Corrections are made on this page with a dated note in the version history.