





What Does an IQ of 105 Mean? Is It Good, Above Average or High?
An IQ of 105 is slightly above average: the 63rd percentile on the standard scale, labelled Average on the major test charts, with High Average starting at 110. See how accurate a 105 is, what practice and old norms do to it, and what it says about jobs and college.

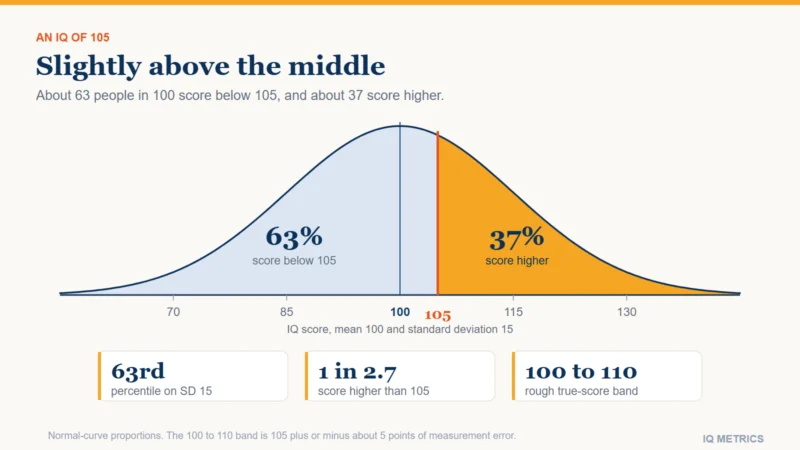
An IQ of 105 is slightly above average: on the standard scale (mean 100, standard deviation 15) it is the 63rd percentile, so about 63% of people score lower and about 37% score higher. It sits inside the Average band on the main test charts, five points short of High Average, which starts at 110. A 105 is one third of a standard deviation above the mean, a smaller gap than the measurement error of a single test. This guide shows where 105 falls on the bell curve, whether it is good, how accurate a reported 105 is, what practice and old norms do to it, and what it does and does not say about jobs, college and age.
- Percentile: 63rd on a standard deviation 15 scale (62nd on SD 16, 58th on SD 24; our normal-curve arithmetic).
- Label: Average on the WISC-V and Stanford-Binet 5 (90 to 109) and on the Woodcock-Johnson (90 to 110). High Average starts at 110.
- Distance from average: five points, one third of a standard deviation.
- Accuracy: read a reported 105 as roughly 100 to 110.
- Old norms: at the Flynn-effect rate of 0.28 points a year, five points is about 18 years of drift (Pietschnig and Voracek, 2015).
- Jobs: no job has an IQ requirement. The 1945 occupation data on our site shows wide overlap between jobs.
The figure shades the 63% of people who score below 105; 37% score higher. Our guides to an IQ of 100, an IQ of 97, an IQ of 110 and an IQ of 115 cover the scores around it, and an IQ of 95 is the mirror image on the low side.
What percentile is an IQ of 105?
The 63rd on the usual scale. The table places the scores around it on the same curve, and our IQ percentile calculator does the same for any score. For the whole curve, see the IQ bell curve. A percentile is a position within a norm sample of people, which is also why animals have no IQ score; our guide to horse IQ shows what researchers measure instead.
| IQ score | Scoring at or below | Scoring higher | Rarity of scoring higher |
|---|---|---|---|
| 100 | 50.0% | 50.0% | 1 in 2.0 |
| 102 | 55.3% | 44.7% | 1 in 2.2 |
| 105 | 63.1% | 36.9% | 1 in 2.7 |
| 108 | 70.3% | 29.7% | 1 in 3.4 |
| 110 | 74.8% | 25.2% | 1 in 4.0 |
| 115 | 84.1% | 15.9% | 1 in 6.3 |
The printed number depends on the scale. Most modern tests use a standard deviation of 15, older Stanford-Binet editions used 16 and the Cattell scales use 24, so the same printed 105 lands at a different percentile on each. The spread is the reason: on a wider scale, five points are fewer standard deviations. Our explainer on standard deviation 15 versus 16 walks through the arithmetic, and the IQ score converter moves a score between scales.
| Scale | Percentile of a printed 105 | Share scoring higher |
|---|---|---|
| Standard deviation 15 (Wechsler, current Stanford-Binet) | 63.1% | 36.9% |
| Standard deviation 16 (older Stanford-Binet, some school tests) | 62.3% | 37.7% |
| Standard deviation 24 (Cattell) | 58.3% | 41.7% |
Is an IQ of 105 good, above average or high?
It is above the mean by five points and average by label. The table shows where 105 falls on the charts we cover and what sits on either side.
| Chart | Band that contains 105 | Band above it | Band below it |
|---|---|---|---|
| WISC-V (Wechsler, children) | 90 to 109: Average | 110 to 119: High Average | 80 to 89: Low Average |
| Stanford-Binet 5 | 90 to 109: Average | 110 to 119: High average | 80 to 89: Low average |
| Woodcock-Johnson | 90 to 110: Average | 111 to 120: High Average | 80 to 89: Low Average |
| Our simplified IQ ranges guide | 100 to 115: high average (inside the 85 to 115 average range) | 115 to 130: above average | 85 to 99: low average |
A gap of five points is one third of a standard deviation, between what researchers call a small (0.2) and a medium (0.5) effect in Cohen’s rule of thumb. It is real on a population average and small for any single person. Whether it is “good” depends on what the score is for. It is as good as the typical person’s and a little better, enough for ordinary school, work and daily life. It falls short of a selective cut-off such as the top 2% that societies like Mensa use, which is a score of about 130 (see Mensa IQ score requirements), and it says nothing about creativity, persistence or character. The band tables are in our guides to WISC-V scores, the Stanford-Binet and the Woodcock-Johnson, and the simplified ranges are in IQ ranges and IQ classifications.
How accurate is a reported IQ of 105?
Within a few points either way. Every test has a standard error of measurement: a person’s observed score is their true score plus chance. Our guide to what makes an IQ test reliable lists the standard errors of the main Wechsler batteries. A simple 95% band is the score plus or minus 1.96 times the standard error.
| Test | Standard error (points) | 95% band around 105 |
|---|---|---|
| WAIS-IV full-scale IQ | 2.1 | 100.9 to 109.1 |
| WISC-V full-scale IQ | 2.9 | 99.3 to 110.7 |
| WAIS-5 full-scale IQ | 3.0 | 99.1 to 110.9 |
The bands run from about 99 to 111 on the least precise of the three. A 100 and a 105 on the same test therefore overlap, and the same person tested twice can land on either side of the line at 110 that separates Average from High Average. A reported 105 is best read as “roughly 100 to 110”. Our piece on IQ score margin of error works through the idea.
Does a 105 survive a retest, practice or new norms?
Partly. Three things move a 105 without any change in the person. First, regression to the mean: an observed score above 100 is more likely to have had some luck in it, so the expected score on a second test is 100 plus the correlation between the tests times the five points above 100. Adult rank order is stable at about .76 across five years rather than perfect (Breit and colleagues, 2024). Our page on regression to the mean explains the effect.
| Correlation between the two tests | Expected second score |
|---|---|
| 0.96 | 104.8 |
| 0.90 | 104.5 |
| 0.80 | 104.0 |
| 0.76 | 103.8 |
Second, practice. Retesting raises cognitive test scores by about .26 standard deviations, roughly 4 points, and more with coaching (Hausknecht and colleagues, 2007). A 105 earned on the second sitting of the same test may owe about four points to practice, which would put the unpractised score near 101.
Third, the age of the norms. Raw performance on IQ tests rose by about 0.28 points a year in a meta-analysis of 271 samples from 1909 to 2013, and the gains have slowed in recent decades (Pietschnig and Voracek, 2015). As an illustration only, assume the old rate: five points is about 18 years of drift, so a 105 on norms that old would be near 100 on fresh ones. Publishers re-norm their tests to stop this; see why IQ norms expire.
| Age of the norms | Drift (points) | 105 on fresh norms |
|---|---|---|
| 5 years | 1.4 | 103.6 |
| 10 years | 2.8 | 102.2 |
| 15 years | 4.2 | 100.8 |
| 20 years | 5.6 | 99.4 |
Where would your own score land?
Take the IIF-certified assessment and get your score with the scale it was measured on, the percentile it corresponds to and the confidence range around it — the three figures most online tests leave out.
Find your IQ score now! →What jobs fit an IQ of 105?
Many, because no job has an IQ requirement and the averages of jobs overlap. The widely shared “IQ by profession” charts trace to one 1945 study of 18,782 white male Army Air Force enlisted men by Harrell and Harrell, scored on the Army General Classification Test (AGCT), which used a standard deviation of 20, not 15. Our guide to average IQ by occupation gives the table and its limits. Converting a modern 105 (z = 0.33) to the AGCT scale gives about 107, which lands among the skilled trades in that table.
| Civilian occupation | Mean AGCT score |
|---|---|
| Salesman | 115.1 |
| Machinist | 110.1 |
| Electrician | 109.0 |
| A modern IQ of 105, converted to the AGCT scale | 106.7 |
| Carpenter, construction | 102.1 |
| Auto mechanic | 101.3 |
| Laborer | 95.8 |
Two cautions. These are 80-year-old means for one branch of one army, not modern IQs, and the spread within each job is wide: in the original table laborers ranged from 26 to 145 and accountants from 94 to 157. The pattern that does hold up is a group-level one: a major review found general mental ability correlates about .65 with the occupational level people reach (Schmidt and Hunter, 2004). That describes averages across thousands of workers. It does not say that a person with 105 cannot do a job, or that a person with 125 will.
Is an IQ of 105 enough for college?
IQ is not an entry requirement. Admission rests on grades, entrance exams and other records, and a 105 is above the population average. Across longitudinal studies, IQ correlates about .56 with the education people reach (Strenze, 2007), so higher scores tend to go with longer schooling in groups, with large exceptions. The figure of 115 that circulates as the “average IQ of college students” is examined in our piece on it. For how an entrance score maps onto this scale, see SAT score to IQ and does IQ predict school success.
Does an IQ of 105 mean the same at 14, 15 or 16?
Yes. A modern IQ compares a person only with people of the same age, so a 14-year-old with 105 and a 40-year-old with 105 both sit at the 63rd percentile of their own age group. Raw ability grows through childhood and the score stays anchored. The old ratio formula, mental age divided by chronological age times 100, gives a different style of answer for a child:
| Person | Mental age | In years and months |
|---|---|---|
| 10-year-old | 10.5 years | 10 years 6 months |
| 14-year-old | 14.7 years | 14 years 8 months |
| 15-year-old | 15.75 years | 15 years 9 months |
| Adult (divisor capped at 16 years) | 16.8 years | 16 years 10 months |
The ratio method is obsolete and the adult cap is a convention; our guides to IQ and mental age and deviation IQ versus ratio IQ explain why. For how raw performance changes with age, see IQ and age.
Quick answers about an IQ of 105
- Is 105 IQ good? It is slightly above average: the 63rd percentile and the Average band on every major chart.
- Is 105 IQ above average? Yes, by five points, one third of a standard deviation.
- What percentile is a 105 IQ? The 63rd on a standard deviation 15 scale, the 62nd on SD 16 and the 58th on SD 24.
- Is 105 IQ high? No. High Average starts at 110 on the Wechsler and Stanford-Binet charts.
- Is 105 IQ dumb or low? No. It is above the mean, and no test manual uses the word dumb.
- How accurate is a 105? Read it as roughly 100 to 110.
- What jobs does a 105 IQ fit? Any: jobs do not set IQ cut-offs, and the averages of different jobs overlap widely.
Sources
- Strenze, T. (2007): Intelligence and socioeconomic success: a meta-analytic review of longitudinal research, Intelligence, 35(5), 401-426.
- Pietschnig, J. and Voracek, M. (2015): One century of global IQ gains: a formal meta-analysis of the Flynn effect (1909-2013), Perspectives on Psychological Science, 10(3), 282-306.
- Breit, M., Scherrer, V., Tucker-Drob, E.M. and Preckel, F. (2024): The stability of cognitive abilities: a meta-analytic review of longitudinal studies, Psychological Bulletin, 150(4), 399-439.
- Hausknecht, J.P., Halpert, J.A., Di Paolo, N.T. and Moriarty Gerrard, M.O. (2007): Retesting in selection: a meta-analysis of coaching and practice effects for tests of cognitive ability, Journal of Applied Psychology, 92(2), 373-385.
- Schmidt, F.L. and Hunter, J. (2004): General mental ability in the world of work: occupational attainment and job performance, Journal of Personality and Social Psychology, 86(1), 162-173.
- Harrell, T.W. and Harrell, M.S. (1945): Army General Classification Test scores for civilian occupations, Educational and Psychological Measurement, 5, 229-239.
- Percentile and rarity figures are computed from the normal distribution. The bands, the standard errors and the AGCT table are those described in our own guides to WISC-V scores, the Stanford-Binet, the Woodcock-Johnson, test reliability and average IQ by occupation.
Keep reading
All articles →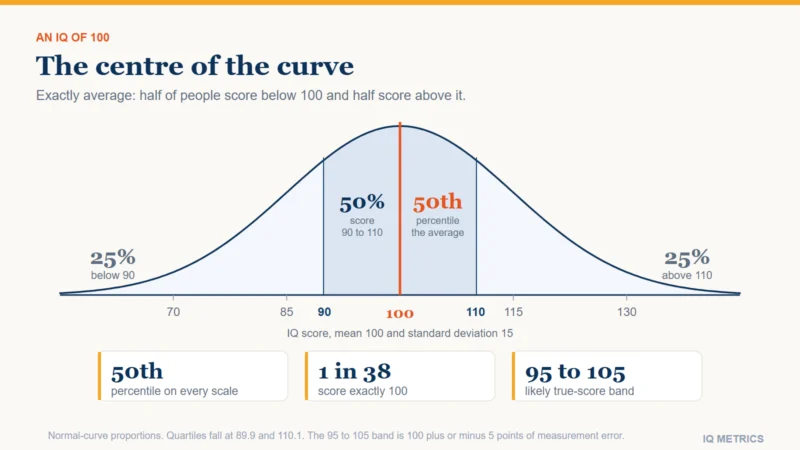 Scores & Scales
What Does an IQ of 100 Mean?
An IQ of 100 is the exact average: the 50th percentile on the standard scale, with half of people scoring below and half above. Major test charts label it Average. See why 100 is the average, whether it is good, how many people score it and what it predicts.
 Scores & Scales
What Does an IQ of 115 Mean?
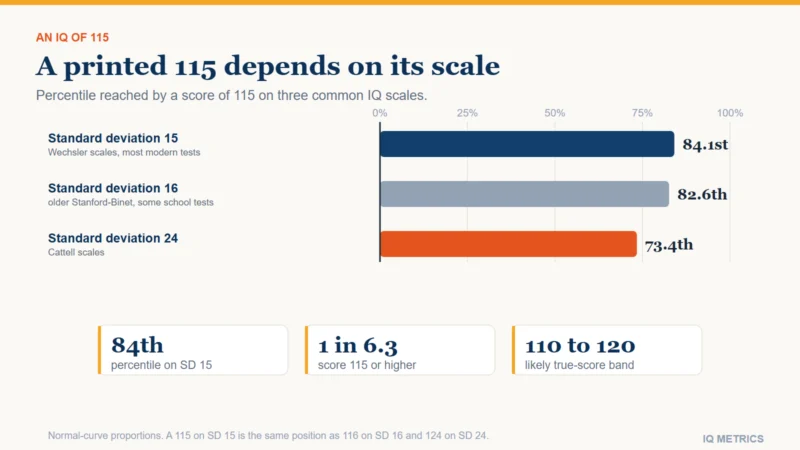
An IQ of 115 is one standard deviation above average: the 84th percentile, roughly 1 person in 6. It is High Average on the Wechsler children's scale and means the same at any age. See how accurate a single 115 is, why labels differ, and what a printed 115 means on other scales.
 Scores & Scales
What is Average IQ Test Score?
The average IQ test score is 100 by definition. About half of people score 90 to 109 and about 68% score 85 to 115. See the average range on each chart, why the average stays at 100, how scales differ and where to find averages for groups.