
Are human brains shrinking? Every measured skull, 7 million years
We matched three open datasets into one row per measured skull, from Sahelanthropus to today, and checked the claim that human brains shrank 3,000 years ago.

By Leon Falkner, Data & Research Analyst · Reviewed by Aarav Vardhan, Editor-in-Chief · Published 3 November 2026 · 12 min read
About this study
- Report type
- Data study from open published skull measurements
- Data
- 851 measured skulls matched from 1,918 rows in three files, 7 million years; 60 chimpanzee skulls
- Compared with
- Chimpanzees, Neanderthals and modern skulls; living adults by MRI
- As of
- 3 November 2026 (papers 2004-2026)
- Licence
- CC BY 4.0 (our dataset and charts)
- Version
- 2026.11
- Sources
- 18
Skulls from the last 100 years hold 161 cc less than skulls older than 11,700 years (1,297 against 1,458 cc), but whether that is a shrinking brain or a sampling effect is disputed. IQ Metrics Research matched 1,918 rows from three open files into 851 measured skulls spanning 7 million years. Volume is not intelligence. As of 3 November 2026.
01 Key findings
- Skulls dated to the last 100 years average 1,297 cc; skulls older than 11,700 years average 1,458 cc (161 cc apart; 95% interval 134 to 189). Both sides of the debate accept these two averages.DeSilva et al. 2023 file; IQ Metrics calculation
- Almost half the skulls (48.8%) are from the last 100 years, from seven collections; only 24 (2.8%) are older than 2 million years. The 2021 file had 58.7% in its last 100 years.IQ Metrics count from the three data files
- Without the last-100-year skulls, the Holocene average is 1,430 cc against 1,458 cc before it: 28 cc lower, but not clearly different from zero (95% interval -8 to +64).IQ Metrics calculation (Welch interval)
- The 70 skulls dated 4,200 to 100 years ago average 1,381 cc, 78 cc under the Pleistocene average (95% interval 33 to 122): a smaller but visible drop that comes before the last century.IQ Metrics calculation
- The break date is not stable: about 3,400 years ago on the 2021 file, about 760 on the revised file, each with a wide bootstrap interval. The 2022 critique found no significant break at all.IQ Metrics calculation, simple; Villmoare and Grabowski 2022
- Brains grew about 4.0x in 7 million years: 365 cc in Sahelanthropus, 440 cc in australopiths, 932 in Homo erectus, 1,388 in Neanderthals, 1,458 in Late Pleistocene H. sapiens.IQ Metrics calculation
- Volume is a weak guide to intelligence: across 88 studies the correlation is r = 0.24, about 6% of the differences between people, and a bigger Neanderthal average (1,388 cc) says nothing about how they thought.Pietschnig et al. 2015
- In living adults the trend points the other way: intracranial volume by MRI is 6.6% larger for those born in the 1970s than the 1930s (1,321 against 1,234 mL).DeCarli et al. 2024
02 Statistics to quote
Average skull volume of H. sapiens: older than 11,700 years (136 skulls) against the last 100 years (415).
IQ Metrics calculation, from the DeSilva et al. 2023 fileShare of the 851 measured skulls in our analysis set that are dated to the last 100 years (58.7% in the 2021 file).
IQ Metrics calculationSkulls dated 4,200 to 1,000 years ago in the revised file, the window the 3,000-year claim rests on (48 in the 2021 file for 1,000 to 5,000 years).
IQ Metrics calculationAverage volume of 60 chimpanzee skulls (range 290 to 447), the same as Sahelanthropus at about 7 million years (365 cc).
McCarthy and Haque 2026; DeSilva et al. filesLate Pleistocene H. sapiens against an australopith: 1,458 cc against 440 cc.
IQ Metrics calculationAverage Neanderthal skull (26 skulls); H. sapiens skulls under 1,000 years old average 1,304 cc (455).
IQ Metrics calculationAverage decrease reported by 19 earlier studies of a shrinking human brain (range 3.9% to 13.5%); we recompute 8.45%.
DeSilva et al. 2023, Table S1; IQ Metrics calculationBreak date from a simple two-segment fit on the 2021 file (95% interval 300 to 5,900); 760 years on the revised file.
IQ Metrics calculation, simpleIntracranial volume of adults born in the 1970s against the 1930s, by MRI (6.6% more; 3,226 people).
DeCarli et al. 2024Median gap between two compilations for the same skull (80 skulls); 3 differ by 100 cc or more.
IQ Metrics calculationCorrelation between brain volume and IQ in 88 imaging studies of more than 8,000 people: about 6% of the differences in scores.
Pietschnig et al. 2015Rows in the three open data files, matched into measured skulls in our analysis set (1,163 different skulls in all).
IQ Metrics03 What do the key terms mean?
- Endocranial volume (ECV)
- The space inside the braincase, measured on a skull or from a scan, in cubic centimetres (cc, the same as millilitres). It is a little larger than the brain it held.
- Cranial capacity
- The older name for endocranial volume. DeSilva et al. used published volumes in cc or mL and not brain weights in grams, because the two are not equivalent [3].
- Hominin
- A member of the human family tree after the split from the chimpanzee line: Sahelanthropus, Australopithecus, Paranthropus and Homo.
- Pleistocene and Holocene
- The Pleistocene is the ice-age epoch, ending 11,700 years ago; the Holocene is the warm epoch since.
- Change point
- A date at which a trend changes slope or level. DeSilva et al. found one in H. sapiens skull size about 3,000 years ago [3].
- Encephalization
- Brain size relative to what is expected for body size. Our figures are absolute volumes; body mass is not in these files.
- Intracranial volume (MRI)
- The volume inside the skull of a living person, measured on a scan. We compare it with skull volumes only as a trend, never as the same measurement.
- Bootstrap interval
- A range found by redrawing the skulls with replacement many times and refitting. It shows how much a result depends on which skulls are in the sample.
04 How big were the brains of our human ancestors?
The earliest hominin skull measured, Sahelanthropus tchadensis from about 7 million years ago, held about 365 cc: level with the 367 cc average of 60 chimpanzee skulls. That is the starting line of human brain evolution: 360 to 370 cc for Sahelanthropus [9], 300 cc for Ardipithecus ramidus at 4.4 million years, 367 cc for Australopithecus anamensis at 3.8 million [3]. The place of Sahelanthropus in the human family is itself disputed [10].
Australopiths, the next group, averaged 440 cc across 18 skulls (range 367 to 555), about 20% above a chimpanzee and roughly the size they kept for about 1.5 million years, from 3.5 to 2.0 million years ago [3]. Paranthropus, the heavy-jawed side branch, averaged 522 cc (19 skulls). For the living apes, see how chimpanzees compare with human children, gorilla IQ and our data on neurons in 222 species.
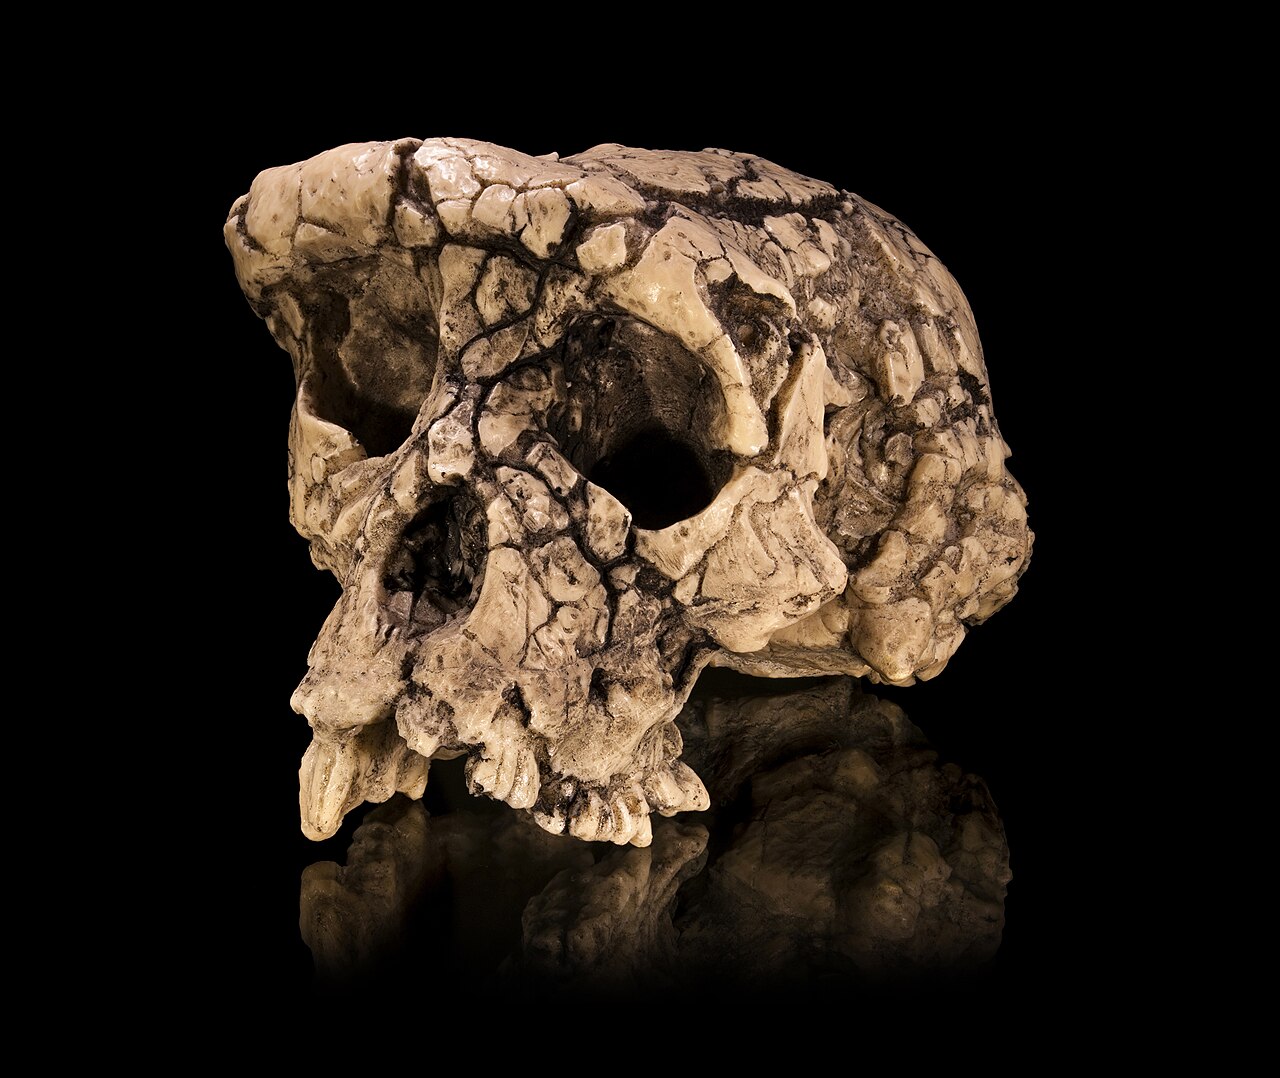
Cast of the cranium of Sahelanthropus tchadensis (TM 266-01-060-1), about 7 million years old: about 365 cc, the size of a chimpanzee skull.
Photo: Didier Descouens, CC BY-SA 4.0, via Wikimedia Commons
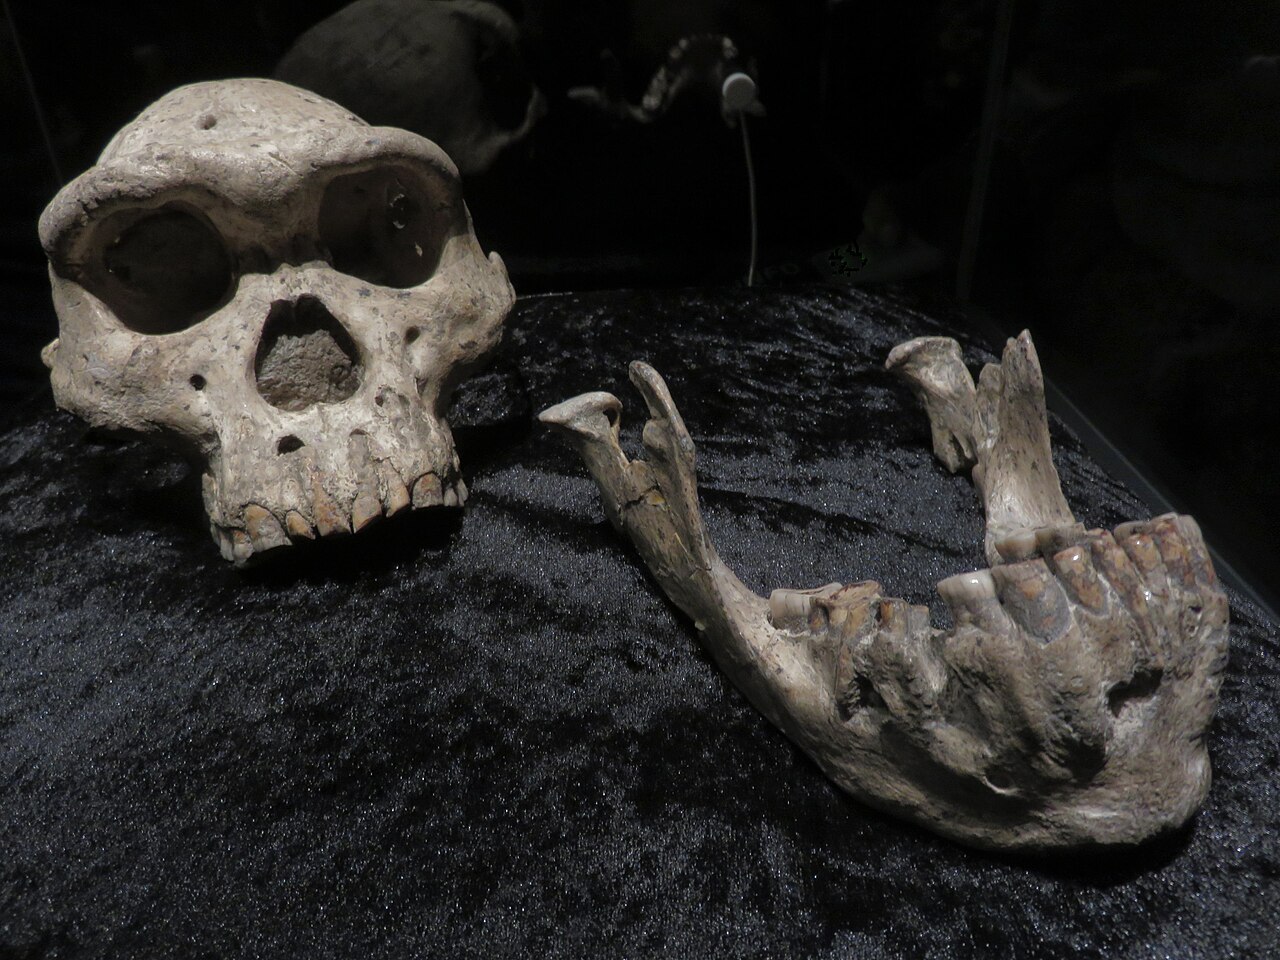
The Dmanisi cranium D4500 and its lower jaw D2600, 1.77 million years old: 546 cc, the smallest Homo erectus skull in our data.
Every measured skull: how big, and how long ago (851 skulls, 7 million years)
Each dot is one skull: its age across (a log scale, each step ten times the last, older to the right) and its endocranial volume up. Volume rises from about 365 cc at 7 million years to about 1,450 cc, and the cloud of recent skulls is the last 415 dots at the far left. Earliest = Rudapithecus, Sahelanthropus and Ardipithecus; Australopiths include Paranthropus; flores. = Homo floresiensis; sapiens = Homo sapiens.
Endocranial volume (cc)
Years ago (log scale)
Skulls dated to the last 100 years are shown at 100 years ago, as in the source files. Chimpanzees have no fossil age and are not on this chart (60 skulls, mean 367 cc).
Source: Du et al. 2018 [1] [2]; DeSilva et al. 2021 [3] and the 2023 revised file [5]; matching and one row per skull by IQ Metrics
Data table
| skull | age_years_ago | ecv_cc | group |
|---|---|---|---|
| RUD 200 | 9850000 | 234 | earliest |
| RUD 77 | 9850000 | 326 | earliest |
| TM 266-01-060 | 7000000 | 365 | earliest |
| ARA-VP-6/500 | 4400000 | 300 | earliest |
| MRD-VP-1/1 | 3800000 | 367 | austral |
| AL 333-105 | 3220000 | 371.5 | austral |
| AL 162-28 | 3200000 | 393 | austral |
| AL 333-45 | 3200000 | 488 | austral |
| AL 288-1 | 3180000 | 388 | austral |
| AL 822-1 | 3100000 | 382 | austral |
| AL 444-2 | 3000000 | 522 | austral |
| Taung-1 | 2805000 | 427.7 | austral |
| MLD 1 | 2650000 | 510 | austral |
| MLD 37/38 | 2650000 | 430 | austral |
| Bouri | 2500000 | 450 | austral |
| KNM-WT 17000 | 2500000 | 410 | austral |
| Omo L388y-6 | 2380000 | 427 | austral |
| Stw 505 | 2350000 | 555 | austral |
| Omo 323-1976-896 | 2230000 | 490 | austral |
| Sts 19/58 | 2100000 | 436 | austral |
| Sts 5 | 2100000 | 485 | austral |
| Sts 60 | 2100000 | 400 | austral |
| Sts 71 | 2100000 | 428 | austral |
| Type 2 | 2100000 | 457 | austral |
| DNH 155 | 2000000 | 450 | austral |
| SK 46 | 1980000 | 800 | austral |
| SK 48 | 1980000 | 750 | austral |
| SK 54 | 1980000 | 500 | austral |
| SK 859 | 1980000 | 465 | austral |
| MH 1 | 1977000 | 420 | austral |
| TM 1517 | 1900000 | 625 | austral |
| KNM-ER 1805 | 1890000 | 582 | erectus |
| KNM-ER 1813 | 1890000 | 509 | erectus |
| OH 24 | 1880000 | 597 | erectus |
| KNM-ER 1470 | 1880000 | 752 | erectus |
| KNM-ER 3732 | 1880000 | 750 | erectus |
| KNM-ER 13750 | 1870000 | 475 | austral |
| KNM-ER 23000 | 1870000 | 491 | austral |
| KNM-ER 1590 | 1850000 | 825 | erectus |
| KNM-ER 407 | 1850000 | 510 | austral |
| OH 5 | 1820000 | 523 | austral |
| OH 7 | 1800000 | 777 | erectus |
| D2280 | 1770000 | 775 | erectus |
| D2282 | 1770000 | 655 | erectus |
| D2700 | 1770000 | 600 | erectus |
| D3444 | 1770000 | 650 | erectus |
| D4500 | 1770000 | 546 | erectus |
| KNM-WT 17400 | 1770000 | 400 | austral |
| Drimolen | 1750000 | 530 | austral |
| Sangiran 31 | 1700000 | 700 | erectus |
| OH 16 | 1670000 | 638 | erectus |
| SK 1585 | 1650000 | 530 | austral |
| Gongwang 1 | 1630000 | 780 | erectus |
| KNM-ER 3733 | 1630000 | 848 | erectus |
| Mojokerto 1 | 1620000 | 800 | erectus |
| Sangiran 4 | 1620000 | 908 | erectus |
| OH 13 | 1600000 | 673 | erectus |
| KNM-ER 406 | 1580000 | 500 | austral |
| KNM-ER 732 | 1580000 | 500 | austral |
| KNM-ER 3883 | 1570000 | 804 | erectus |
| DAN5 | 1550000 | 598 | erectus |
| KNM-ER 42700 | 1550000 | 691 | erectus |
| Sangiran 38 | 1520000 | 850 | erectus |
| KNM-WT 15000 | 1490000 | 880 | erectus |
| Konso | 1420000 | 545 | austral |
| Sangiran 10 | 1290000 | 855 | erectus |
| Sangiran 12 | 1290000 | 1059 | erectus |
| Sangiran 17 | 1290000 | 1004 | erectus |
| Sangiran 2 | 1290000 | 813 | erectus |
| BSN12/P1 | 1260000 | 850 | erectus |
| Bukaran (SBK-1996.02) | 1250000 | 916 | erectus |
| Grogol-Wetan (Gwn-1993.09) | 1250000 | 850 | erectus |
| OH 9 | 1250000 | 1067 | erectus |
| Sangiran IX | 1250000 | 870 | erectus |
| Lantian | 1135000 | 780 | erectus |
| Buia | 1000000 | 900 | erectus |
| Daka | 1000000 | 986 | erectus |
| Yunxian | 936000 | 1050 | erectus |
| Sangiran 3 | 900000 | 950 | erectus |
| Trinil 2 | 900000 | 940 | erectus |
First 80 of 851 rows; the Data button gives all of them.
Embed this chart
Paste this HTML into your page: it carries the numbers and the credit link to this figure.
Our dataset holds one row per measured skull, built from three open files: 94 fossil crania in Du et al. 2018 [1], 987 rows in DeSilva et al. 2021 [3] and 837 in their 2023 revision [5], plus 60 chimpanzee skulls from a 2026 data release [11]. A skull that appears in two files is one row; the 2021 and 2023 files share 675 of their rows.
How much skulls vary inside each kind of human ancestor
Each dot is one skull. The box is the middle half of the skulls, the line the median, the whiskers the smallest and the largest. Even inside one group the spread is 400 to 800 cc, wider than the gap between neighbouring groups.
Source: Skull data as Figure 1; chimpanzees: McCarthy and Haque 2026 [11]; quartiles by IQ Metrics
Data table
| group | n | low | q1 | median | q3 | high |
|---|---|---|---|---|---|---|
| Chimpanzee (living) | 60 | 290 | 345 | 360 | 386 | 447 |
| Australopithecus | 18 | 367 | 395 | 429 | 478 | 555 |
| Paranthropus | 19 | 400 | 470 | 500 | 530 | 800 |
| Early Homo | 9 | 509 | 597 | 673 | 752 | 825 |
| Homo erectus | 54 | 546 | 806 | 912 | 1034 | 1800 |
| Homo heidelbergensis | 27 | 880 | 1158 | 1230 | 1330 | 1450 |
| Neanderthals | 26 | 1065 | 1251 | 1355 | 1546 | 1740 |
| H. sapiens, over 11,700 years ago | 136 | 1100 | 1374 | 1464 | 1554 | 1775 |
| H. sapiens, 11,700 to 100 years ago | 139 | 1030 | 1300 | 1422 | 1546 | 1861 |
| H. sapiens, last 100 years | 415 | 975 | 1189 | 1283 | 1394 | 1776 |
Embed this chart
Paste this HTML into your page: it carries the numbers and the credit link to this figure.
05 When did human brain size triple?
Between about 2 million and 430,000 years ago. The average rose from 440 cc in australopiths to 678 cc in early Homo and 932 cc in Homo erectus, and the first skulls past three times the australopith average (1,318 cc) are three Atapuerca skulls (Arsuaga et al. 2014), dated about 430,000 years ago in the files (1,334 to 1,437 cc) [5]. Overall: about a four-fold increase over 7 million years [9].
The rise was not smooth. A change-point fit on 985 skulls found the rate of increase jumping at 2.10 million years ago (±0.07) and again at 1.49 million (±0.14), around the first Homo erectus [3]. Du et al. found that 64% or 88% of the gradual rise, depending on the taxonomy, came from change inside lineages rather than from larger-brained species replacing smaller-brained ones [1], and a 2024 phylogenetic study agrees that relative brain size rose within species across 7 million years [10]. The smallest Homo erectus, D4500 from Dmanisi, Georgia, holds 546 cc [14]; the Homo erectus average is 932 cc against 1,244 cc for Homo heidelbergensis.
Not every lineage grew. Homo naledi, deposited in South Africa between 236,000 and 335,000 years ago, had skulls of about 465, 560 and 610 cc, inside the australopith range, with LES1 the largest [13] [12]. Homo floresiensis from Flores was about 380 to 426 cc depending on the measurement [15] [12].
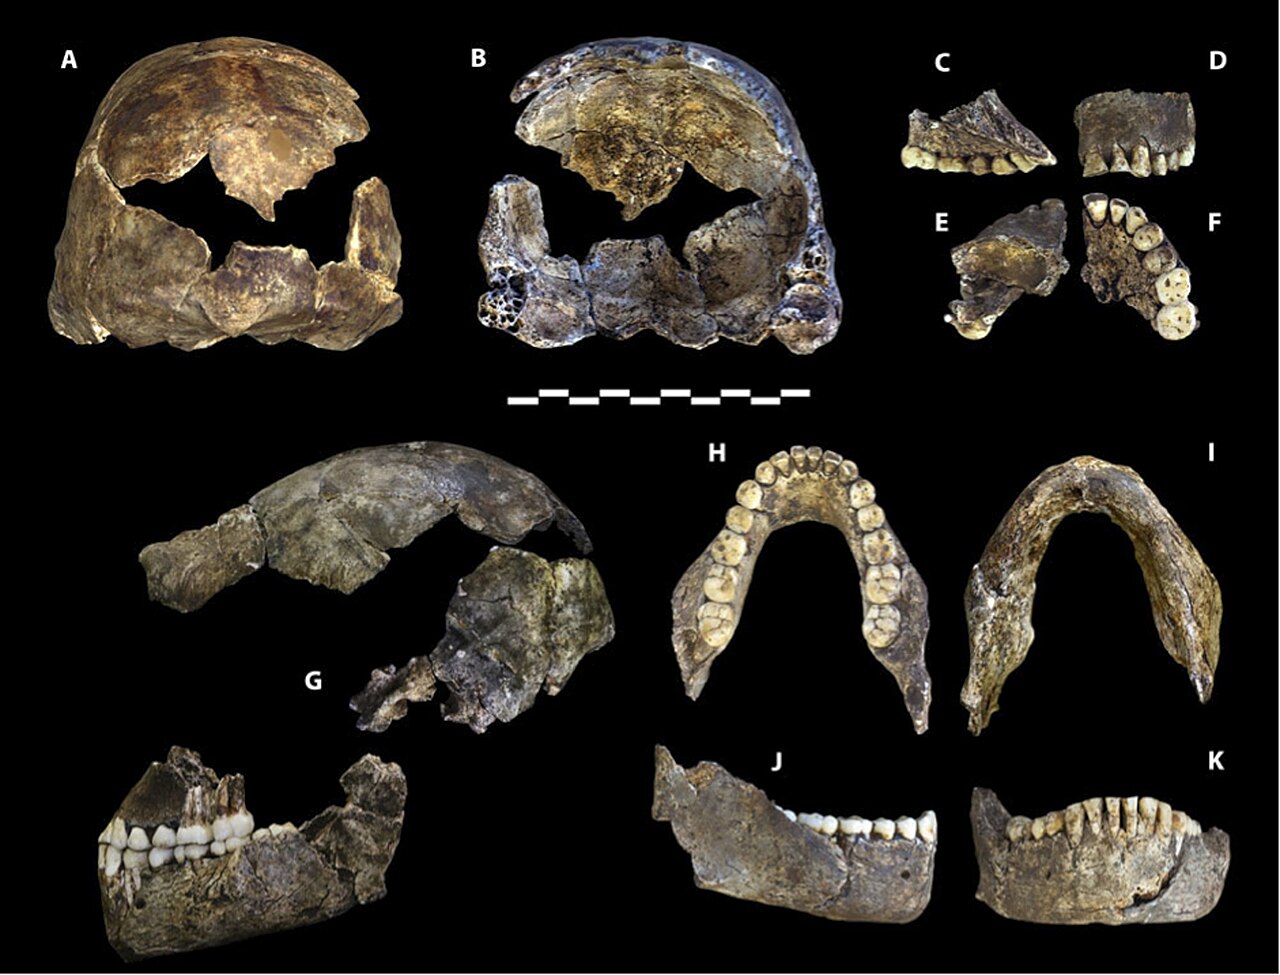
The Homo naledi holotype, DH1 (A to K: the cranial and jaw pieces). Its volume is about 560 cc; the species runs from 465 to 610 cc.
Photo: Lee Roger Berger research team, CC BY-SA 4.0, via Wikimedia Commons
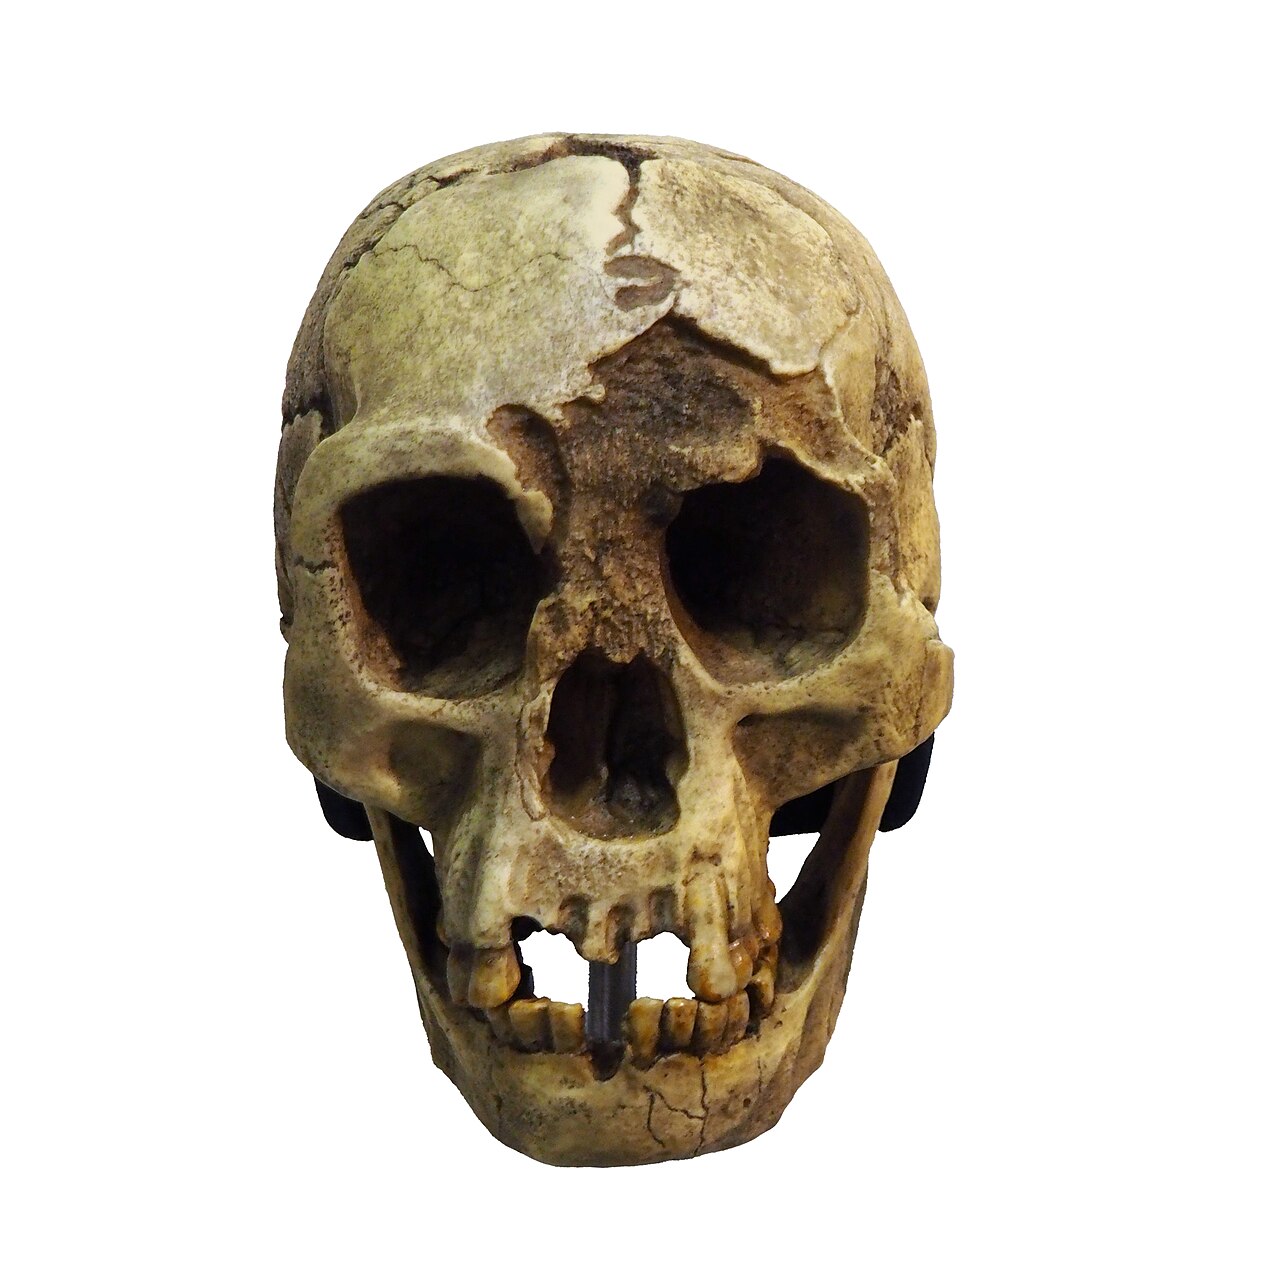
A cast of the Homo floresiensis skull. Papers give the type skull, LB1, 380 to 426 cc; our data hold 419.
Four times a chimpanzee: average skull volume, smallest to largest
Average endocranial volume in cubic centimetres. A Late Pleistocene human skull holds 4.0 times a chimpanzee's volume and 3.3 times an australopith's; Neanderthals and Late Pleistocene H. sapiens sit within 70 cc of each other. Species with 1 to 4 skulls are single measurements, not averages of a population.
Source: Skulls as Figure 1; chimpanzees: McCarthy and Haque 2026 [11]; averages by IQ Metrics
Data table
| label | value |
|---|---|
| Ardipithecus ramidus (1 skull, 4.4 Ma) | 300 |
| Sahelanthropus tchadensis (1 skull, 7 Ma) | 365 |
| Chimpanzee, living (60 skulls) | 367 |
| Homo floresiensis (1 skull) | 419 |
| Australopithecus (18 skulls) | 440 |
| Paranthropus (19 skulls) | 522 |
| Homo naledi (3 skulls) | 545 |
| Early Homo (9 skulls) | 678 |
| Homo erectus (54 skulls) | 932 |
| Homo heidelbergensis (27 skulls) | 1244 |
| H. sapiens, last 100 years (415) | 1297 |
| Neanderthals (26 skulls) | 1388 |
| H. sapiens 11,700 to 100 years ago (139) | 1430 |
| H. sapiens over 11,700 years ago (136) | 1458 |
Embed this chart
Paste this HTML into your page: it carries the numbers and the credit link to this figure.
Species by species: the average and the smallest to largest skull
The dot is the average volume, the bar runs from the smallest to the largest skull measured, oldest species at the top. Averages rest on 3 to 54 skulls for fossil species and on hundreds for H. sapiens; species with a single skull are in the next figure.
Source: Skull data as Figure 1; averages and ranges by IQ Metrics
Data table
| label | low | estimate | high |
|---|---|---|---|
| A. afarensis (n = 6) | 372 | 424 | 522 |
| A. africanus (n = 9) | 400 | 459 | 555 |
| P. boisei (n = 10) | 400 | 486 | 545 |
| P. robustus (n = 8) | 450 | 581 | 800 |
| H. habilis (n = 6) | 509 | 629 | 777 |
| H. rudolfensis (n = 3) | 750 | 776 | 825 |
| H. naledi (n = 3) | 465 | 545 | 610 |
| H. erectus (n = 54) | 546 | 932 | 1800 |
| H. heidelbergensis (n = 26) | 880 | 1238 | 1450 |
| Neanderthals (n = 26) | 1065 | 1388 | 1740 |
| H. sapiens, over 11,700 y ago (n = 136) | 1100 | 1458 | 1775 |
| H. sapiens, 11,700 to 100 y ago (n = 139) | 1030 | 1430 | 1861 |
| H. sapiens, last 100 y (n = 415) | 975 | 1297 | 1776 |
Embed this chart
Paste this HTML into your page: it carries the numbers and the credit link to this figure.
06 Did Neanderthals have bigger brains than we do?
Yes, on average: 26 Neanderthal skulls average 1,388 cc against 1,304 cc for 455 modern H. sapiens skulls under 1,000 years old in the same file, 85 cc more (our 95% interval 15 to 155). Neanderthal brain size matches that of Late Pleistocene H. sapiens, not the modern average.
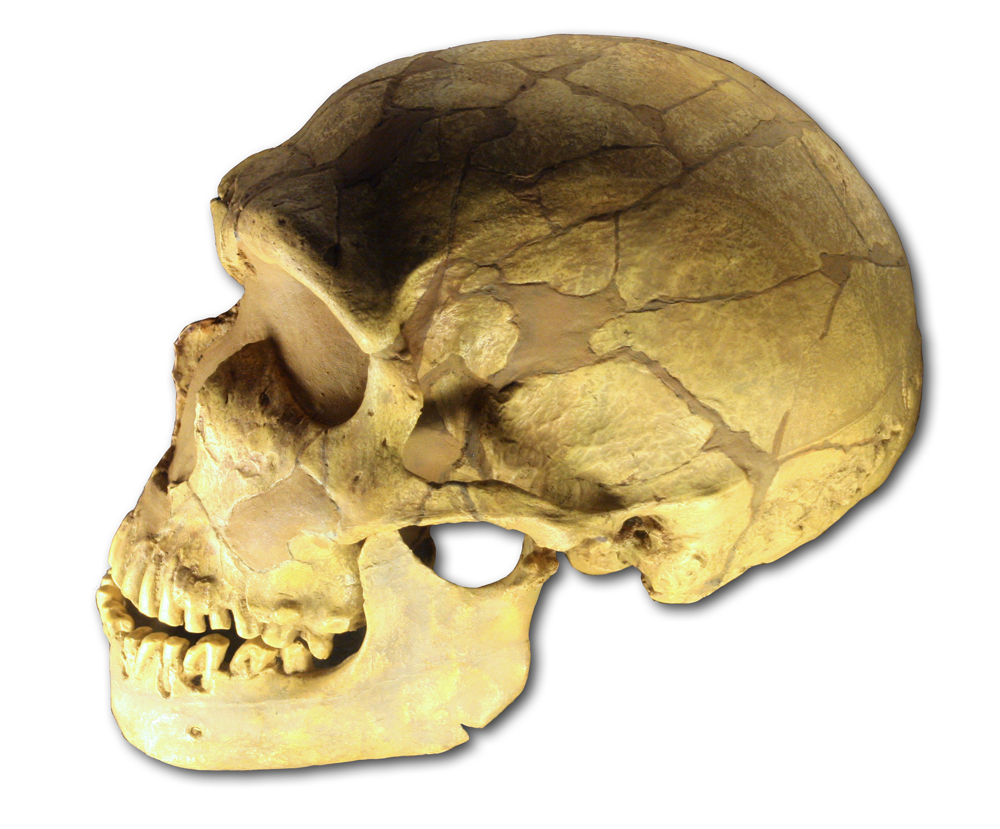
La Ferrassie 1, a Neanderthal skull: 1,640 cc in our data, about 70,000 years old.
Photo: Wikimedia Commons user 120, CC BY 2.5, via Wikimedia Commons
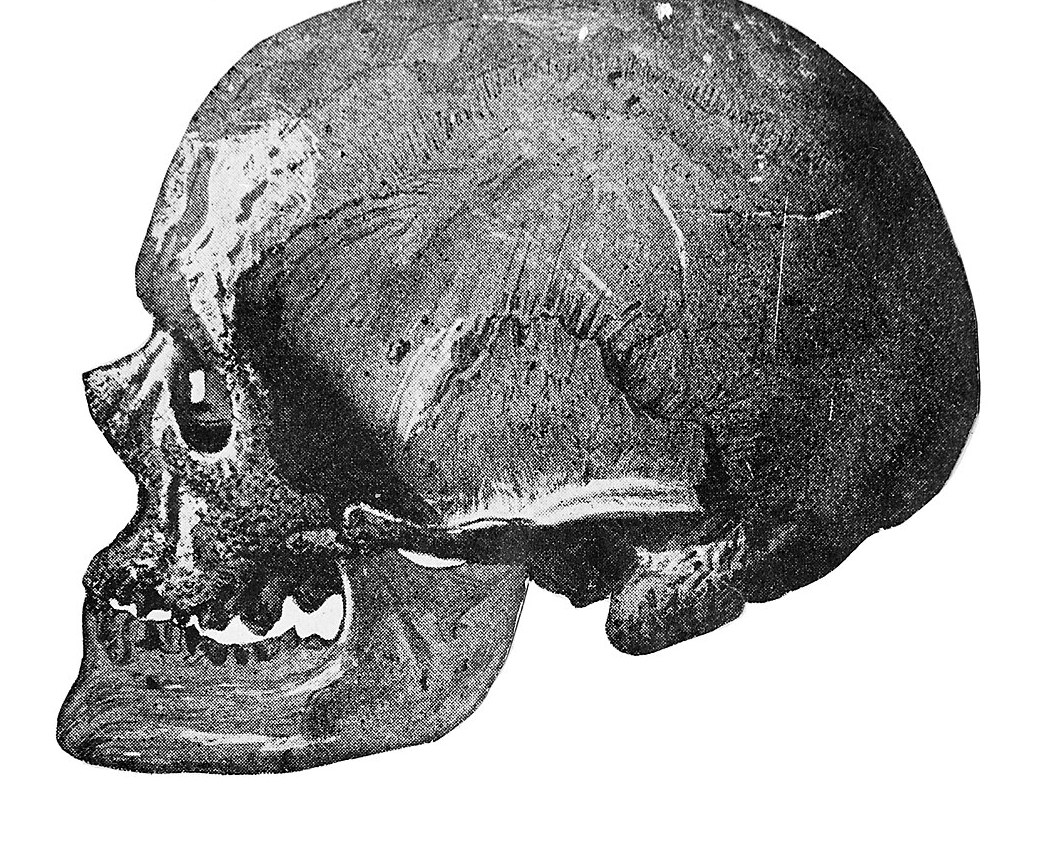
The skull of the Old Man of Cro-Magnon (Cro-Magnon 1), about 27,700 years old: 1,730 cc, among the largest in our data.
Photo: Wellcome Collection, CC BY 4.0, cropped, via Wikimedia Commons
Neanderthals who lived in the last glacial (under 115,000 years ago, 14 skulls) average 1,459 cc, effectively the same as the 1,458 cc of Late Pleistocene H. sapiens [5]. A 2023 review lists a Neanderthal average of 1,415 cc (25 skulls) and 1,499 cc for Pleistocene H. sapiens (29 skulls), from older measurements [9]: different skulls, the same picture. The largest Neanderthal in the files, Amud, is about 1,740 cc.
How smart were Neanderthals? Skull volume cannot say. It does not include body size, wiring or learning, and in living people it explains about 6% of the differences in IQ scores [8]; see brain size and IQ: what a correlation of 0.24 means. A bigger average is a fact about skulls.
07 What is the average human brain size, in cubic centimetres?
Roughly 1,300 to 1,370 cc, depending on the sample: 1,304 cc for 455 museum and anatomical skulls in the revised file, 1,349 cc for 5,288 skulls in a global survey, 1,371 cc in MRI scans of 2,717 adults in the United States and Europe [5]. A cubic centimetre is a millilitre. A cranial capacity is not the same as a brain weight, which is why published averages differ.
The choice matters for the shrinking-brain question. A 2022 critique called the 1,297 cc average of the 2021 file too low against 1,340 to 1,460 cc in other published estimates [4]; the authors answered that the same sources give 1,308 to 1,392 cc [5]. A 2024 commentary pooled three samples and a revised file into 10,363 skulls and brains at 1,341 cc [6].
The size of the drop depends on which "modern" average you pick: 87 to 154 cc
The Late Pleistocene H. sapiens average in the revised file (1,458 cc, n = 136) against six published modern averages. Same earlier skulls, different modern reference: the gap runs from 87 to 154 cc.
Average volume (cc)
Source: DeSilva et al. 2023, Table S2 [5]; De Caro 2024 [6]; Tattersall 2023 [9]; Late Pleistocene average by IQ Metrics
Data table
| modern reference | Modern average | Late Pleistocene average |
|---|---|---|
| Our 455 museum and anatomical skulls | 1304 | 1458 |
| Tattersall 2023, "contemporary" (more than 500) | 1330 | 1458 |
| Medical, United States (3,399 brains, converted) | 1334.5 | 1458 |
| De Caro 2024, all sources combined (10,363) | 1341 | 1458 |
| Beals et al. 1984, global survey (5,288 skulls) | 1349 | 1458 |
| MRI, United States and Europe (2,717) | 1370.8 | 1458 |
Embed this chart
Paste this HTML into your page: it carries the numbers and the credit link to this figure.
08 Are human brains shrinking?
Skulls from the last 100 years average 1,297 cc, 161 cc under skulls older than 11,700 years (1,458 cc), but whether that is shrinking or sampling is disputed. Nineteen earlier studies report a decrease averaging 8.5% [5]; a 2022 reanalysis found none once the sample was rebalanced [4].
The claim (2021)
DeSilva, Traniello, Claxton and Fannin put 985 dated skulls through a change-point analysis and found that human brain reduction was “surprisingly recent, occurring in the last 3,000 years” [3]. The fitted break was at 0.003 ± 0.001 million years ago, and the rate of change after it was 50 times the rate of the earlier rise. They called the result conservative and proposed that the externalization of knowledge in groups, as in ant colonies, may explain it [3].
The critique (2022)
Villmoare and Grabowski noted that 578 of the 987 specimens, more than half, were dated to the final 100 years, from two sources, and that only 23 skulls covered the 5,000 to 1,000 years the claim depends on. Their modern average, 1,297 cc, sat below published ones. They reduced the data to 100-year means, tested the last 300,000 and the last 30,000 years, and found no change point (Davies test p = 0.739 and 0.259) and a flat trend (p = 0.754): “human brain size has been remarkably stable over the last 300 ka” [4].
The reply (2023) and the re-check (2024)
DeSilva and seven colleagues reaffirmed the reduction. They removed the Morton collection, which they called problematic, added 94 skulls from the Terry collection, 50 from India, 13 dated 1,000 to 5,000 years ago and three measured in South Africa, dropped four juvenile Neanderthals and a duplicate, and argued that binning dilutes the variation. With simple t-tests they found a drop of 159 cc (or 117 cc against a larger modern reference) after 3,000 years (t = 12.81) and 10.8% overall [5]. In 2024 De Caro pooled the revised file with three large samples, agreed the reduction in the last 5,000 years looked real, but argued one 25-skull sample from Afalou, Algeria, should come out and that the fit explains little of the variation [6].
How the 3,000-year claim travelled: claim, critique, reply, re-check
Each step in time order, from the earlier work the claim rests on to the latest check. Steps are evenly spaced; the year is printed above each dot.
- 2021DeSilva et al.: a change point 3,000 years agoPiecewise fit to 985 dated skulls; reduction "surprisingly recent"
- 2022Villmoare and Grabowski: no change point578 of 987 skulls in the final 100 years; no break once rebalanced
- 2023DeSilva et al. reply with a revised fileMorton skulls out, about 160 skulls added; a drop of 159 or 117 cc
- 2024De Caro re-checks the replyConfirms a drop; questions one 25-skull sample
- 1934von Bonin: 3.9% smaller in EuropeOver 10,000 or 20,000 years
- 1984Beals et al.: 9.0% on 5,288 skullsOver the last 100,000 years
- 1988Henneberg: 13.5%About 12,800 skulls; since 20,000 years
- 1997Ruff et al.: 11.1%Over 35,000 years
- 2004Henneberg: 7.3% over the last 3,000 yearsMore than 14,000 skulls
Source: DeSilva et al. 2021 [3]; Villmoare and Grabowski 2022 [4]; DeSilva et al. 2023, Table S1 [5]; De Caro 2024 [6]. No press step is shown: we used no news source
Data table
| claim | step | year | type | what happened | detail |
|---|---|---|---|---|---|
| The 3,000-year claim, 2021 to 2024 | 1 | 2021 | New data or a new analysis | DeSilva et al.: a change point 3,000 years ago | Piecewise fit to 985 dated skulls; reduction "surprisingly recent" |
| The 3,000-year claim, 2021 to 2024 | 2 | 2022 | A critique or a check | Villmoare and Grabowski: no change point | 578 of 987 skulls in the final 100 years; no break once rebalanced |
| The 3,000-year claim, 2021 to 2024 | 3 | 2023 | New data or a new analysis | DeSilva et al. reply with a revised file | Morton skulls out, about 160 skulls added; a drop of 159 or 117 cc |
| The 3,000-year claim, 2021 to 2024 | 4 | 2024 | A critique or a check | De Caro re-checks the reply | Confirms a drop; questions one 25-skull sample |
| Earlier work the claim builds on | 1 | 1934 | Earlier estimate | von Bonin: 3.9% smaller in Europe | Over 10,000 or 20,000 years |
| Earlier work the claim builds on | 2 | 1984 | Earlier estimate | Beals et al.: 9.0% on 5,288 skulls | Over the last 100,000 years |
| Earlier work the claim builds on | 3 | 1988 | Earlier estimate | Henneberg: 13.5% | About 12,800 skulls; since 20,000 years |
| Earlier work the claim builds on | 4 | 1997 | Earlier estimate | Ruff et al.: 11.1% | Over 35,000 years |
| Earlier work the claim builds on | 5 | 2004 | Earlier estimate | Henneberg: 7.3% over the last 3,000 years | More than 14,000 skulls |
Embed this chart
Paste this HTML into your page: it carries the numbers and the credit link to this figure.
Both sides use the same skulls and mostly agree on the averages. They disagree on whether skulls from a handful of collections can stand for the world’s people over time. The size of the claimed drop also depends on the choice of “modern” average, as Figure 5 shows.
Nineteen earlier studies of a shrinking brain: from 3.9% to 13.5%
Percentage decrease reported by each study, as compiled in Table S1 of the 2023 reply (Wiercinski gave 5.6 to 5.8, shown as 5.7; Brown gave two figures). The authors report an average of 8.5%; recomputed from the table it is 8.45% across the 19 with a figure. The two DeSilva et al. papers are highlighted.
Source: DeSilva et al. 2023, Supplementary Table S1 [5] (their compilation; we have not re-read each study); average by IQ Metrics
Data table
| label | value |
|---|---|
| Henneberg, 1988 | 13.5 |
| DeSilva et al., 2021 | 11.5 |
| Ruff et al., 1997 | 11.1 |
| DeSilva et al., 2023 | 10.8 |
| Stibel, 2022 | 10.7 |
| Henneberg & Steyn, 1995 | 10 |
| Henneberg, 1998 | 10 |
| Brown, 1992 (Australia) | 9.5 |
| Beals et al., 1984 | 9 |
| Schwidetzky, 1976 | 8.9 |
| Balzeau et al., 2013 | 8.7 |
| Henneberg & Steyn, 1993 | 8.4 |
| Henneberg, 2004 | 7.3 |
| Wu et al., 2007 | 7.2 |
| Brown & Maeda, 2004 | 7 |
| Wiercinski, 1979 | 5.7 |
| Stibel, 2021 | 5.4 |
| Brown, 1992 (East Asia) | 5 |
| Liu et al., 2014 | 4.2 |
| von Bonin, 1934 | 3.9 |
Embed this chart
Paste this HTML into your page: it carries the numbers and the credit link to this figure.
09 Where do the skulls in the shrinking-brain data come from?
Mostly from the last 100 years: 415 of the 851 skulls in our analysis set (48.8%), and 578 of 985 in the 2021 file (58.7%). They come from seven collections in the United States, Australia, China, India and England, dated in the files to “100 years ago”. Only 24 skulls (2.8%) are older than 2 million years, and the 300,000 years before the Holocene hold 188 (22.1%) [3] [5].
Every skull in our analysis set, one square each: 851 skulls, mostly Homo sapiens
Oldest first, from the top left. 690 of the 851 squares are Homo sapiens, and 415 of those are dated to the last 100 years. Hover a square for the skull.
851 skullsone square = one skull
Source: The CSV below; skulls from [1] [3] [5]; matching by IQ Metrics
Data table
| skull | group | label | detail |
|---|---|---|---|
| HB0001 | Miocene ape (Rudapithecus) | RUD 200 | Rudapithecus hungaricus · 9,850,000 years ago · 234 cc |
| HB0002 | Miocene ape (Rudapithecus) | RUD 77 | Rudapithecus hungaricus · 9,850,000 years ago · 326 cc |
| HB0003 | Sahelanthropus and Ardipithecus | TM 266-01-060 | Sahelanthropus tchadensis · 7,000,000 years ago · 365 cc |
| HB0004 | Sahelanthropus and Ardipithecus | ARA-VP-6/500 | Ardipithecus ramidus · 4,400,000 years ago · 300 cc |
| HB0005 | Australopithecus | MRD-VP-1/1 | Australopithecus anamensis · 3,800,000 years ago · 367 cc |
| HB0006 | Australopithecus | AL 333-105 | Australopithecus afarensis · 3,220,000 years ago · 372 cc |
| HB0007 | Australopithecus | AL 162-28 | Australopithecus afarensis · 3,200,000 years ago · 393 cc |
| HB0008 | Australopithecus | AL 333-45 | Australopithecus afarensis · 3,200,000 years ago · 488 cc |
| HB0009 | Australopithecus | AL 288-1 | Australopithecus afarensis · 3,180,000 years ago · 388 cc |
| HB0010 | Australopithecus | AL 822-1 | Australopithecus afarensis · 3,100,000 years ago · 382 cc |
| HB0011 | Australopithecus | AL 444-2 | Australopithecus afarensis · 3,000,000 years ago · 522 cc |
| HB0012 | Australopithecus | Taung-1 | Australopithecus africanus · 2,805,000 years ago · 428 cc |
| HB0013 | Australopithecus | MLD 1 | Australopithecus africanus · 2,650,000 years ago · 510 cc |
| HB0014 | Australopithecus | MLD 37/38 | Australopithecus africanus · 2,650,000 years ago · 430 cc |
| HB0015 | Australopithecus | Bouri | Australopithecus garhi · 2,500,000 years ago · 450 cc |
| HB0018 | Australopithecus | Stw 505 | Australopithecus africanus · 2,350,000 years ago · 555 cc |
| HB0020 | Australopithecus | Sts 19/58 | Australopithecus africanus · 2,100,000 years ago · 436 cc |
| HB0021 | Australopithecus | Sts 5 | Australopithecus africanus · 2,100,000 years ago · 485 cc |
| HB0022 | Australopithecus | Sts 60 | Australopithecus africanus · 2,100,000 years ago · 400 cc |
| HB0023 | Australopithecus | Sts 71 | Australopithecus africanus · 2,100,000 years ago · 428 cc |
| HB0024 | Australopithecus | Type 2 | Australopithecus africanus · 2,100,000 years ago · 457 cc |
| HB0030 | Australopithecus | MH 1 | Australopithecus sediba · 1,977,000 years ago · 420 cc |
| HB0016 | Paranthropus | KNM-WT 17000 | Paranthropus aethiopicus · 2,500,000 years ago · 410 cc |
| HB0017 | Paranthropus | Omo L388y-6 | Paranthropus boisei · 2,380,000 years ago · 427 cc |
| HB0019 | Paranthropus | Omo 323-1976-896 | Paranthropus boisei · 2,230,000 years ago · 490 cc |
| HB0025 | Paranthropus | DNH 155 | Paranthropus robustus · 2,000,000 years ago · 450 cc |
| HB0026 | Paranthropus | SK 46 | Paranthropus robustus · 1,980,000 years ago · 800 cc |
| HB0027 | Paranthropus | SK 48 | Paranthropus robustus · 1,980,000 years ago · 750 cc |
| HB0028 | Paranthropus | SK 54 | Paranthropus robustus · 1,980,000 years ago · 500 cc |
| HB0029 | Paranthropus | SK 859 | Paranthropus robustus · 1,980,000 years ago · 465 cc |
| HB0031 | Paranthropus | TM 1517 | Paranthropus robustus · 1,900,000 years ago · 625 cc |
| HB0037 | Paranthropus | KNM-ER 13750 | Paranthropus boisei · 1,870,000 years ago · 475 cc |
| HB0038 | Paranthropus | KNM-ER 23000 | Paranthropus boisei · 1,870,000 years ago · 491 cc |
| HB0040 | Paranthropus | KNM-ER 407 | Paranthropus boisei · 1,850,000 years ago · 510 cc |
| HB0041 | Paranthropus | OH 5 | Paranthropus boisei · 1,820,000 years ago · 523 cc |
| HB0048 | Paranthropus | KNM-WT 17400 | Paranthropus boisei · 1,770,000 years ago · 400 cc |
| HB0049 | Paranthropus | Drimolen | Paranthropus robustus · 1,750,000 years ago · 530 cc |
| HB0052 | Paranthropus | SK 1585 | Paranthropus robustus · 1,650,000 years ago · 530 cc |
| HB0058 | Paranthropus | KNM-ER 406 | Paranthropus boisei · 1,580,000 years ago · 500 cc |
| HB0059 | Paranthropus | KNM-ER 732 | Paranthropus boisei · 1,580,000 years ago · 500 cc |
| HB0065 | Paranthropus | Konso | Paranthropus boisei · 1,420,000 years ago · 545 cc |
| HB0032 | Early Homo (habilis, rudolfensis) | KNM-ER 1805 | Homo habilis · 1,890,000 years ago · 582 cc |
| HB0033 | Early Homo (habilis, rudolfensis) | KNM-ER 1813 | Homo habilis · 1,890,000 years ago · 509 cc |
| HB0034 | Early Homo (habilis, rudolfensis) | OH 24 | Homo habilis · 1,880,000 years ago · 597 cc |
| HB0035 | Early Homo (habilis, rudolfensis) | KNM-ER 1470 | Homo rudolfensis · 1,880,000 years ago · 752 cc |
| HB0036 | Early Homo (habilis, rudolfensis) | KNM-ER 3732 | Homo rudolfensis · 1,880,000 years ago · 750 cc |
| HB0039 | Early Homo (habilis, rudolfensis) | KNM-ER 1590 | Homo rudolfensis · 1,850,000 years ago · 825 cc |
| HB0042 | Early Homo (habilis, rudolfensis) | OH 7 | Homo habilis · 1,800,000 years ago · 777 cc |
| HB0051 | Early Homo (habilis, rudolfensis) | OH 16 | Homo habilis · 1,670,000 years ago · 638 cc |
| HB0057 | Early Homo (habilis, rudolfensis) | OH 13 | Homo habilis · 1,600,000 years ago · 673 cc |
| HB0043 | Homo erectus (incl. Dmanisi) | D2280 | Homo erectus · 1,770,000 years ago · 775 cc |
| HB0044 | Homo erectus (incl. Dmanisi) | D2282 | Homo erectus · 1,770,000 years ago · 655 cc |
| HB0045 | Homo erectus (incl. Dmanisi) | D2700 | Homo erectus · 1,770,000 years ago · 600 cc |
| HB0046 | Homo erectus (incl. Dmanisi) | D3444 | Homo erectus · 1,770,000 years ago · 650 cc |
| HB0047 | Homo erectus (incl. Dmanisi) | D4500 | Homo erectus · 1,770,000 years ago · 546 cc |
| HB0050 | Homo erectus (incl. Dmanisi) | Sangiran 31 | Homo erectus · 1,700,000 years ago · 700 cc |
| HB0053 | Homo erectus (incl. Dmanisi) | Gongwang 1 | Homo erectus · 1,630,000 years ago · 780 cc |
| HB0054 | Homo erectus (incl. Dmanisi) | KNM-ER 3733 | Homo erectus · 1,630,000 years ago · 848 cc |
| HB0055 | Homo erectus (incl. Dmanisi) | Mojokerto 1 | Homo erectus · 1,620,000 years ago · 800 cc |
| HB0056 | Homo erectus (incl. Dmanisi) | Sangiran 4 | Homo erectus · 1,620,000 years ago · 908 cc |
| HB0060 | Homo erectus (incl. Dmanisi) | KNM-ER 3883 | Homo erectus · 1,570,000 years ago · 804 cc |
| HB0061 | Homo erectus (incl. Dmanisi) | DAN5 | Homo erectus · 1,550,000 years ago · 598 cc |
| HB0062 | Homo erectus (incl. Dmanisi) | KNM-ER 42700 | Homo erectus · 1,550,000 years ago · 691 cc |
| HB0063 | Homo erectus (incl. Dmanisi) | Sangiran 38 | Homo erectus · 1,520,000 years ago · 850 cc |
| HB0064 | Homo erectus (incl. Dmanisi) | KNM-WT 15000 | Homo erectus · 1,490,000 years ago · 880 cc |
| HB0066 | Homo erectus (incl. Dmanisi) | Sangiran 10 | Homo erectus · 1,290,000 years ago · 855 cc |
| HB0067 | Homo erectus (incl. Dmanisi) | Sangiran 12 | Homo erectus · 1,290,000 years ago · 1,059 cc |
| HB0068 | Homo erectus (incl. Dmanisi) | Sangiran 17 | Homo erectus · 1,290,000 years ago · 1,004 cc |
| HB0069 | Homo erectus (incl. Dmanisi) | Sangiran 2 | Homo erectus · 1,290,000 years ago · 813 cc |
| HB0070 | Homo erectus (incl. Dmanisi) | BSN12/P1 | Homo erectus · 1,260,000 years ago · 850 cc |
| HB0071 | Homo erectus (incl. Dmanisi) | Bukaran (SBK-1996.02) | Homo erectus · 1,250,000 years ago · 916 cc |
| HB0072 | Homo erectus (incl. Dmanisi) | Grogol-Wetan (Gwn-1993.09) | Homo erectus · 1,250,000 years ago · 850 cc |
| HB0073 | Homo erectus (incl. Dmanisi) | OH 9 | Homo erectus · 1,250,000 years ago · 1,067 cc |
| HB0074 | Homo erectus (incl. Dmanisi) | Sangiran IX | Homo erectus · 1,250,000 years ago · 870 cc |
| HB0075 | Homo erectus (incl. Dmanisi) | Lantian | Homo erectus · 1,135,000 years ago · 780 cc |
| HB0076 | Homo erectus (incl. Dmanisi) | Buia | Homo erectus · 1,000,000 years ago · 900 cc |
| HB0077 | Homo erectus (incl. Dmanisi) | Daka | Homo erectus · 1,000,000 years ago · 986 cc |
| HB0078 | Homo erectus (incl. Dmanisi) | Yunxian | Homo erectus · 936,000 years ago · 1,050 cc |
| HB0079 | Homo erectus (incl. Dmanisi) | Sangiran 3 | Homo erectus · 900,000 years ago · 950 cc |
| HB0080 | Homo erectus (incl. Dmanisi) | Trinil 2 | Homo erectus · 900,000 years ago · 940 cc |
First 80 of 851 rows; the Data button gives all of them.
Embed this chart
Paste this HTML into your page: it carries the numbers and the credit link to this figure.
Where the skulls come from: half of them are from the last 100 years
Skulls per period, coloured by group. 415 of 851 skulls (48.8%) are dated to the last 100 years, 188 (22.1%) to the 300,000 years before the Holocene and only 24 (2.8%) are older than 2 million years.
Source: The CSV below; periods and counts by IQ Metrics from [1] [3] [5]
Data table
| period | Miocene ape (Rudapithecus) | Sahelanthropus and Ardipithecus | Australopithecus | Paranthropus | Early Homo (habilis, rudolfensis) | Homo erectus (incl. Dmanisi) | Homo heidelbergensis (incl. Harbin) | Homo naledi and H. floresiensis | Neanderthals | Homo sapiens | total |
|---|---|---|---|---|---|---|---|---|---|---|---|
| Older than 2 million years | 2 | 2 | 17 | 3 | 24 | ||||||
| 2 million to 300,000 years | 1 | 16 | 9 | 44 | 15 | 85 | |||||
| 300,000 to 11,700 years | 10 | 12 | 4 | 26 | 136 | 188 | |||||
| 11,700 to 100 years | 139 | 139 | |||||||||
| The last 100 years | 415 | 415 |
Embed this chart
Paste this HTML into your page: it carries the numbers and the credit link to this figure.
The window the claim turns on is thin. Of 673 H. sapiens skulls up to 50,000 years old in the revised file, 218 are older than 1,000 years, and only 30 are dated 1,000 to 5,000 years ago; the 2021 file had 48, of which 36 came from two sites dated to about 1,000 years. The critics counted 23 in their window [4]; the count depends on where the 1,000-year sites are placed.
From 1,918 rows to the 30 skulls that cover the years the claim turns on
Rows in the three data files; different skulls once duplicates are matched; the analysis set (the authors' 2023 version plus the 14 skulls only Du et al. list); H. sapiens in the last 50,000 years; of those older than 1,000 years; and those dated 1,000 to 5,000 years ago, the window that carries the 3,000-year claim.
Source: IQ Metrics count from [1] [3] [5]
Data table
| stage | count | pct_of_first | pct_of_previous |
|---|---|---|---|
| Rows across the three data files | 1918 | 100 | 100 |
| Different skulls after matching | 1163 | 60.6 | 60.6 |
| Analysis set | 851 | 44.4 | 73.2 |
| H. sapiens, last 50,000 years | 673 | 35.1 | 79.1 |
| Older than 1,000 years | 218 | 11.4 | 32.4 |
| 1,000 to 5,000 years old | 30 | 1.6 | 13.8 |
Embed this chart
Paste this HTML into your page: it carries the numbers and the credit link to this figure.
The 987 volumes of the original data: one tall peak around 1,300 cc
All 987 rows of the 2021 file in 100 cc bands (it counts 985 dated skulls in its model). The tall peak at 1,200 to 1,400 cc is mostly recent skulls; the 49 rows under 700 cc are almost all australopiths and early Homo.
Endocranial volume (cc)
Source: DeSilva et al. 2021, supplementary Table_1.XLSX [3]; bands by IQ Metrics
Data table
| from | to | skulls |
|---|---|---|
| 200 | 300 | 1 |
| 300 | 400 | 7 |
| 400 | 500 | 18 |
| 500 | 600 | 16 |
| 600 | 700 | 7 |
| 700 | 800 | 6 |
| 800 | 900 | 13 |
| 900 | 1000 | 13 |
| 1000 | 1100 | 50 |
| 1100 | 1200 | 141 |
| 1200 | 1300 | 191 |
| 1300 | 1400 | 210 |
| 1400 | 1500 | 151 |
| 1500 | 1600 | 102 |
| 1600 | 1700 | 45 |
| 1700 | 1800 | 13 |
| 1800 | 1900 | 3 |
Embed this chart
Paste this HTML into your page: it carries the numbers and the credit link to this figure.
10 What happens when we redo the analysis?
The biggest step down is the last one. Using the authors’ own periods (we reproduce their Table S2 exactly), H. sapiens skulls average 1,458 to 1,475 cc from 50,000 to 11,700 years ago, 1,396 cc at 4,200 to 1,000 years (n = 30), 1,370 cc at 1,000 to 100 years (n = 40) and 1,297 cc in the last 100 years (n = 415). This is our calculation from their file.
Average skull volume of H. sapiens, period by period: lower in each later period
Revised 2023 file, H. sapiens up to 50,000 years ago: the average (dot) and its 95% interval (bar) for each period, with the number of skulls. The last 100 years average 1,297 cc (n = 415), 161 cc below the 136 skulls older than 11,700 years (95% interval 134 to 189).
Source: DeSilva et al. 2023, Data Sheet 1 [5] (periods as their Table S2, which we reproduce exactly); intervals by IQ Metrics
Data table
| label | low | estimate | high |
|---|---|---|---|
| 50,000 to 29,000 years ago (n = 15) | 1403 | 1475 | 1546 |
| 29,000 to 11,700 years ago (n = 104) | 1430 | 1458 | 1486 |
| 11,700 to 8,300 years ago (n = 41) | 1459 | 1509 | 1559 |
| 8,300 to 4,200 years ago (n = 28) | 1379 | 1439 | 1498 |
| 4,200 to 1,000 years ago (n = 30) | 1340 | 1396 | 1452 |
| 1,000 to 100 years ago (n = 40) | 1315 | 1370 | 1424 |
| Last 100 years (n = 415) | 1283 | 1297 | 1312 |
Embed this chart
Paste this HTML into your page: it carries the numbers and the credit link to this figure.
Leave out the last 100 years and the Holocene is 1,430 cc against 1,458 cc for the Pleistocene: 28 cc lower, with a 95% interval of -8 to +64, so not clearly different. But the 70 skulls dated 4,200 to 100 years ago average 1,381 cc, 78 cc under the Pleistocene (interval 33 to 122), and the 30 skulls at 4,200 to 1,000 years are 62 lower (interval 4 to 121). The earliest Holocene period (11,700 to 8,300 years) is high at 1,509 cc, and 25 of its 41 skulls are one Algerian site, the sample De Caro asked to remove [6].
What the authors' own revision changed, period by period
Average H. sapiens volume in each period in the 2021 file (as published) and in the 2023 file (after the critique). The big moves are in the thin periods: 4,200 to 1,000 years ago rises from 1,351 to 1,396 cc as skulls are added; 1,000 to 100 years ago falls from 1,530 (n = 11) to 1,370 (n = 40).
Average volume (cc); n = skulls in the 2021 / 2023 file
Source: DeSilva et al. 2021 [3] and 2023 [5] data files; averages by IQ Metrics
Data table
| period | 2021 file | 2023 revised file |
|---|---|---|
| 50,000 to 29,000 years ago (n = 16 / 15) | 1481 | 1475 |
| 29,000 to 11,700 years ago (n = 104 / 104) | 1458 | 1458 |
| 11,700 to 8,300 years ago (n = 41 / 41) | 1509 | 1509 |
| 8,300 to 4,200 years ago (n = 21 / 28) | 1484 | 1439 |
| 4,200 to 1,000 years ago (n = 48 / 30) | 1351 | 1396 |
| 1,000 to 100 years ago (n = 11 / 40) | 1530 | 1370 |
| Last 100 years (n = 578 / 415) | 1297 | 1297 |
Embed this chart
Paste this HTML into your page: it carries the numbers and the credit link to this figure.
Then the break date. We fitted a continuous line with one bend to H. sapiens skulls up to 50,000 years old (IQ Metrics calculation, simple: it knows nothing about collections, body size or region). On the 2021 file the best bend is 3,400 years ago (95% bootstrap interval 300 to 5,900), close to the paper’s 3,000. On the revised file it moves to 760 years ago (730 to 8,800). Leave the last-100-year skulls out and it is still 760 years (510 to 11,500). The fitted fall from bend to the youngest skulls is 130 to 240 cc across versions. What it does not show: a date.
When did the break happen? It depends on which skulls you keep (IQ Metrics calculation, simple)
A two-segment line fitted to H. sapiens skulls up to 50,000 years old; the dot is the best break date and the bar its 95% interval over 1,500 resamples of the skulls. On the 2021 file the break is 3,400 years ago; on the revised file it moves to 760 years ago; the bars overlap but are wide. Intervals ignore that skulls come in collections, so they are too narrow if anything.
Source: DeSilva et al. 2021 [3] and 2023 [5] data files; fit and bootstrap by IQ Metrics (data/analyse.py)
Data table
| label | low | estimate | high |
|---|---|---|---|
| 2021 file as published (n = 819) | 300 | 3370 | 5920 |
| 2021 file, at most 30 skulls per period (n = 819) | 300 | 3370 | 7460 |
| 2023 revised file (n = 673) | 730 | 760 | 8810 |
| 2023 file, at most 30 skulls per period (n = 673) | 760 | 760 | 11480 |
| 2023 file without the last-100-year skulls (n = 258) | 510 | 760 | 11480 |
Embed this chart
Paste this HTML into your page: it carries the numbers and the credit link to this figure.
Our reading, from the data alone: skulls under about 4,000 years old run smaller than Pleistocene skulls in these collections, by roughly 60 to 160 cc depending on the period and the reference; the data do not fix when it began, and they cannot say whether seven collections speak for everyone. Both papers’ conclusions are consistent with parts of that.
11 Why would human brains shrink?
No cause is settled. The 2021 paper says its dating does not support three older ideas: a by-product of smaller bodies, a shift to an agricultural diet, and self-domestication [3]. It notes that body size may have fallen several millennia before brain size, and cites Hawks (2011): a 5 kg fall in body mass would explain only 22 mL of the drop, which he found more than five times larger [3]. Its own proposal is group-level cognition: knowledge stored outside any one head. The 2023 reply adds that domestic mammals also lost brain volume over the last 10,000 years [5].
These are hypotheses about a drop whose size and timing are themselves disputed, so we do not rank them. If the drop is mostly the last 100 years, as our data suggest, changes in body size, diet and health over the 20th century are the obvious ones to test, and nothing in these files can.
12 Are human brains getting bigger again?
In one large study, yes: adults born in the 1970s have an intracranial volume 6.6% larger than those born in the 1930s (1,321 against 1,234 mL, 3,226 people scanned by MRI). The Framingham Heart Study found the rise in volume, white matter, hippocampus and cortical surface area, and suggested early-life conditions as the cause [7].
This does not contradict the skull data: it measures living adults in one US town, by a different method, over 40 birth years. It does show that average intracranial volume can differ between generations born decades apart, which the authors put down to early-life conditions. They note that IQ scores also rose across the 20th century, as in a century of rising IQ scores that has stalled in wealthy countries, though this study did not test the link [7]. For what changes in a brain across life, see at what age intelligence peaks and our data on peak ages.
Living adults: intracranial volume by birth decade, Framingham, 3,226 people
Average volume inside the skull of adults scanned by MRI between 1999 and 2019, adjusted for age at scan and sex. The 1930s and 1970s values and their 95% intervals are in the paper; the three decades between are our sums of its published increments. The 1970s are 87 mL (6.6%) above the 1930s.
Source: DeCarli et al. 2024, abstract and Table 2 [7]; decade values 1940s to 1960s summed by IQ Metrics
Data table
| label | value |
|---|---|
| Born in the 1930s (n = 532) | 1234 |
| Born in the 1940s (n = 777) | 1264 |
| Born in the 1950s (n = 904) | 1285.2 |
| Born in the 1960s (n = 872) | 1304.4 |
| Born in the 1970s (n = 136) | 1321 |
Embed this chart
Paste this HTML into your page: it carries the numbers and the credit link to this figure.
13 Does a bigger brain mean more intelligence?
Only weakly, among living people: across 88 imaging studies of 148 samples and more than 8,000 people the correlation between brain volume and IQ is r = 0.24 (R-squared 0.06), and the authors warn against treating brain size as a proxy for intelligence differences [8]. Squared, that is about 6% of the variation; 94% lies elsewhere. Our news page on the correlation works through the disputes about that number.
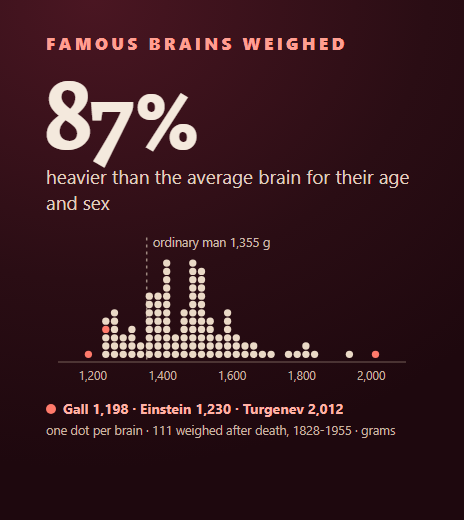
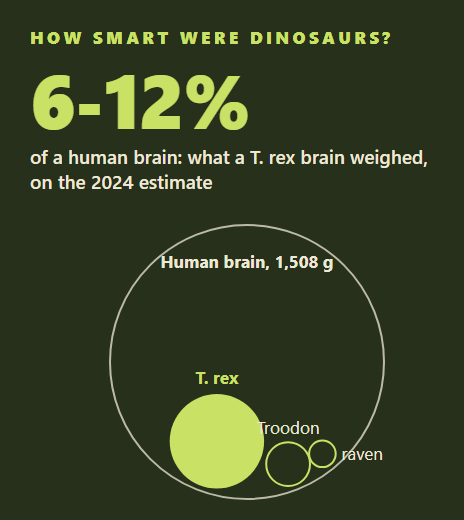
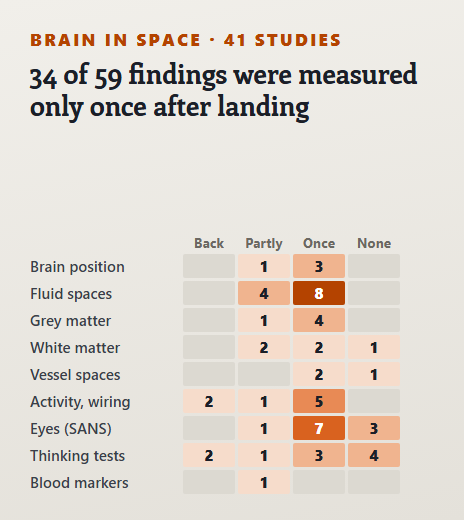
For this study it means two things. A 100 or 160 cc difference in average skull volume, about 8% to 11%, says nothing by itself about any ability, and nothing here compares people. And within our own data a skull is a skull: no skull has a test score, and even a living person’s score is a range, as the margin of error shows. Related reading: what MRI scans of gifted brains show, famous brains weighed, how smart were dinosaurs and what happens to the brain in space.
Brain size is a clue. Reasoning can be measured.
Our IQ test measures how you reason with patterns and places your result against adults, with a percentile.
Take the IQ test14 How accurate are the skull measurements?
Usually within a few tens of cc, but not always. For the 80 skulls listed in both Du et al. 2018 and the DeSilva files, the median gap is 12.9 cc and 70.0% are within 25 cc; 11.2% differ by more than 50 cc and 3 by 100 cc or more [1] [3]. Where Du et al. had several observers measure one skull, the range across observers was a median of 45.1 cc (up to 208.5 cc, for OH 7).
The same skull, two answers: where the compilations disagree most
Of the 80 skulls listed in both Du et al. 2018 (average of 1 to 6 observers) and the DeSilva et al. files, the median gap is 12.9 cc and 70.0% are within 25 cc; 3 differ by 100 cc or more. The 12 biggest gaps are shown.
Endocranial volume (cc)
Source: Du et al. 2018 [2]; DeSilva et al. 2021 and 2023 files [3] [5]; matching and gaps by IQ Metrics
Data table
| skull | Du et al. 2018 | DeSilva et al. 2021 / 2023 |
|---|---|---|
| ZKD V (H. erectus) | 1300 | 1140 |
| Yunxian (H. erectus) | 1150 | 1050 |
| Sangiran 12 (H. erectus) | 963 | 1059 |
| Buia (H. erectus) | 995 | 900 |
| Ceprano (H. heidelbergensis) | 1057 | 1150 |
| OH 7 (H. habilis) | 685 | 777 |
| Sts 19/58 (A. africanus) | 509 | 436 |
| KNM-ER 3733 (H. erectus) | 782 | 848 |
| Trinil 2 (H. erectus) | 901 | 940 |
| KNM-ER 1590 (H. rudolfensis) | 788 | 825 |
| Type 2 (A. africanus) | 494 | 457 |
| SK 1585 (P. robustus) | 494 | 530 |
Embed this chart
Paste this HTML into your page: it carries the numbers and the credit link to this figure.
For the shrinking-brain question this error is small: the claimed drop is 100 to 160 cc on averages of hundreds of skulls. It matters more for single species: one skull, such as Sahelanthropus, carries a range of 360 to 370 cc, Homo floresiensis 380 to 426 cc between papers, and the two Dmanisi skulls D2280 and D2282 are listed at 730 and 650 cc in one paper [12], 775 and 655 in another [3] and 650 and 780 in a 2026 dataset [11]. We keep every value in the CSV and say which one the page uses.
15 What is new in 2024 to 2026?
As of 3 November 2026 we found no paper that re-tests the 3,000-year claim after the 2024 commentary [6]. Related work: a 2024 PNAS analysis found that relative brain size rose within species across about 7 million years and accelerated in more recent lineages [10]; a 2023 review of endocranial volumes calls the recent shrinkage within Homo sapiens “dramatic” [9]; and the Framingham cohort above appeared in 2024 [7].
In 2025 two papers placed the Harbin cranium, whose endocranial capacity was estimated at about 1,420 ml in 2021 [16], in a Denisovan population, by proteins [17] and by mitochondrial DNA from dental calculus [18]. In June 2026 a dataset of 60 chimpanzee and 48 hominin volumes for a new Sts 25 estimate was released openly [11]; we use its chimpanzee values and have not read the article it accompanies.
16 Every specimen in our dataset
Every skull in the analysis set: 330 named skulls and 13 collections of recent skulls
Oldest first. Years ago = the date in the source file (three significant figures). Volume = endocranial volume in cc as used in our analysis (the 2023 file where the skull is in it, otherwise Du et al.'s average). A collection row gives the average of its skulls; the CSV lists every skull with all values and references.
| RUD 200 | Rudapithecus hungaricus | 9,850,000 | 234 | 1 | Gunz et al., 2020 |
| RUD 77 | Rudapithecus hungaricus | 9,850,000 | 326 | 1 | Begun |
| TM 266-01-060 | Sahelanthropus tchadensis | 7,000,000 | 365 | 1 | Falk |
| ARA-VP-6/500 | Ardipithecus ramidus | 4,400,000 | 300 | 1 | Suwa et al., 2009 |
| MRD-VP-1/1 | Australopithecus anamensis | 3,800,000 | 367 | 1 | Haile-Selassie et al., 2019 |
| AL 333-105 | Australopithecus afarensis | 3,220,000 | 372 | 1 | Holloway et al. 2004 |
| AL 162-28 | Australopithecus afarensis | 3,200,000 | 393 | 1 | Holloway, 1981 |
| AL 333-45 | Australopithecus afarensis | 3,200,000 | 488 | 1 | Gunz et al., 2020 |
| AL 288-1 | Australopithecus afarensis | 3,180,000 | 388 | 1 | Gunz et al., 2020 |
| AL 822-1 | Australopithecus afarensis | 3,100,000 | 382 | 1 | Gunz et al., 2020 |
| AL 444-2 | Australopithecus afarensis | 3,000,000 | 522 | 1 | Gunz et al., 2020 |
| Taung-1 | Australopithecus africanus | 2,800,000 | 428 | 1 | Holloway et al. 2004 |
| MLD 1 | Australopithecus africanus | 2,650,000 | 510 | 1 | Holloway et al., 2004 |
| MLD 37/38 | Australopithecus africanus | 2,650,000 | 430 | 1 | Holloway et al., 2004 |
| Bouri | Australopithecus garhi | 2,500,000 | 450 | 1 | Holloway et al., 2004 |
| KNM-WT 17000 | Paranthropus aethiopicus | 2,500,000 | 410 | 1 | Holloway et al., 2004 |
| Omo L388y-6 | Paranthropus boisei | 2,380,000 | 427 | 1 | Holloway et al., 2004 |
| Stw 505 | Australopithecus africanus | 2,350,000 | 555 | 1 | Holloway et al., 2004 |
| Omo 323-1976-896 | Paranthropus boisei | 2,230,000 | 490 | 1 | Brown et al., 1993 |
| Sts 19/58 | Australopithecus africanus | 2,100,000 | 436 | 1 | Holloway et al., 2004 |
| Sts 5 | Australopithecus africanus | 2,100,000 | 485 | 1 | Holloway et al., 2004 |
| Sts 60 | Australopithecus africanus | 2,100,000 | 400 | 1 | Holloway et al., 2004 |
| Sts 71 | Australopithecus africanus | 2,100,000 | 428 | 1 | Holloway et al., 2004 |
| Type 2 | Australopithecus africanus | 2,100,000 | 457 | 1 | Holloway et al., 2004 |
| DNH 155 | Paranthropus robustus | 2,000,000 | 450 | 1 | Martin et al., 2020 |
| SK 46 | Paranthropus robustus | 1,980,000 | 800 | 1 | Broom et al. 1952 |
| SK 48 | Paranthropus robustus | 1,980,000 | 750 | 1 | Broom et al. 1952 |
| SK 54 | Paranthropus robustus | 1,980,000 | 500 | 1 | Holloway et al. 2004 |
| SK 859 | Paranthropus robustus | 1,980,000 | 465 | 1 | Holloway et al. 2004 |
| MH 1 | Australopithecus sediba | 1,980,000 | 420 | 1 | Berger et al., 2010 |
| TM 1517 | Paranthropus robustus | 1,900,000 | 625 | 1 | Schepers 1946 |
| KNM-ER 1805 | Homo habilis | 1,890,000 | 582 | 1 | Holloway et al., 2004 |
| KNM-ER 1813 | Homo habilis | 1,890,000 | 509 | 1 | Holloway et al., 2004 |
| OH 24 | Homo habilis | 1,880,000 | 597 | 1 | Tobias, 1991 |
| KNM-ER 1470 | Homo rudolfensis | 1,880,000 | 752 | 1 | Holloway et al., 2004 |
| KNM-ER 3732 | Homo rudolfensis | 1,880,000 | 750 | 1 | Holloway et al., 2004 |
| KNM-ER 13750 | Paranthropus boisei | 1,870,000 | 475 | 1 | Holloway et al., 2004 |
| KNM-ER 23000 | Paranthropus boisei | 1,870,000 | 491 | 1 | Brown et al., 1993 |
| KNM-ER 1590 | Homo rudolfensis | 1,850,000 | 825 | 1 | Holloway et al., 2004 |
| KNM-ER 407 | Paranthropus boisei | 1,850,000 | 510 | 1 | Holloway et al., 2004 |
| OH 5 | Paranthropus boisei | 1,820,000 | 523 | 1 | Holloway et al., 2004 |
| OH 7 | Homo habilis | 1,800,000 | 777 | 1 | Tobias, 1991 |
| D2280 | Homo erectus | 1,770,000 | 775 | 1 | Rightmire et al., 2006 |
| D2282 | Homo erectus | 1,770,000 | 655 | 1 | Rightmire et al., 2006 |
| D2700 | Homo erectus | 1,770,000 | 600 | 1 | Rightmire et al., 2006 |
| D3444 | Homo erectus | 1,770,000 | 650 | 1 | Lordkipanidze et al., 2006 |
| D4500 | Homo erectus | 1,770,000 | 546 | 1 | Lordkipanidze et al., 2013 |
| KNM-WT 17400 | Paranthropus boisei | 1,770,000 | 400 | 1 | Holloway et al., 2004 |
| Drimolen | Paranthropus robustus | 1,750,000 | 530 | 1 | Schwartz & Tattersall |
| Sangiran 31 | Homo erectus | 1,700,000 | 700 | 1 | Tyler 1996 |
| OH 16 | Homo habilis | 1,670,000 | 638 | 1 | Tobias, 1991 |
| SK 1585 | Paranthropus robustus | 1,650,000 | 530 | 1 | Holloway et al., 2004 |
| Gongwang 1 | Homo erectus | 1,630,000 | 780 | 1 | Holloway et al., 2004 |
| KNM-ER 3733 | Homo erectus | 1,630,000 | 848 | 1 | Holloway, 1981 |
| Mojokerto 1 | Homo erectus | 1,620,000 | 800 | 1 | Anton 1997 |
| Sangiran 4 | Homo erectus | 1,620,000 | 908 | 1 | Holloway et al., 2004 |
| OH 13 | Homo habilis | 1,600,000 | 673 | 1 | Tobias, 1991 |
| KNM-ER 406 | Paranthropus boisei | 1,580,000 | 500 | 1 | Holloway et al., 2004 |
| KNM-ER 732 | Paranthropus boisei | 1,580,000 | 500 | 1 | Holloway et al., 2004 |
| KNM-ER 3883 | Homo erectus | 1,570,000 | 804 | 1 | Holloway et al., 2004 |
| DAN5 | Homo erectus | 1,550,000 | 598 | 1 | Semaw et al., 2020 |
| KNM-ER 42700 | Homo erectus | 1,550,000 | 691 | 1 | Spoor et al., 2007 |
| Sangiran 38 | Homo erectus | 1,520,000 | 850 | 1 | Indriati and Anton, 2010 |
| KNM-WT 15000 | Homo erectus | 1,490,000 | 880 | 1 | Begun & Walker, 1993 |
| Konso | Paranthropus boisei | 1,420,000 | 545 | 1 | Holloway et al., 2004 |
| Sangiran 10 | Homo erectus | 1,290,000 | 855 | 1 | Holloway et al., 2004 |
| Sangiran 12 | Homo erectus | 1,290,000 | 1,059 | 1 | Holloway et al., 2004 |
| Sangiran 17 | Homo erectus | 1,290,000 | 1,004 | 1 | Holloway, 1981 |
| Sangiran 2 | Homo erectus | 1,290,000 | 813 | 1 | Holloway, 1981 |
| BSN12/P1 | Homo erectus | 1,260,000 | 850 | 1 | Semaw et al., 2020 |
| Bukaran (SBK-1996.02) | Homo erectus | 1,250,000 | 916 | 1 | Grimaud-Herve et al., 2012 |
| Grogol-Wetan (Gwn-1993.09) | Homo erectus | 1,250,000 | 850 | 1 | Grimaud-Herve, pers comm |
| OH 9 | Homo erectus | 1,250,000 | 1,067 | 1 | Holloway et al., 2004 |
| Sangiran IX | Homo erectus | 1,250,000 | 870 | 1 | Kaifu et al., 2011 |
| Lantian | Homo erectus | 1,140,000 | 780 | 1 | Olivier and Tissier 1975 |
| Buia | Homo erectus | 1,000,000 | 900 | 1 | Macciarelli et al., 2004 |
| Daka | Homo erectus | 1,000,000 | 986 | 1 | Gilbert and Asfaw, 2008 |
| Yunxian | Homo erectus | 936,000 | 1,050 | 1 | Vialet et al., 2010 |
| Sangiran 3 | Homo erectus | 900,000 | 950 | 1 | Holloway et al., 2004 |
| Trinil 2 | Homo erectus | 900,000 | 940 | 1 | Holloway, 1981 |
| KNM-OL 45500 | Homo erectus | 882,000 | 715 | 1 | Potts et al. 2004 |
| Ceprano | Homo heidelbergensis | 850,000 | 1,150 | 1 | Bruner and Manzi, 2005 |
| ZKD III | Homo erectus | 730,000 | 915 | 1 | Weidenreich, 1943 |
| Zhoukodian Z-11 | Homo erectus | 730,000 | 1,015 | 1 | Weidenreich, 1943 |
| Zhoukodian Z-2 | Homo erectus | 730,000 | 1,030 | 1 | Weidenreich, 1943 |
| Zhoukodian Z10 | Homo erectus | 730,000 | 1,225 | 1 | Weidenreich, 1943 |
| Zhoukodian Z12 | Homo erectus | 730,000 | 1,030 | 1 | Weidenreich, 1943 |
| OH 12 | Homo erectus | 700,000 | 727 | 1 | Holloway et al., 2004 |
| Zhoukoudian VI | Homo erectus | 602,000 | 850 | 1 | Weidenreich 1943 |
| Nanjing | Homo erectus | 600,000 | 876 | 1 | Liu et al., 2005 |
| Bodo | Homo heidelbergensis | 600,000 | 1,250 | 1 | Conroy et al., 2000 |
| Ngawi | Homo erectus | 500,000 | 870 | 1 | Holloway et al., 2004 |
| Saldanha | Homo heidelbergensis | 500,000 | 1,225 | 1 | Tobias, 1971 |
| ZKD V | Homo erectus | 450,000 | 1,140 | 1 | Wu et al., 2010 |
| Arago | Homo heidelbergensis | 450,000 | 1,166 | 1 | Holloway et al., 2004 |
| Atapuerca 10 | Homo heidelbergensis | 430,000 | 1,218 | 1 | Arsuaga et al., 2014 |
| Atapuerca 12 | Homo heidelbergensis | 430,000 | 1,228 | 1 | Arsuaga et al., 2014 |
| Atapuerca 13 | Homo heidelbergensis | 430,000 | 1,437 | 1 | Arsuaga et al., 2014 |
| Atapuerca 15 | Homo heidelbergensis | 430,000 | 1,284 | 1 | Arsuaga et al., 2014 |
| Atapuerca 16 | Homo heidelbergensis | 430,000 | 1,236 | 1 | Arsuaga et al., 2014 |
| Atapuerca 17 | Homo heidelbergensis | 430,000 | 1,219 | 1 | Arsuaga et al., 2014 |
| Atapuerca 2 | Homo heidelbergensis | 430,000 | 1,334 | 1 | Arsuaga et al., 2014 |
| Atapuerca 4 | Homo heidelbergensis | 430,000 | 1,360 | 1 | Arsuaga et al., 2014 |
| Atapuerca 5 | Homo heidelbergensis | 430,000 | 1,092 | 1 | Arsuaga et al., 2014 |
| Atapuerca 7 | Homo heidelbergensis | 430,000 | 1,144 | 1 | Arsuaga et al., 2014 |
| Hexian | Homo erectus | 412,000 | 1,025 | 1 | Wu & Dong, 1982 |
| Ndutu | Homo heidelbergensis | 400,000 | 1,100 | 1 | Holloway in Rightmire, 1983 |
| Ngandong VI | Homo erectus | 344,000 | 1,097 | 1 | Holloway 1983 |
| Ngandong XII | Homo erectus | 344,000 | 1,145 | 1 | Grimaud-Herve et al. 2012 |
| Swanscombe | Homo heidelbergensis | 300,000 | 1,325 | 1 | Holloway et al., 2004 |
| Jebel Irhoud 1 | Homo sapiens | 300,000 | 1,305 | 1 | Holloway et al., 2004 |
| Jebel Irhoud 2 | Homo sapiens | 300,000 | 1,400 | 1 | Holloway et al., 2004 |
| Kabwe | Homo heidelbergensis | 299,000 | 1,325 | 1 | Holloway et al., 2004 |
| DH1/DH2 | Homo naledi | 286,000 | 560 | 1 | Garvin et al., 2017 |
| DH3/DH4 | Homo naledi | 286,000 | 465 | 1 | Garvin et al., 2017 |
| LES 1 | Homo naledi | 286,000 | 610 | 1 | Hawks et al., 2017 |
| Jinniushan | Homo heidelbergensis | 280,000 | 1,390 | 1 | Holloway et al., 2004 |
| Guomde | Homo heidelbergensis | 272,000 | 1,400 | 1 | Holloway et al., 2004 |
| Apidima 2 | Homo neanderthalensis | 252,000 | 1,454 | 1 | Harvarti et al., 2011 |
| Saccopastore 1 | Homo neanderthalensis | 250,000 | 1,174 | 1 | Bruner and Manzi, 2008 |
| Saccopastore 2 | Homo neanderthalensis | 250,000 | 1,300 | 1 | Holloway et al., 2004 |
| Sale | Homo heidelbergensis | 240,000 | 880 | 1 | Holloway et al., 2004 |
| Narmada | Homo heidelbergensis | 236,000 | 1,260 | 1 | Holloway et al., 2004 |
| Omo 2 (Kibbish) | Homo sapiens | 233,000 | 1,435 | 1 | Holloway et al., 2004 |
| Ehringsdorf | Homo heidelbergensis | 230,000 | 1,450 | 1 | Holloway et al., 2004 |
| Eliye Springs (KNM-ER 11693) | Homo heidelbergensis | 225,000 | 1,212 | 1 | Brauer et al., 1997 |
| Steinheim | Homo heidelbergensis | 225,000 | 1,140 | 1 | Prossinger et al., 2003 |
| Petralona | Homo heidelbergensis | 210,000 | 1,230 | 1 | Holloway et al., 2004 |
| Dali | Homo heidelbergensis | 209,000 | 1,120 | 1 | Holloway et al., 2004 |
| Reilingen | Homo neanderthalensis | 200,000 | 1,430 | 1 | Holloway et al., 2004 |
| Biache | Homo neanderthalensis | 175,000 | 1,200 | 1 | Holloway et al., 2004 |
| Fontechevade II | Homo neanderthalensis | 160,000 | 1,350 | 1 | Holloway et al., 2004 |
| Herto | Homo sapiens | 160,000 | 1,450 | 1 | Holloway et al., 2004 |
| La Chaise | Homo neanderthalensis | 150,000 | 1,065 | 1 | Holloway et al., 2004 |
| Harbin | Homo longi | 148,000 | 1,420 | 1 | Ji et al., 2021 |
| Singa 1 | Homo sapiens | 133,000 | 1,550 | 1 | Holloway et al., 2004 |
| Krapina 2 | Homo neanderthalensis | 130,000 | 1,450 | 1 | Holloway et al., 2004 |
| Krapina 3 | Homo neanderthalensis | 130,000 | 1,255 | 1 | Holloway et al., 2004 |
| Krapina 5 | Homo neanderthalensis | 130,000 | 1,535 | 1 | Caspari & Radovcic, 2006 |
| Krapina 6 (Cranium E) | Homo neanderthalensis | 130,000 | 1,205 | 1 | Holloway et al., 2004 |
| Lazaret | Homo neanderthalensis | 130,000 | 1,250 | 1 | Holloway et al., 2004 |
| Skhul 1 | Homo sapiens | 130,000 | 1,450 | 1 | Holloway et al., 2004 |
| Skhul 4 | Homo sapiens | 130,000 | 1,554 | 1 | Holloway et al., 2004 |
| Skhul 5 | Homo sapiens | 130,000 | 1,520 | 1 | Holloway et al., 2004 |
| Skhul 9 | Homo sapiens | 130,000 | 1,590 | 1 | Holloway et al., 2004 |
| Yingkou | Homo sapiens | 130,000 | 1,390 | 1 | Holloway et al., 2004 |
| Laetoli 18 | Homo sapiens | 120,000 | 1,367 | 1 | Holloway et al., 2004 |
| Xuchang 1 | Homo erectus | 115,000 | 1,800 | 1 | Li et al., 2017 |
| Ngandong (Solo 9) | Homo erectus | 110,000 | 1,135 | 1 | Holloway et al., 2004 |
| Ngandong 1 | Homo erectus | 110,000 | 1,172 | 1 | Holloway et al., 2004 |
| Ngandong 13 | Homo erectus | 110,000 | 1,231 | 1 | Holloway et al., 2004 |
| Ngandong 14 | Homo erectus | 110,000 | 1,090 | 1 | Holloway et al., 2004 |
| Ngandong 6 | Homo erectus | 110,000 | 1,251 | 1 | Holloway et al., 2004 |
| Ngandong 7 | Homo erectus | 110,000 | 1,028 | 1 | Balzeau et al., 2003 |
| Tabun 1 | Homo neanderthalensis | 110,000 | 1,271 | 1 | Holloway et al., 2004 |
| Qafzeh 11 | Homo sapiens | 110,000 | 1,280 | 1 | Holloway et al., 2004 |
| Qafzeh 6 | Homo sapiens | 110,000 | 1,568 | 1 | Holloway et al., 2004 |
| Qafzeh 9 | Homo sapiens | 110,000 | 1,531 | 1 | Holloway et al., 2004 |
| Ganovce | Homo neanderthalensis | 90,000 | 1,320 | 1 | Holloway et al., 2004 |
| Border Cave | Homo sapiens | 90,000 | 1,522 | 1 | Hughes, 1990 |
| La Ferrassie | Homo neanderthalensis | 70,000 | 1,640 | 1 | Holloway et al., 2004 |
| Spy 1 | Homo neanderthalensis | 68,000 | 1,305 | 1 | Holloway et al., 2004 |
| Spy 2 | Homo neanderthalensis | 68,000 | 1,553 | 1 | Holloway et al., 2004 |
| Liujiang | Homo sapiens | 67,000 | 1,567 | 1 | Wu et al., 2008 |
| La Quina 5 | Homo neanderthalensis | 65,000 | 1,172 | 1 | Holloway et al., 2004 |
| LB1 | Homo floresiensis | 60,000 | 419 | 1 | Falk |
| Shanidar 1 | Homo neanderthalensis | 60,000 | 1,600 | 1 | Holloway et al., 2004 |
| Shanidar 5 | Homo neanderthalensis | 60,000 | 1,550 | 1 | Holloway et al., 2004 |
| Sambungmacan 1 | Homo erectus | 55,000 | 1,035 | 1 | Baba et al., 2003 |
| Sambungmacan 3 | Homo erectus | 55,000 | 917 | 1 | Broadfield et al., 2001 |
| Sambungmacan 4 | Homo erectus | 55,000 | 1,006 | 1 | Baba et al., 2003 |
| Manot Cave | Homo sapiens | 54,700 | 1,100 | 1 | Hershkovitz et al., 2015 |
| Mt. Circeo | Homo neanderthalensis | 52,000 | 1,360 | 1 | Holloway et al., 2004 |
| Gibraltar | Homo neanderthalensis | 50,000 | 1,200 | 1 | Holloway et al., 2004 |
| La Chapelle | Homo neanderthalensis | 50,000 | 1,625 | 1 | Holloway et al., 2004 |
| Ryonggok 3 | Homo sapiens | 47,000 | 1,650 | 1 | Bae et al., 2010 |
| Ryonggok 7 | Homo sapiens | 47,000 | 1,450 | 1 | Bae et al., 2010 |
| Amud | Homo neanderthalensis | 41,000 | 1,740 | 1 | Holloway et al., 2004 |
| Le Moustier | Homo neanderthalensis | 41,000 | 1,565 | 1 | Holloway et al., 2004 |
| Neandertal | Homo neanderthalensis | 40,000 | 1,525 | 1 | Holloway et al., 2004 |
| Nazlet Khater 2 | Homo sapiens | 37,600 | 1,420 | 1 | Holloway et al., 2004 |
| Hofmeyr | Homo sapiens | 36,000 | 1,580 | 1 | Grine et al., 2010 |
| Chatelperron (les Fees) | Homo sapiens | 33,000 | 1,425 | 1 | Ivanhoe, 2010 |
| Wadjak 1 | Homo sapiens | 33,000 | 1,464 | 1 | Coon, 1962 |
| Wadjak 2 | Homo sapiens | 33,000 | 1,650 | 1 | many sources in Henn |
| Mladec 5 | Homo sapiens | 32,000 | 1,650 | 1 | Holloway et al., 2004 |
| Jingchuan | Homo sapiens | 31,500 | 1,524 | 1 | HaiJun et al., 2010 |
| Mladec 2 | Homo sapiens | 31,300 | 1,390 | 1 | Holloway et al., 2004 |
| Mladec 1 | Homo sapiens | 31,200 | 1,540 | 1 | Holloway et al., 2004 |
| Ziyang | Homo sapiens | 30,000 | 1,210 | 1 | Phenice & Sauer, 1977 |
| Zhoukoudian (Upper Cave) 1 | Homo sapiens | 29,000 | 1,500 | 1 | Holloway et al., 2004 |
| Zhoukoudian (Upper Cave) 2 | Homo sapiens | 29,000 | 1,380 | 1 | Holloway et al., 2004 |
| Zhoukoudian (Upper Cave) 3 | Homo sapiens | 29,000 | 1,290 | 1 | Holloway et al., 2004 |
| Cioclovina | Homo sapiens | 28,500 | 1,499 | 1 | Kranioti et al., 2011 |
| Combe Capelle | Homo sapiens | 28,000 | 1,570 | 1 | Holloway et al., 2004 |
| Cro-Magnon 1 | Homo sapiens | 27,700 | 1,730 | 1 | Holloway et al., 2004 |
| Cro-Magnon 2 | Homo sapiens | 27,700 | 1,402 | 1 | Helmuth, 1999 |
| Cro-Magnon 3 | Homo sapiens | 27,700 | 1,590 | 1 | Holloway et al., 2004 |
| Grotte des Infants 4 | Homo sapiens | 27,500 | 1,775 | 1 | Holloway et al., 2004 |
| Grotte des Infants 5 | Homo sapiens | 27,500 | 1,375 | 1 | Holloway et al., 2004 |
| Grotte des Infants 6 | Homo sapiens | 27,500 | 1,580 | 1 | Holloway et al., 2004 |
| Sungir 1 | Homo sapiens | 27,100 | 1,464 | 1 | Holloway et al., 2004 |
| Dolni Vestonice 13 | Homo sapiens | 26,600 | 1,481 | 1 | Franciscus & Vlcek, 2006 |
| Dolni Vestonice 14 | Homo sapiens | 26,600 | 1,538 | 1 | Franciscus & Vlcek, 2006 |
| Dolni Vestonice 15 | Homo sapiens | 26,600 | 1,378 | 1 | Franciscus & Vlcek, 2006 |
| Brno I | Homo sapiens | 26,000 | 1,600 | 1 | Holloway et al., 2004 |
| Brno III | Homo sapiens | 26,000 | 1,304 | 1 | Holloway et al., 2004 |
| Dolni Vestonice 3 | Homo sapiens | 26,000 | 1,285 | 1 | Franciscus & Vlcek, 2006 |
| Pavlov 1 | Homo sapiens | 26,000 | 1,472 | 1 | Franciscus & Vlcek, 2006 |
| Predmosti 10 | Homo sapiens | 26,000 | 1,452 | 1 | Holloway et al., 2004 |
| Predmosti 3 | Homo sapiens | 26,000 | 1,580 | 1 | Holloway et al., 2004 |
| Predmosti 4 | Homo sapiens | 26,000 | 1,250 | 1 | Holloway et al., 2004 |
| Predmosti 9 | Homo sapiens | 26,000 | 1,555 | 1 | Holloway et al., 2004 |
| Sungir 3 | Homo sapiens | 26,000 | 1,361 | 1 | Holloway et al., 2004 |
| WLH 50 | Homo sapiens | 26,000 | 1,540 | 1 | Kubo and Kono, 2011 |
| Dolni Vestonice 16 | Homo sapiens | 25,600 | 1,547 | 1 | Franciscus & Vlcek, 2006 |
| Barma Grande II | Homo sapiens | 24,800 | 1,748 | 1 | Parenti, 1973 |
| Sungir 5 | Homo sapiens | 24,000 | 1,453 | 1 | Holloway et al., 2004 |
| Veyrier 1 | Homo sapiens | 24,000 | 1,430 | 1 | Holloway et al., 2004 |
| Kostenki 2 | Homo sapiens | 23,800 | 1,605 | 1 | Holloway et al., 2004 |
| Sungir 2 | Homo sapiens | 23,800 | 1,267 | 1 | Holloway et al., 2004 |
| Brno II | Homo sapiens | 23,700 | 1,500 | 1 | Holloway et al., 2004 |
| Arene Candide 1-IP | Homo sapiens | 23,400 | 1,490 | 1 | Ruff et al., 1997 |
| Kostenki 14 | Homo sapiens | 22,800 | 1,222 | 1 | Holloway et al., 2004 |
| Mollet III | Homo sapiens | 22,300 | 1,521 | 1 | Soler et al., 2013 |
| Abri Pataud 1 | Homo sapiens | 22,000 | 1,380 | 1 | Holloway et al., 2004 |
| Roc de Sers | Homo sapiens | 19,200 | 1,380 | 1 | Ivanhoe, 2010 |
| Roc de Sers | Homo sapiens | 19,200 | 1,485 | 1 | Ivanhoe, 2010 |
| Cohuna | Homo sapiens | 19,000 | 1,447 | 1 | Brown, website |
| Minatogawa 1 | Homo sapiens | 18,300 | 1,335 | 1 | Kubo & Kono, 2011 |
| Minatogawa 2 | Homo sapiens | 18,300 | 1,170 | 1 | Holloway et al., 2004 |
| Minatogawa 4 | Homo sapiens | 18,300 | 1,170 | 1 | Kubo & Kono, 2011 |
| Le Placard | Homo sapiens | 18,000 | 1,300 | 1 | Ivanhoe, 2010 |
| Rond-du-Barry 8 | Homo sapiens | 17,100 | 1,515 | 1 | Ivanhoe, 2010 |
| Collection: Taforalt, Morocco/Algeria (Epipalaeolithic site) | Homo sapiens | 16,800 | 1,572 | 18 | Average of 18 skulls (range 1,279 to 1,738 cc); Ferembach, 1965 |
| Taza, Algeria | Homo sapiens | 16,000 | 1,125 | 1 | Meier et al., 2003 |
| St. Germain-la-Riviere | Homo sapiens | 15,800 | 1,354 | 1 | Movius, 1975 |
| Bruniquel 2 | Homo sapiens | 15,300 | 1,555 | 1 | Movius, 1975 |
| Chancelade | Homo sapiens | 15,300 | 1,530 | 1 | Holloway et al., 2004 |
| Cap Blanc 1 | Homo sapiens | 15,000 | 1,434 | 1 | Movius, 1975 |
| Mas d’Azil | Homo sapiens | 14,000 | 1,275 | 1 | Movius, 1975 |
| San Teodoro 1 | Homo sapiens | 14,000 | 1,565 | 1 | Holloway et al., 2004 |
| San Teodoro 2 | Homo sapiens | 14,000 | 1,569 | 1 | Holloway et al., 2004 |
| San Teodoro 3 | Homo sapiens | 14,000 | 1,560 | 1 | Holloway et al., 2004 |
| San Teodoro 5 | Homo sapiens | 14,000 | 1,484 | 1 | Holloway et al., 2004 |
| Collection: Coobool Creek, Australia (Holocene skeletal collection) | Homo sapiens | 14,000 | 1,386 | 24 | Average of 24 skulls (range 1,117 to 1,541 cc); Brown, website |
| MLDG, China | Homo sapiens | 13,900 | 1,327 | 1 | Curnoe et al., 2012 |
| Les Hoteaux | Homo sapiens | 13,000 | 1,403 | 1 | Ivanhoe, 2010 |
| Ortucchio 1 | Homo sapiens | 12,600 | 1,302 | 1 | Ivanhoe, 2010 |
| Oberkassel 2 | Homo sapiens | 12,200 | 1,370 | 1 | Movius, 1975 |
| Keilor | Homo sapiens | 12,000 | 1,497 | 1 | Brown, website |
| Laugerie-Basse | Homo sapiens | 12,000 | 1,505 | 1 | Ivanhoe, 2010 |
| Arene Candide 1 | Homo sapiens | 11,800 | 1,414 | 1 | Ruff et al., 1997 |
| Arene Candide 2 | Homo sapiens | 11,800 | 1,424 | 1 | Ruff et al., 1997 |
| Arene Candide 4 | Homo sapiens | 11,800 | 1,520 | 1 | Ruff et al., 1997 |
| Arene Candide 5 | Homo sapiens | 11,800 | 1,661 | 1 | Ruff et al., 1997 |
| Le Bichon 1 | Homo sapiens | 11,700 | 1,465 | 1 | Ivanhoe, 2010 |
| Oberkassel 1 | Homo sapiens | 11,600 | 1,500 | 1 | Holloway et al., 2004 |
| Collection: Afalou, Algeria (Epipalaeolithic site) | Homo sapiens | 11,500 | 1,540 | 25 | Average of 25 skulls (range 1,154 to 1,774 cc); Vallois, 1952 |
| Nacurrie | Homo sapiens | 11,400 | 1,597 | 1 | Brown, website |
| Moča | Homo sapiens | 11,300 | 1,277 | 1 | Sefcakova et al., 2011 |
| Cheix | Homo sapiens | 11,000 | 1,470 | 1 | Ivanhoe, 2010 |
| Duruthy | Homo sapiens | 11,000 | 1,140 | 1 | Movius, 1975 |
| Tuinplaas | Homo sapiens | 11,000 | 1,589 | 1 | Hughes, 1990 |
| Naivasha | Homo sapiens | 10,800 | 1,453 | 1 | Tobias, 1971 |
| Aveline’s Hole, Somerset | Homo sapiens | 10,300 | 1,450 | 1 | Palmer, 1959 |
| Boskop | Homo sapiens | 10,000 | 1,650 | 1 | Tobias, 1971 |
| Mai Da Nuoc | Homo sapiens | 10,000 | 1,430 | 1 | Cuong, 1987 |
| Tepaxpan | Homo sapiens | 10,000 | 1,540 | 1 | Phenice & Sauer, 1977 |
| Hotu 2 | Homo sapiens | 9,300 | 1,404 | 1 | Angel, 1952 |
| Hotu 3 | Homo sapiens | 9,300 | 1,440 | 1 | Angel, 1952 |
| Culoz I | Homo sapiens | 9,000 | 1,535 | 1 | Ferembach 1974b |
| Culoz II | Homo sapiens | 9,000 | 1,644 | 1 | Ferembach 1974b |
| M4300, Bass Strait | Homo sapiens | 9,000 | 1,265 | 1 | Murray et al., 1982 |
| Gamble’s Cave 4 | Homo sapiens | 8,200 | 1,470 | 1 | Tobias, 1971 |
| Gamble’s Cave 5 | Homo sapiens | 8,200 | 1,530 | 1 | Tobias, 1971, Leakey, 1935 |
| Gramat | Homo sapiens | 8,000 | 1,861 | 1 | Ferembach 1974b |
| Mai Da Dieu | Homo sapiens | 8,000 | 1,271 | 1 | Cuong, 1986 |
| Teviec 16 | Homo sapiens | 8,000 | 1,428 | 1 | Balzeau, PC |
| Teviec 8 | Homo sapiens | 8,000 | 1,430 | 1 | Balzeau, PC |
| Teviec 9 | Homo sapiens | 8,000 | 1,420 | 1 | Balzeau, PC |
| Rastel | Homo sapiens | 7,500 | 1,682 | 1 | Ferembach 1974b |
| Song Terus | Homo sapiens | 7,500 | 1,570 | 1 | Balzeau, PC |
| Fish Hoek 1 | Homo sapiens | 7,200 | 1,600 | 1 | Drennen, 1929 |
| Oakhurst 2 | Homo sapiens | 7,120 | 1,410 | 1 | Drennan, 1937 |
| Haverty 5, CA | Homo sapiens | 7,000 | 1,380 | 1 | Brooks et al., 1990 |
| Haverty 7, CA | Homo sapiens | 7,000 | 1,310 | 1 | Brooks et al., 1990 |
| Lake Nitchie | Homo sapiens | 7,000 | 1,510 | 1 | Brown, website |
| Montclus | Homo sapiens | 7,000 | 1,687 | 1 | Ferembach 1974b |
| Plettenberg Bay | Homo sapiens | 7,000 | 1,350 | 1 | this study |
| Punin | Homo sapiens | 7,000 | 1,275 | 1 | Phenice & Sauer, 1977 |
| Oakhurst 1 | Homo sapiens | 6,180 | 1,403 | 1 | Drennan, 1937 |
| Oakhurst 3 | Homo sapiens | 5,990 | 1,195 | 1 | Drennan, 1937 |
| Oakhurst 15 | Homo sapiens | 5,700 | 1,214 | 1 | Drennan, 1937 |
| Lansing | Homo sapiens | 5,500 | 1,538 | 1 | Hrdlicka, 1903 |
| Collection: Columnata, Algeria (Epipalaeolithic site) | Homo sapiens | 5,500 | 1,425 | 3 | Average of 3 skulls (range 1,351 to 1,498 cc); Chamla, 1970 |
| Oakhurst 8b | Homo sapiens | 5,450 | 1,247 | 1 | Drennan, 1937 |
| Oakhurst 13 | Homo sapiens | 5,330 | 1,290 | 1 | Drennan, 1937 |
| Asselar | Homo sapiens | 5,000 | 1,520 | 1 | Tobias, 1971 |
| Hutton, Somerset | Homo sapiens | 5,000 | 1,415 | 1 | Palmer, 1959 |
| Oakhurst 5 | Homo sapiens | 4,100 | 1,389 | 1 | Drennan, 1937 |
| Urtiaga A | Homo sapiens | 3,500 | 1,510 | 1 | Ferembach 1974b |
| Urtiaga B | Homo sapiens | 3,500 | 1,579 | 1 | Ferembach 1974b |
| Sauveterre | Homo sapiens | 3,400 | 1,769 | 1 | Ferembach 1974b |
| Byneskranskop II | Homo sapiens | 3,190 | 1,270 | 1 | this study |
| Byneskranskop I | Homo sapiens | 3,120 | 1,270 | 1 | this study |
| Danes’ Graves 1 | Homo sapiens | 2,250 | 1,325 | 1 | Wright, 1903 |
| Danes’ Graves 7 | Homo sapiens | 2,250 | 1,325 | 1 | Wright, 1903 |
| Elmenteita B | Homo sapiens | 2,000 | 1,585 | 1 | Hughes, 1990 |
| Glastonbury, Somerset | Homo sapiens | 2,000 | 1,468 | 1 | Palmer, 1959 |
| Langwith, Derbyshire | Homo sapiens | 2,000 | 1,250 | 1 | Gladstone, 1921 |
| Loulan | Homo sapiens | 1,750 | 1,265 | 1 | Keith, 1929 |
| Loulan LT 03 | Homo sapiens | 1,750 | 1,230 | 1 | Keith, 1929 |
| Niya | Homo sapiens | 1,700 | 1,140 | 1 | Keith, 1929 |
| Broederstroom | Homo sapiens | 1,330 | 1,232 | 1 | De Villiers via Henneberg |
| Kafue I | Homo sapiens | 1,330 | 1,436 | 1 | Gabel, 1962 |
| Kafue II | Homo sapiens | 1,330 | 1,559 | 1 | Gabel, 1962 |
| Kafue III | Homo sapiens | 1,330 | 1,340 | 1 | Gabel, 1962 |
| Kafue VI | Homo sapiens | 1,330 | 1,362 | 1 | Gabel, 1962 |
| Kafue XIV | Homo sapiens | 1,330 | 1,508 | 1 | Gabel, 1962 |
| Soutpansberg | Homo sapiens | 1,310 | 1,464 | 1 | Steyn and Loots via Henneberg |
| Collection: Bambandyanalo (K2/Mapungubwe), South Africa | Homo sapiens | 1,060 | 1,408 | 7 | Average of 7 skulls (range 1,280 to 1,565 cc); Galloway, 1959 |
| Gold Mines (Zimbabwe) | Homo sapiens | 1,020 | 1,161 | 1 | Keith, 1924 via Henneberg |
| Mupungubue | Homo sapiens | 1,000 | 1,591 | 1 | Galloway, 1937 |
| Dias Negress | Homo sapiens | 990 | 1,535 | 1 | Winkler & Holler, 1988 |
| Bristol 1 | Homo sapiens | 750 | 1,526 | 1 | Bedde, 1907 |
| Bristol 10 | Homo sapiens | 750 | 1,688 | 1 | Bedde, 1907 |
| Bristol 11 | Homo sapiens | 750 | 1,655 | 1 | Bedde, 1907 |
| Bristol 2 | Homo sapiens | 750 | 1,859 | 1 | Bedde, 1907 |
| Bristol 3 | Homo sapiens | 750 | 1,381 | 1 | Bedde, 1907 |
| Bristol 4 | Homo sapiens | 750 | 1,608 | 1 | Bedde, 1907 |
| Bristol 7 | Homo sapiens | 750 | 1,390 | 1 | Bedde, 1907 |
| Bristol 9 | Homo sapiens | 750 | 1,422 | 1 | Bedde, 1907 |
| Collection: Pecos Pueblo, New Mexico (archaeological site) | Homo sapiens | 500 | 1,308 | 29 | Average of 29 skulls (range 1,030 to 1,550 cc); Ruff et al., 1997 |
| Paderborne | Homo sapiens | 250 | 1,541 | 1 | Ruff et al., 1997 |
| Cape Flats | Homo sapiens | 150 | 1,230 | 1 | Drennen, 1929 |
| Collection: China (museum and excavation samples) | Homo sapiens | 100 | 1,445 | 54 | Average of 54 skulls (range 1,188 to 1,776 cc); Brown |
| Collection: India (anatomical samples, Manjunath 2002) | Homo sapiens | 100 | 1,181 | 50 | Average of 50 skulls (range 975 to 1,425 cc); Manjunath |
| Collection: Murray River valley, Australia (Holocene skeletal collection) | Homo sapiens | 100 | 1,215 | 91 | Average of 91 skulls (range 996 to 1,432 cc); Brown |
| Collection: Northern China (museum samples) | Homo sapiens | 100 | 1,370 | 37 | Average of 37 skulls (range 1,140 to 1,600 cc); Brown |
| Collection: Spitalfields, London (crypt burials) | Homo sapiens | 100 | 1,294 | 39 | Average of 39 skulls (range 1,005 to 1,565 cc); Brown |
| Collection: Swanport, Murray River, Australia (Holocene skeletal collection) | Homo sapiens | 100 | 1,209 | 50 | Average of 50 skulls (range 1,020 to 1,535 cc); Brown |
| Collection: Terry anatomical collection (United States) | Homo sapiens | 100 | 1,373 | 94 | Average of 94 skulls (range 1,046 to 1,724 cc); Copes |
Source: DeSilva et al. 2021 and 2023 files [3] [5]; Du et al. 2018 [2]; skulls matched by IQ Metrics
17 How we built the dataset
- 01
- 02
Match skulls
We matched rows by species and name, with a short list of known renamings, so a skull in two files is one row: 675 of the 2021 and 2023 rows are the same skull, and 80 of Du et al.’s 94 are in the DeSilva files. Ngandong skull numbers differ between papers and are matched only on an equal first value.
- 03
Choose one value
The analysis uses the 2023 value where the skull is in that file, otherwise the 2021 value, otherwise Du et al.’s mean. Every source value stays in the CSV.
- 04
Reproduce before adding
Our 2023-file periods give the authors’ Table S2 counts and averages exactly for all nine epochs, and the 2021 file gives their counts of 578 skulls in the last 100 years and 1,297 cc. We added no skull of our own.
- 05
Calculate and label
Means, quartiles, Welch intervals and the bootstrap fit are scripted (data/analyse.py) and labelled “IQ Metrics calculation”. Every number taken from a paper’s text is checked against the cached text by data/verify_quotes.py (95 checks).
Read every number with these in mind
- A skull is not a brain. Volume inside the skull is a little larger than the brain, and living MRI volumes and skull volumes are different measurements.
- Brain size is not intelligence, and no skull here has a test score. Nothing on this page compares people or groups.
- The skulls are a convenience sample from museum and anatomical collections: seven of them make up the last 100 years. They are not a random draw of people.
- Dates are as given in the source files; recent collections are all set to “100 years ago”. Ages of fossils carry ranges we do not show.
- We have not re-measured any skull or re-read the original publications of each specimen. Where the 2021 and 2023 files disagree on a value, the 2023 value is used.
- The break-date fit is simple and treats skulls as independent; collections are clusters, so the intervals are too narrow. It is a replication of the debate, not a new result.
- Single skulls stand for whole species: Sahelanthropus, Ardipithecus and Homo floresiensis are one skull each.
- Body size is not in these files, so we cannot say whether brains shrank relative to bodies.
- The 2021 file labels Xuchang 1 (1,800 cc) as Homo erectus and Dmanisi skulls as Homo erectus too, as the source does; taxonomy is disputed.
Sources
- Proceedings of the Royal Society B 2018. Data: 94 fossil crania, 13 species (splitters' taxonomy). Accessed 3 Nov 2026. Du, A., Zipkin, A. M., Hatala, K. G., Renner, E., Baker, J., Bianchi, S., Bernal, K. & Wood, B. A. Pattern and process in hominin brain size evolution are scale-dependent. Proceedings of the Royal Society B 285(1873), 20172738. 2018. doi.org/10.1098/rspb.2017.2738Paper: facts cited. Data CC0 (Dryad) and CC BY (the same file on figshare)
- Dryad, 2018. Same file as figshare 10.6084/m9.figshare.5873232 (rspb20172738_si_002.xlsx, md5 4915901112f5e69849eeed3defe56a2f). Accessed 3 Nov 2026. Du, A. et al. Data from: Pattern and process in hominin brain size evolution are scale-dependent. Dryad dataset, doi:10.5061/dryad.c30g9. 2018. doi.org/10.5061/dryad.c30g9CC0 (Dryad); CC BY (figshare copy)
- Frontiers in Ecology and Evolution, 22 Oct 2021. Supplementary Table_1.XLSX (987 rows). Accessed 3 Nov 2026. DeSilva, J. M., Traniello, J. F. A., Claxton, A. G. & Fannin, L. D. When and why did human brains decrease in size? A new change-point analysis and insights from brain evolution in ants. Frontiers in Ecology and Evolution 9, 742639. 2021. doi.org/10.3389/fevo.2021.742639CC BY 4.0
- Frontiers in Ecology and Evolution, 29 Jul 2022 (Opinion). Accessed 3 Nov 2026. Villmoare, B. & Grabowski, M. Did the transition to complex societies in the Holocene drive a reduction in brain size? A reassessment of the DeSilva et al. (2021) hypothesis. Frontiers in Ecology and Evolution 10, 963568. 2022. doi.org/10.3389/fevo.2022.963568CC BY 4.0
- Frontiers in Ecology and Evolution, 22 Jun 2023 (Perspective): the authors' reply. Data Sheet 1 (837 rows), Tables S1 and S2. Accessed 3 Nov 2026. DeSilva, J., Fannin, L., Cheney, I., Claxton, A., Ilies, I., Kittelberger, J., Stibel, J. & Traniello, J. Human brains have shrunk: the questions are when and why. Frontiers in Ecology and Evolution 11, 1191274. 2023. doi.org/10.3389/fevo.2023.1191274CC BY 4.0
- Frontiers in Ecology and Evolution, 11 Apr 2024 (General Commentary). Accessed 3 Nov 2026. De Caro, L. Commentary: Human brains have shrunk: the questions are when and why. Frontiers in Ecology and Evolution 12, 1368347. 2024. doi.org/10.3389/fevo.2024.1368347CC BY 4.0
- JAMA Neurology, May 2024 (PMC10964161). Table 2 and abstract. Accessed 3 Nov 2026. DeCarli, C., Maillard, P., Pase, M. P., Beiser, A. S., Kojis, D., Satizabal, C. L. et al. Trends in intracranial and cerebral volumes of Framingham Heart Study participants born 1930 to 1970. JAMA Neurology 81(5), 471. 2024. doi.org/10.1001/jamaneurol.2024.0469CC BY (open access); facts and numbers cited
- Neuroscience and Biobehavioral Reviews, 2015. The paper the live IQ Metrics news page uses; abstract read via Europe PMC. Accessed 3 Nov 2026. Pietschnig, J., Penke, L., Wicherts, J. M., Zeiler, M. & Voracek, M. Meta-analysis of associations between human brain volume and intelligence differences: how strong are they and what do they mean? Neuroscience and Biobehavioral Reviews 57, 411-432. 2015. doi.org/10.1016/j.neubiorev.2015.09.017Facts cited (abstract)
- F1000Research, 30 May 2023 (review). Table 1: species means from Holloway et al. 2004. Accessed 3 Nov 2026. Tattersall, I. Endocranial volumes and human evolution. F1000Research 12, 565. 2023. doi.org/10.12688/f1000research.131636.1CC BY 4.0
- PNAS, 26 Nov 2024. Accessed 3 Nov 2026. Puschel, T. A., Nicholson, S. L., Baker, J., Barton, R. A. & Venditti, C. Hominin brain size increase has emerged from within-species encephalization. Proceedings of the National Academy of Sciences 121(49), e2409542121. 2024. doi.org/10.1073/pnas.2409542121CC BY 4.0
- Mendeley Data, 13 Jun 2026, Appendix Table A1 (60 chimpanzee skulls + 48 hominin crania). Related article: Nature & Anthropology 2026 (not read). Accessed 3 Nov 2026. McCarthy, R. & Haque, S. Data/code for: Endocranial volume estimates for Sts 25 (Australopithecus cf. africanus). Mendeley Data, V1, doi:10.17632/n4k25sbv9k.1. 2026. doi.org/10.17632/n4k25sbv9k.1CC BY 4.0
- eLife, 9 May 2017. Table 4 (species means and key specimens). Accessed 3 Nov 2026. Hawks, J., Elliott, M., Schmid, P., Churchill, S. E. et al. New fossil remains of Homo naledi from the Lesedi Chamber, South Africa. eLife 6, e24232. 2017. doi.org/10.7554/eLife.24232CC BY 4.0
- eLife, 10 Sep 2015. Accessed 3 Nov 2026. Berger, L. R., Hawks, J., de Ruiter, D. J., Churchill, S. E. et al. Homo naledi, a new species of the genus Homo from the Dinaledi Chamber, South Africa. eLife 4, e09560. 2015. doi.org/10.7554/eLife.09560CC BY 4.0
- Science, 18 Oct 2013. Abstract read. Accessed 3 Nov 2026. Lordkipanidze, D., Ponce de Leon, M. S., Margvelashvili, A., Rak, Y., Rightmire, G. P., Vekua, A. & Zollikofer, C. P. E. A complete skull from Dmanisi, Georgia, and the evolutionary biology of early Homo. Science 342(6156), 326-331. 2013. doi.org/10.1126/science.1238484Facts cited (abstract)
- Nature, 28 Oct 2004. Abstract read. Accessed 3 Nov 2026. Brown, P., Sutikna, T., Morwood, M. J., Soejono, R. P., Jatmiko, Saptomo, E. W. & Due, R. A. A new small-bodied hominin from the Late Pleistocene of Flores, Indonesia. Nature 431, 1055-1061. 2004. doi.org/10.1038/nature02999Facts cited (abstract)
- The Innovation, Aug 2021 (PMC8454552). Accessed 3 Nov 2026. Ji, Q., Wu, W., Ji, Y., Li, Q. & Ni, X. Late Middle Pleistocene Harbin cranium represents a new Homo species. The Innovation 2(3), 100132. 2021. doi.org/10.1016/j.xinn.2021.100132CC BY-NC-ND 4.0; facts cited
- Science, 14 Aug 2025 (abstract read). Accessed 3 Nov 2026. Fu, Q., Bai, F., Rao, H., Chen, S., Ji, Y., Liu, A., Bennett, E. A., Liu, F. & Ji, Q. The proteome of the late Middle Pleistocene Harbin individual. Science 389(6761), 704-707. 2025. doi.org/10.1126/science.adu9677Facts cited (abstract)
- Cell, July 2025 (abstract read; open access). Accessed 3 Nov 2026. Fu, Q., Cao, P., Dai, Q., Bennett, E. A., Feng, X., Yang, M. A., Ping, W., Paabo, S. & Ji, Q. Denisovan mitochondrial DNA from dental calculus of the >146,000-year-old Harbin cranium. Cell 188(15), 3919-3926. 2025. doi.org/10.1016/j.cell.2025.05.040CC BY 4.0
Version history
- 2026.113 November 2026First release. Next update: when a paper re-tests the 3,000-year claim, or on 1 November 2027 with new data files.
Leon Falkner, Data & Research Analyst. Leon owns the arithmetic on IQ Metrics: the percentile tables, the score converter and the figures in everyone else's drafts. On the research desk Leon pulls the data, builds each index and writes the method. More about Leon.
Questions
Are human brains shrinking?
Possibly: skulls from the last 100 years average 1,297 cc against 1,458 cc before 11,700 years ago, and 19 earlier studies report a decrease averaging 8.5%. A 2022 reanalysis found no significant change once the sample was rebalanced, so the question is open.
How big was the brain of our earliest ancestors?
About 360 to 370 cc in Sahelanthropus tchadensis, a single skull from about 7 million years ago, level with the 367 cc average of chimpanzees. Australopiths averaged 440 cc across 18 skulls.
What is human brain size over time?
It rose from about 365 cc at 7 million years ago to 932 cc in Homo erectus, 1,388 in Neanderthals and 1,458 in Late Pleistocene Homo sapiens, then 1,297 cc in skulls from the last 100 years.
How big was a Neanderthal brain?
Neanderthal skulls average 1,388 cc across 26 skulls, up to about 1,740 cc, 85 cc more than modern H. sapiens skulls in the same data (1,304 cc), and about the same as Late Pleistocene Homo sapiens.
How smart were Neanderthals?
Skull size alone cannot say. Neanderthals had an average of 1,388 cc, within the modern range, but in living people brain volume explains only about 6% of IQ differences (r = 0.24, 88 studies).
What is the average human brain size in cubic centimetres?
About 1,300 to 1,370 cc depending on the sample: 1,304 cc for 455 museum and anatomical skulls, 1,349 cc for 5,288 skulls in a global survey, 1,371 cc in MRI scans of 2,717 adults.
What is endocranial volume?
The space inside the braincase, measured on a skull or a scan in cubic centimetres (the same as millilitres). It is slightly larger than the brain, and it is the standard measure for fossil skulls, such as the 546 cc Dmanisi skull D4500.
Did human brains shrink 3,000 years ago?
A 2021 paper put the break at 3,000 years ago; a 2022 reanalysis found no significant break; a 2023 reply found a drop of 159 cc after 3,000 years. A simple two-segment fit by IQ Metrics gives 3,400 years ago on the 2021 data and 760 on the revised data.
Are human brains getting bigger again?
In one study of 3,226 adults, intracranial volume by MRI was 6.6% larger for people born in the 1970s than the 1930s (1,321 against 1,234 mL). It measures living adults, not skulls, so it does not settle the skull question.
Does a bigger brain mean a higher IQ?
Weakly: across 88 studies of more than 8,000 people the correlation between brain volume and IQ is 0.24, about 6% of the variation in scores. It cannot rank two people.
Share it, cite it, download it
You may reuse everything on this page under CC BY 4.0: in articles, reports, lessons and posts. The one condition is credit to IQ Metrics with a link to this page.
Cite this study
Version 2026.11. Citing the version lets readers find the exact numbers.
Archived copy with a DOI: 10.5281/zenodo.23909338 (report PDF and data on Zenodo).
Falkner, L. (2026). Are human brains shrinking? Every measured skull, 7 million years (Version 2026.11) [Data set]. IQ Metrics Research. https://iqmetrics.org/research/are-human-brains-shrinking/ (DOI: 10.5281/zenodo.23909338)
Falkner, Leon. "Are human brains shrinking? Every measured skull, 7 million years." IQ Metrics Research, 3 Nov. 2026, iqmetrics.org/research/are-human-brains-shrinking/. DOI: 10.5281/zenodo.23909338.
Falkner, Leon. "Are human brains shrinking? Every measured skull, 7 million years." IQ Metrics Research. November 3, 2026. https://iqmetrics.org/research/are-human-brains-shrinking/. DOI: 10.5281/zenodo.23909338.
@misc{iqmetrics2026arehumanbrainsshrinking, author = {Falkner, Leon}, title = {Are human brains shrinking? Every measured skull, 7 million years}, institution = {IQ Metrics}, year = {2026}, version = {2026.11}, doi = {10.5281/zenodo.23909338}, url = {https://iqmetrics.org/research/are-human-brains-shrinking/} }
Source: Leon Falkner, "Are human brains shrinking? Every measured skull, 7 million years." IQ Metrics Research, version 2026.11, https://iqmetrics.org/research/are-human-brains-shrinking/ (DOI 10.5281/zenodo.23909338)
Embed the key numbers
Paste this into an article or post. It lists the main numbers and credits the source.
Get the data
One row per measured skull (1,223 rows): species, group, name or collection, country, age, period, the volume used and the value in each source (DeSilva et al. 2021 and 2023, Du et al. 2018 average of observers, Hawks et al. 2017, McCarthy and Haque 2026), flags for which files list it, and the reference. Includes 60 chimpanzee skulls and 312 rows the authors removed in 2023, flagged use_in_analysis = 0.
| Column | What it holds |
|---|---|
row_id | Our row number |
taxon, group | Species and the group used in the charts |
specimen, site_or_collection, country | Skull name, or the collection it belongs to (place names; no skull is grouped by ancestry), and the place where the 2023 file gives one |
age_ma, age_source, era | Age in millions of years ago as dated in the source, which source, and our period |
ecv_cc, ecv_basis | The volume used in our analysis (cc) and which source it comes from |
ecv_desilva2021, ecv_desilva2023, ecv_du2018_mean, ecv_du2018_n, ecv_hawks2017, ecv_mccarthy2026 | The value in each source (cc); Du et al. is the average of n observers |
in_du2018, in_desilva2021, in_desilva2023, use_in_analysis | 1 if the file lists the skull; use_in_analysis = 1 for the 2023 file and Du-only rows |
taxon_label_in_source, label_in_source | The name used in the source, where we changed it |
ecv_reference, note | The original publication given in the source file, and our notes (typos, removed rows) |
For journalists, researchers and teachers
Everything on this page may be quoted, charted and republished with credit. No embargo, no permission needed, no sign-up. If you need a number that is not here, ask.
Summary you can paste
Plain news style. Edit freely; keep the credit.
IQ Metrics Research matched 1,918 rows from three open data files (Du et al. 2018, DeSilva et al. 2021 and their 2023 revision) into 851 measured skulls spanning 7 million years, plus 60 chimpanzee skulls. Average volume: chimpanzee 367 cc, Australopithecus 440, Homo erectus 932, Neanderthals 1,388, H. sapiens older than 11,700 years 1,458 and in the last 100 years 1,297. 48.8% of the skulls are from the last 100 years. A claim that brains shrank 3,000 years ago is disputed; a simple fit by IQ Metrics puts the break at 3,400 years ago on the 2021 data and 760 on the revised data. Source: IQ Metrics Research, https://iqmetrics.org/research/are-human-brains-shrinking/
Angles for a story
- Half of the skulls behind the “brains are shrinking” claim are less than 100 years old (Figure 9).
- Four times a chimpanzee: 7 million years of brain growth in one chart (Figure 1).
- Neanderthals had bigger brains than modern skulls in the data (Figure 3).
- The break date moves from 3,400 to 760 years ago depending on the skulls kept (Figure 14).
- Nineteen studies say the brain shrank, from 3.9% to 13.5% (Figure 7).
- Meanwhile, brains of living adults are getting bigger (Figure 15).
Quotes you can use
Attributable as written, with the name and title. For a different angle or a quote on a specific figure, ask through the contact page.
Half the skulls in the shrinking-brain data are from the last 100 years. Before we ask whether brains shrank, we should ask who is in the sample.
Leon Falkner, Data & Research Analyst, IQ Metrics ResearchSkulls from the last century are about 160 cc smaller than Ice Age ones in these collections. When it began, and whether it describes everyone, is what the data cannot tell us.
Leon Falkner, Data & Research Analyst, IQ Metrics ResearchThe Neanderthals had bigger brains than modern skulls in the data, and it tells us nothing about how smart they were. Volume is a weak guide to intelligence.
Leon Falkner, Data & Research Analyst, IQ Metrics Research
Files
- CSV of every skull, one row per skull with every source value, age, period and reference (CC BY 4.0)
- Every figure as a print-ready PNG: use the Image button under each figure
- Embed code and data table under every figure
- Share images for social media in three sizes, with the credit line built in
- Citations in APA, MLA, Chicago, BibTeX and plain text
Terms, contact and corrections
Credit: “IQ Metrics Research, Are Human Brains Shrinking? (2026)” with a link to this page. On air or in print, “IQ Metrics” and the page address are enough.
What it covers: skull volumes from Du et al. 2018 (CC0), DeSilva et al. 2021 and 2023 (CC BY) and McCarthy and Haque 2026 (CC BY), with every source value kept. Original museum measurements belong to the papers cited in the CSV.
Contact: the research team, through the contact page. Corrections are made on this page with a dated note in the version history.