
How fast do humans think? 47 activities measured in bits per second
We turned 47 human activities, from typing and reading to memory records, the Rubik’s Cube and brain chips, into bits per second, and set them against the “10 bits per second” claim.

By Leon Falkner, Data & Research Analyst · Reviewed by Aarav Vardhan, Editor-in-Chief · Published 4 November 2026 · 13 min read
About this study
- Report type
- Data study from records, studies and open data
- Data
- 47 activities in bits per second, 17 published estimates, 17 languages recomputed
- Compared with
- The "10 bits per second" of Zheng and Meister (Neuron, 2025) and the 39 bits/s of speech
- Years
- Records and studies 1951 to 2026; records as of 4 November 2026
- Licence
- CC BY 4.0 (our dataset and charts)
- Version
- 2026.11
- Sources
- 22
Humans think at roughly 10 bits per second by the best-known estimate, and the 47 activities we scored have a median of 7.5 bits per second. Speech is faster, about 39 bits per second across 17 languages; only one preprint, on mental calculation, reports over 50. IQ Metrics Research, records and studies 1951-2026.
01 Key findings
- Most of what people do runs at 1 to 40 bits per second. Our 47 activities have a median of 7.5 bits/s; 24 are below 10 and 20 of them within a factor of 2 of 10 (5 to 20).IQ Metrics dataset
- Speech is the fast lane, at about 39 bits per second. Across 17 languages the fastest talkers pack the least into each syllable (r = -0.83), so information rates land close together.Coupe 2019; IQ Metrics calculation
- Speed and stamina trade off. Memory champions reach 23.2 bits/s for 12 seconds of digits and 3.1 over an hour; Rubik’s Cube records run from 26 bits/s for a 2.51 s solve to 1.17 for an hour of blindfolded cubes.IAM, Memory League, WCA; IQ Metrics calculation
- Brain chips decode 0.65 to 7.2 bits per second. The 2023 speech implants are the fastest, at a fifth of natural speech.Pandarinath 2017; Willett 2021, 2023; Metzger 2023; Card 2024
- The 10 bits/s figure is contested. A 2025 Nature Neuroscience reply is titled “more than 10 bits per second”, and two 2025 preprints report up to 42 bits/s for memory and 215 for mental calculation.Sauerbrei 2025; Wiederhold 2025
- The gap is about method. Speech at 39 bits/s counts information per syllable from a dictionary model; the 10 bits/s figure counts English at about 1 bit per character, the entropy a reader can predict.Shannon 1951; Coupe 2019; Zheng & Meister 2025
02 Statistics to quote
the information rate of human behaviour estimated by Zheng and Meister (Neuron, 2025), “within a factor of 2”.
Zheng & Meister 2025median information rate of the 47 human activities in our dataset, records and studies 1951-2026.
IQ Metrics calculationactivities run below 10 bits per second; 22 run between 10 and 50; 1 preprint claims more.
IQ Metrics calculationinformation rate of speech, averaged over 17 languages and 170 speakers (Coupe et al. 2019: 39.15).
Coupe 2019typing at the average of 168,960 volunteers (51.56 words per minute), at 1 bit per character.
Dhakal 2018; IQ Metrics calculationsilent reading of English non-fiction at 238 words per minute (range 13.3 to 28.9 by the entropy assumption).
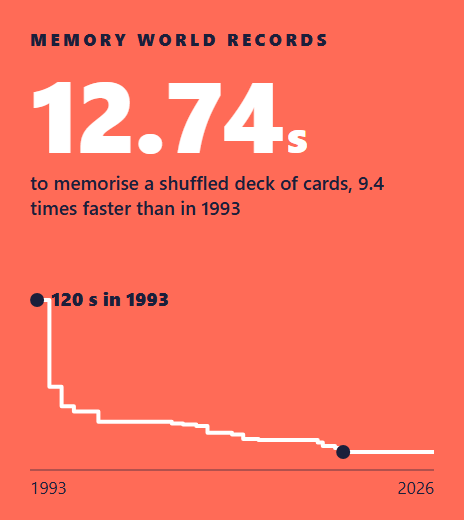
Brysbaert 2019; IQ Metrics calculationthe speed-cards world record: one shuffled deck (225.6 bits) memorised in 12.74 seconds.
IAM; Zheng & Meister 2025the one-hour numbers record (3,412 digits): long tasks run at a fraction of short ones.
IAM; IQ Metrics calculationin one Rubik’s Cube state (43,252,003,274,489,856,000 states); the 2.51 s record is at most 26 bits/s.
WCA; IQ Metrics calculationtimes: the senses (about a billion bits per second) against behaviour (10), Zheng and Meister’s “sifting number”.
Zheng & Meister 2025the fastest brain-chip speech decoding (78 words per minute, 2023), against 39 for speech.
Metzger 2023; IQ Metrics calculationmental calculation in the shortest tasks, the highest figure we found (2025 preprint, not peer reviewed).
Wiederhold, Stemmler & Herz 202503 How fast do humans think?
Humans think at about 10 bits per second by the best-known estimate, and the 47 activities in our dataset have a median of 7.5 bits per second [1]. A bit is one yes-or-no answer: 10 bits a second is enough to pick one item out of about a thousand every second. Jieyu Zheng and Markus Meister at the California Institute of Technology (Caltech) reached the 10 bits/s figure by reviewing typing, speech, memory sports, speedcubing and video games, and they call it reliable “within a factor of 2 either way” [1].
Our dataset checks that claim one activity at a time. We took a named record or study for each activity and turned it into bits per second with one stated method: the source paper’s own figure where it computed one, characters per second times the entropy of English for text, or items per second times the bits in each item for digits, cards and cube states. 24 of 47 activities come out below 10 bits per second and 22 between 10 and 50. The one figure above 50 is a 2025 preprint on mental calculation (215 bits/s) [17].
Every activity on one scale: 24 of 47 run below 10 bits per second
Each dot is one activity, placed by its information rate (bits per second, log scale: each step is ten times faster), one row per type of activity (top to bottom: language, typing, memory sports, Rubik's Cube, video games, lab tasks, brain chips, mental calculation). The median is 7.5 bits/s; 20 of 47 sit between 5 and 20 bits/s, inside the factor of 2 that Zheng and Meister allow around their 10. Records and studies as of 4 November 2026.
Type of activity (one row each, see the colours)
Information rate, bits per second (log scale)
Source: Our dataset of 47 activities [1] [2] [5] [4] [13] [15] [8] [17]; bits per second by IQ Metrics unless the paper gave them
Data table
| activity | bits_per_second | row_position | group |
|---|---|---|---|
| Brain chip: copying English sentences by point-and-click (Stanford, 2017) | 0.7 | 1.7 | brain-chip |
| Multiple cubes blindfolded (WCA record) | 1.2 | 4.7 | puzzle |
| Brain chip: imagined handwriting (Stanford, 2021) | 1.5 | 2.1 | brain-chip |
| Typing, slowest 10% of volunteers | 1.7 | 6.7 | motor |
| Playing cards, 1 hour (IAM record) | 2.2 | 5.7 | memory |
| Brain chip: everyday speech over 248 hours (UC Davis, 2024) | 2.9 | 1.9 | brain-chip |
| Playing cards, 30 minutes (IAM record) | 3.1 | 6.1 | memory |
| Random digits, 1 hour (IAM record) | 3.1 | 5.8 | memory |
| Spoken numbers, read aloud at 1 digit a second (IAM record) | 3.3 | 6.2 | memory |
| Binary digits, 30 minutes (IAM record) | 3.5 | 6 | memory |
| Brain chip: point-and-click on a 6×6 grid of random targets (Stanford, 2017) | 3.7 | 2.2 | brain-chip |
| Random digits, 30 minutes (IAM record) | 3.9 | 5.8 | memory |
| Playing cards, 10 minutes (IAM record) | 4 | 6.1 | memory |
| Rubik's Cube 3×3 with feet (WCA record) | 4.2 | 5.1 | puzzle |
| Typing, average of 168,960 volunteers | 4.3 | 7.1 | motor |
| Random digits, 15 minutes (IAM record) | 4.8 | 5.9 | memory |
| Binary digits, 5 minutes (IAM record) | 4.9 | 6.2 | memory |
| Choice reaction: press the key for the lamp that lit (Hick 1952) | 5 | 2.7 | lab |
| Rubik's Cube 3×3 blindfolded, whole attempt (WCA record) | 5.6 | 4.8 | puzzle |
| Brain chip: attempted speech, Utah arrays (Stanford, 2023) | 5.7 | 2 | brain-chip |
| Random digits, 5 minutes (IAM record) | 7 | 6 | memory |
| Tetris, top-tier players (3-4 pieces a second) | 7 | 3.7 | game |
| Brain chip: attempted speech, surface grid (UCSF, 2023) | 7.2 | 1.8 | brain-chip |
| Typing, fastest 10% of volunteers | 7.5 | 6.8 | motor |
| Typing, advanced typist (120 words per minute) | 10 | 7.2 | motor |
| Thinking of a thing (the Twenty Questions game) | 10 | 3.1 | lab |
| Aimed arm movements between targets (Fitts 1954) | 11 | 2.9 | lab |
| Rubik's Cube 3×3 one-handed (WCA record) | 11.6 | 5.2 | puzzle |
| Rubik's Cube blindfolded, looking phase only (12.78 s record of 2023) | 11.8 | 5 | puzzle |
| Listening to narration, English, 160 words per minute | 13 | 7.7 | language |
| Memory League cards, live (52 cards) | 13.4 | 5.8 | memory |
| Memory League numbers, live (80 digits) | 15.8 | 6.2 | memory |
| StarCraft, professional at 1,000 actions per minute | 16.7 | 4.1 | game |
| Reading aloud, English (adults) | 17.1 | 8.1 | language |
| Speed cards: one shuffled deck (IAM record) | 17.7 | 6 | memory |
| Memory League cards, online (52 cards) | 18.4 | 5.7 | memory |
| Rubik's Cube 3×3, average of 5 (WCA record) | 18.6 | 4.8 | puzzle |
| Silent reading, English non-fiction (adults) | 22.2 | 7.8 | language |
| Silent reading, English fiction (adults) | 22.5 | 8.2 | language |
| Memory League numbers, online (80 digits) | 23.2 | 6.1 | memory |
| Rubik's Cube 3×3, single solve (WCA record) | 26 | 5.1 | puzzle |
| Reading, from eye fixations (7-9 letters per 200-250 ms) | 36.5 | 8 | language |
| Speaking, average of 17 languages | 39.1 | 7.8 | language |
| Naming objects in a 0.5-second glimpse (Sziklai 1956) | 40 | 3.2 | lab |
| Memory athletes, shortest tasks (Wiederhold 2025, preprint) | 42 | 5.9 | memory |
| Reading lists of words aloud as fast as possible | 43 | 8.1 | language |
| Mental calculation, shortest competition tasks (Wiederhold 2025, preprint) | 215 | 0.7 | calculation |
Embed this chart
Paste this HTML into your page: it carries the numbers and the credit link to this figure.
The spread is narrow for such different tasks. A brain-chip user copying sentences in 2017 managed 0.65 bits per second [8]; an average typist about 4.3 [5]; a memory champion looking at a deck of cards 17.7 [13]; a speaker in any of 17 languages about 39 [2]. Between the slowest and the fastest of the 47, the factor is about 330, set by one preprint; without it, the fastest is a reading task at 43 bits per second [7].
Most human activities run at 0 to 20 bits per second; one preprint claims 215
All 47 activities in bins of 10 bits per second. 24 are under 10 bits/s and 22 between 10 and 50; the long right tail is one preprint on mental calculation (215 bits/s, not yet peer reviewed). Dashed lines: Zheng and Meister's 10 bits/s and speech at 39 bits/s.
Bits per second
Source: Our dataset [1] [2] [17]; counts by IQ Metrics
Data table
| from | to | activities |
|---|---|---|
| 0 | 10 | 24 |
| 10 | 20 | 13 |
| 20 | 30 | 4 |
| 30 | 40 | 2 |
| 40 | 50 | 3 |
| 50 | 60 | 0 |
| 60 | 70 | 0 |
| 70 | 80 | 0 |
| 80 | 90 | 0 |
| 90 | 100 | 0 |
| 100 | 110 | 0 |
| 110 | 120 | 0 |
| 120 | 130 | 0 |
| 130 | 140 | 0 |
| 140 | 150 | 0 |
| 150 | 160 | 0 |
| 160 | 170 | 0 |
| 170 | 180 | 0 |
| 180 | 190 | 0 |
| 190 | 200 | 0 |
| 200 | 210 | 0 |
| 210 | 220 | 1 |
Embed this chart
Paste this HTML into your page: it carries the numbers and the credit link to this figure.
- Bit
- One yes-or-no answer. Picking one of 2 equally likely options takes 1 bit, one of 1,024 takes 10 bits. Information rate counts the bits a person resolves per second.
- Bits per second (bits/s)
- Information per unit of time. A typical Wi-Fi connection moves about 50 million [21]; human behaviour about 10 by the Zheng and Meister estimate [1].
- Entropy
- The average information in a symbol, given what came before. Shannon measured printed English at 0.6 to 1.3 bits per letter with 100 letters of context, “of the order of one bit” [6].
- Information rate
- Entropy per second: how much a stream of speech, text or moves narrows down what could have come next. A typist who copies predictable English at 10 keys a second transmits about 10 bits/s, not 10 times the 6 bits of a key [1].
- Information density
- Bits per syllable of a language, from a model of how predictable its syllables are; from 4.8 in Basque to 8.0 in Vietnamese [2].
- Speed of thought
- Not a measured quantity of its own. Researchers infer it from behaviour (what a person reads, says, types or remembers per second), which is what this page compares.
- Sifting number
- Zheng and Meister’s name for the ratio between what the senses take in (about a billion bits/s) and what behaviour uses (10): about 100 million [1].
- Processing speed
- In intelligence testing, how quickly a person does simple tasks such as matching symbols. Related to, but not the same as, information rate; see processing speed and IQ.
04 Where does "10 bits per second" come from?
The 10 bits per second figure comes from a 2025 review in the journal Neuron by Jieyu Zheng and Markus Meister, posted as a preprint in August 2024 and published online on 17 December 2024 [1]. Their first example is a typist: 120 words a minute is 10 keystrokes a second, and because English carries about 1 bit per character, the typist transmits about 10 bits per second. Their table lists 12 behaviours, from binary-digit memorisation (4.9 bits/s) to object recognition (30 to 50) and speech in 17 languages (39).
Two of the paper’s own numbers do not match its stated method, and we list both. For Tetris it prints “around 7 bits/s”, but its upper-bound method (4 orientations x 9 positions, 3 to 4 pieces a second) gives up to 20.7 bits/s (IQ Metrics recalculation); for StarCraft the text computes 16.7 bits/s and the table prints 10. The cube paragraph gives the number of cube states as 4.3 x 10^16; the correct count is 4.3 x 10^19, which is the “2^65” the paper uses, so its 11.8 bits/s stands. None of these changes the order of magnitude.
The figure spread fast. Caltech’s news release of 17 December 2024 said humans think “at a rate of 10 bits per second” and that the senses gather “a billion bits per second, which is 100 million times faster” [21]. The same release quotes the senior author describing “the trillion that our senses are taking in”, a thousand times the paper’s own figure. OpenAlex lists 58 works citing the Neuron paper by 4 November 2026 [22].
How "10 bits per second" and "a billion" travelled
Each step in time order; steps are evenly spaced. The behaviour figure travelled unchanged. The senses figure grew from a billion to "the trillion" in one quote.
- 2024Zheng & Meister preprint and Neuron paper: about 10 bits/s12 behaviours reviewed; "within a factor of 2 either way"
- 2024Caltech news release: "a rate of 10 bits per second"17 December 2024
- 2025Memory athletes: up to 42 bits/s in short tasksWiederhold, preprint
- 2025Mental calculators: above 215 bits/sWiederhold, Stemmler and Herz, preprint
- 2025Nature Neuroscience: "The brain works at more than 10 bits per second"Sauerbrei and Pruszynski (title read)
- 2026IQ Metrics: 47 activities, median 7.5 bits/sThis page
- 2024Paper: about 10^9 bits/s; one eye's cones about 1.6 billionCapacity from 6 million cones x 270 bits/s
- 2024News release: "a billion bits per second", "100 million times faster"Matches the paper
- 2024Quote in the same release: "the trillion that our senses are taking in"1,000 times the paper's figure
- 2025Calculation preprint: senses "exceeding 10^6 bit/s"A lower bound, different number
- 2026Cognitive-reserve preprint: a "10^9-to-10 bits/s gap"Uses the paper's numbers as given
Source: Zheng & Meister [1]; Caltech [21]; preprints [16] [17] [20]; Nature Neuroscience [18]
Data table
| claim | step | year | type | what happened | detail |
|---|---|---|---|---|---|
| Thought runs at 10 bits per second | 1 | 2024 | Where the number began | Zheng & Meister preprint and Neuron paper: about 10 bits/s | 12 behaviours reviewed; "within a factor of 2 either way" |
| Thought runs at 10 bits per second | 2 | 2024 | Mass media | Caltech news release: "a rate of 10 bits per second" | 17 December 2024 |
| Thought runs at 10 bits per second | 3 | 2025 | Measured by a study | Memory athletes: up to 42 bits/s in short tasks | Wiederhold, preprint |
| Thought runs at 10 bits per second | 4 | 2025 | Measured by a study | Mental calculators: above 215 bits/s | Wiederhold, Stemmler and Herz, preprint |
| Thought runs at 10 bits per second | 5 | 2025 | Fact-check | Nature Neuroscience: "The brain works at more than 10 bits per second" | Sauerbrei and Pruszynski (title read) |
| Thought runs at 10 bits per second | 6 | 2026 | Fact-check | IQ Metrics: 47 activities, median 7.5 bits/s | This page |
| The senses take in a billion bits per second | 1 | 2024 | Where the number began | Paper: about 10^9 bits/s; one eye's cones about 1.6 billion | Capacity from 6 million cones x 270 bits/s |
| The senses take in a billion bits per second | 2 | 2024 | Repeated, no new data | News release: "a billion bits per second", "100 million times faster" | Matches the paper |
| The senses take in a billion bits per second | 3 | 2024 | Mass media | Quote in the same release: "the trillion that our senses are taking in" | 1,000 times the paper's figure |
| The senses take in a billion bits per second | 4 | 2025 | Repeated, no new data | Calculation preprint: senses "exceeding 10^6 bit/s" | A lower bound, different number |
| The senses take in a billion bits per second | 5 | 2026 | Repeated, no new data | Cognitive-reserve preprint: a "10^9-to-10 bits/s gap" | Uses the paper's numbers as given |
Embed this chart
Paste this HTML into your page: it carries the numbers and the credit link to this figure.
05 How fast does the brain process information from the senses?
The senses can carry about a billion bits per second, 100 million times more than behaviour uses, by Zheng and Meister’s estimate [1]. One cone photoreceptor in the eye can transmit about 270 bits per second; the 6 million cones of one eye about 1.6 billion. The optic nerve, a million fibres firing at up to 50 spikes a second at about 2 bits per spike, has room for about 100 million bits per second “or less”, so the retina already compresses the signal at least tenfold. A single neuron in the cortex transmits about 10 bits per second, the same as the whole person.
From 1.6 billion bits a second at the eye to 10 in behaviour
Orders of magnitude from Zheng and Meister: the cones of one eye can carry about 1.6 billion bits per second, the optic nerve about 100 million or less, and behaviour about 10. The last bar is drawn to scale, so it cannot be seen: it is one hundred-millionth of the first. These are capacities, not measurements of one person.
Source: Zheng & Meister 2025, section 4 and appendix B [1]
Data table
| stage | count | pct_of_first | pct_of_previous |
|---|---|---|---|
| Cone photoreceptors of one eye | 1600000000 | 100 | 100 |
| Optic nerve of one eye | 100000000 | 6.2 | 6.2 |
| Human behaviour | 10 | 0 | 0 |
Embed this chart
Paste this HTML into your page: it carries the numbers and the credit link to this figure.
These are capacities worked out from cell physiology, not measurements of a person seeing, and the paper calls many of its numbers “rough estimates” good to a factor of 2. The point survives the uncertainty: the gap between input and behaviour is about eight orders of magnitude, which, they write, “may be the largest unexplained number in brain science”. The brain statistics fact check traces other famous brain numbers the same way.
06 How fast can humans talk? About 39 bits per second
Humans talk at about 39 bits per second, the mean information rate of 170 adults reading the same 15 texts in 17 languages (39.15 bits/s, SD 5.10) [2]. Christophe Coupe, Yoon Mi Oh, Dan Dediu and Francois Pellegrino measured speech rate in syllables per second (mean 6.63) and the information density of each language in bits per syllable, and multiplied the two. Their data are open under CC BY 4.0 [3], so we recomputed every language: our simple means give 39.2 bits/s overall, from 33.8 in Thai to 45.9 in French.
The fastest talkers pack the least into each syllable
Rank of 17 languages (1 = highest) on syllables per second, bits per syllable and bits per second. Japanese is spoken fastest (8.0 syllables a second) but ranks 16 of 17 on bits per syllable; Vietnamese packs the most per syllable and is spoken among the slowest. Rates: IQ Metrics means of the authors' data.
Source: Coupe et al. 2019 data [3] [2]; ranks by IQ Metrics
Data table
| language | Syllables per second | Bits per syllable | Bits per second |
|---|---|---|---|
| French | 10 | 5 | 1 |
| English | 11 | 3 | 2 |
| Vietnamese | 16 | 1 | 3 |
| Spanish | 2 | 13 | 4 |
| Mandarin Chinese | 14 | 4 | 5 |
| Japanese | 1 | 16 | 6 |
| Korean | 7 | 9 | 7 |
| Finnish | 4 | 10 | 8 |
| Serbian | 6 | 12 | 9 |
| Catalan | 8 | 11 | 10 |
| Italian | 5 | 15 | 11 |
| Turkish | 9 | 14 | 12 |
| German | 12 | 7 | 13 |
| Basque | 3 | 17 | 14 |
| Cantonese | 15 | 6 | 15 |
| Hungarian | 13 | 8 | 16 |
| Thai | 17 | 2 | 17 |
Embed this chart
Paste this HTML into your page: it carries the numbers and the credit link to this figure.
Languages trade speed for density. Japanese speakers produce 8.0 syllables a second, the most in the sample, but each syllable carries 5.0 bits; Vietnamese carries 8.0 bits per syllable at 5.3 syllables a second. Across the 17 language means, syllables per second and bits per syllable correlate at r = -0.83, and the products, bits per second, end up within about a third of each other [3].
Speed and density cancel out: r = -0.83 between syllables per second and bits per syllable
Pearson correlations across the 17 language means. Languages spoken faster carry less information per syllable, so their bits per second end up close together. Linked, not cause; 17 languages is a small sample.
Source: Coupe et al. 2019 data [3]; correlations by IQ Metrics
Data table
| measure | Syllables per second | Bits per syllable | Bits per second | Syllable entropy |
|---|---|---|---|---|
| Syllables per second | 1 | -0.8 | 0.3 | -0.6 |
| Bits per syllable | -0.8 | 1 | 0.3 | 0.5 |
| Bits per second | 0.3 | 0.3 | 1 | -0.1 |
| Syllable entropy | -0.6 | 0.5 | -0.1 | 1 |
Embed this chart
Paste this HTML into your page: it carries the numbers and the credit link to this figure.
Seventeen languages, fifteen texts: every cell between 33 and 47 bits per second
Mean information rate in bits per second for each language (rows, fastest first) reading the same 15 short texts, shown in five groups of three texts (columns, in the authors' order), averaged over that language's speakers. Cells run from 33.2 to 46.8 bits/s. IQ Metrics calculation from the authors' open data (syllables / duration x bits per syllable); the CSV has the groups, the raw data every reading.
Source: Coupe et al. 2019 data, CC BY 4.0 [3] [2]; means by IQ Metrics
Data table
| language | Texts 1-3 | Texts 4-6 | Texts 7-9 | Texts 10-12 | Texts 13-15 |
|---|---|---|---|---|---|
| French | 46.5 | 46.3 | 46.1 | 45 | 45.8 |
| English | 46.3 | 45.4 | 42.9 | 43.3 | 46.8 |
| Vietnamese | 42.5 | 42.7 | 42.2 | 43.1 | 42.2 |
| Spanish | 41.8 | 41.3 | 41.7 | 43.6 | 41.3 |
| Mandarin Chinese | 40.7 | 41.2 | 40.1 | 41 | 40.9 |
| Japanese | 40.8 | 40.4 | 39.9 | 40.1 | 40.8 |
| Korean | 39.5 | 40.2 | 38.8 | 39.9 | 39.4 |
| Finnish | 40.1 | 41.3 | 38.6 | 38.5 | 38.4 |
| Serbian | 39.4 | 39 | 39.6 | 39.7 | 37.9 |
| Catalan | 38.1 | 38.7 | 38.5 | 39.2 | 39.4 |
| Italian | 36.2 | 39.3 | 40.8 | 37.9 | 37.1 |
| Turkish | 36.5 | 36.8 | 38.2 | 39 | 37.5 |
| German | 37.1 | 38.2 | 35.6 | 37.5 | 36.8 |
| Basque | 36.2 | 35.8 | 36.5 | 37.8 | 35.8 |
| Cantonese | 36.9 | 36.8 | 36.3 | 37 | 35.1 |
| Hungarian | 34.5 | 34.4 | 34.4 | 33.9 | 35.9 |
| Thai | 33.9 | 33.6 | 33.3 | 35 | 33.2 |
Embed this chart
Paste this HTML into your page: it carries the numbers and the credit link to this figure.
People differ more than languages. Speaker means run from 27.8 to 54.2 bits per second, while language means stay between 33.8 and 45.9; the paper also found lower means for women (by 1.01 bits/s) [2]. None of this ranks languages: the authors read 39 bits/s as a shared limit of the human communicative niche, and a 2026 study in PNAS found that understanding falls off above about 10 syllables a second [19].
Inside each language, speakers differ more than languages do
Slowest and fastest speaker in each language, each speaker's mean over the texts they read, in bits per second (fastest language first). Speakers run from 27.8 to 54.2 bits/s; language means only from 33.8 to 45.9. IQ Metrics calculation from the authors' data.
Bits per second
Source: Coupe et al. 2019 data [3]; speaker means by IQ Metrics
Data table
| language | Slowest speaker | Fastest speaker |
|---|---|---|
| French | 40.2 | 52.6 |
| English | 40.9 | 52 |
| Vietnamese | 35.5 | 54.2 |
| Spanish | 39.9 | 43.7 |
| Mandarin Chinese | 35.9 | 46.3 |
| Japanese | 36.5 | 44.6 |
| Korean | 33.9 | 48.8 |
| Finnish | 31.8 | 41.9 |
| Serbian | 31.8 | 44.5 |
| Catalan | 34.5 | 41.5 |
| Italian | 29.5 | 46.7 |
| Turkish | 32.3 | 46.2 |
| German | 28.7 | 42.6 |
| Basque | 31.7 | 41.4 |
| Cantonese | 33.5 | 38.4 |
| Hungarian | 27.8 | 40.2 |
| Thai | 29.4 | 37.4 |
Embed this chart
Paste this HTML into your page: it carries the numbers and the credit link to this figure.
Speech in 17 languages: our means of the open data
Means over every reading of 15 texts (170 speakers, 2,288 readings). Bits per syllable is the authors' language-level measure. Our simple means differ slightly from the paper's model estimates (39.15 bits/s overall).
| French | 10 | 6.88 | 6.68 | 45.9 | 40.2 to 52.6 |
| English | 10 | 6.34 | 7.09 | 44.9 | 40.9 to 52.0 |
| Vietnamese | 10 | 5.30 | 8.02 | 42.5 | 35.5 to 54.2 |
| Spanish | 10 | 7.73 | 5.43 | 42.0 | 39.9 to 43.7 |
| Mandarin Chinese | 10 | 5.86 | 6.96 | 40.8 | 35.9 to 46.3 |
| Japanese | 10 | 8.04 | 5.03 | 40.4 | 36.5 to 44.6 |
| Korean | 10 | 7.12 | 5.56 | 39.6 | 33.9 to 48.8 |
| Finnish | 10 | 7.17 | 5.49 | 39.4 | 31.8 to 41.9 |
| Serbian | 10 | 7.15 | 5.47 | 39.1 | 31.8 to 44.5 |
| Catalan | 10 | 7.07 | 5.49 | 38.8 | 34.5 to 41.5 |
| Italian | 10 | 7.16 | 5.29 | 37.9 | 29.5 to 46.7 |
| Turkish | 10 | 7.05 | 5.34 | 37.6 | 32.3 to 46.2 |
| German | 10 | 6.09 | 6.08 | 37.0 | 28.7 to 42.6 |
| Basque | 10 | 7.54 | 4.83 | 36.4 | 31.7 to 41.4 |
| Cantonese | 10 | 5.57 | 6.53 | 36.4 | 33.5 to 38.4 |
| Hungarian | 10 | 5.87 | 5.90 | 34.6 | 27.8 to 40.2 |
| Thai | 10 | 4.70 | 7.19 | 33.8 | 29.4 to 37.4 |
Source: Coupe et al. 2019 data, CC BY 4.0 [3] [2]; means by IQ Metrics
07 How fast can humans read, in bits per second?
Adults read English non-fiction silently at 238 words per minute, about 22.2 bits per second at 1 bit per character, by Marc Brysbaert’s 2019 meta-analysis of 190 studies with 18,573 readers [4]. Fiction goes faster, 260 words per minute (22.5 bits/s), because its words are shorter: 4.2 letters against 4.6. Reading aloud runs at 183 words per minute (17.1 bits/s). The range from 0.6 to 1.3 bits per character, Shannon’s bounds, moves silent non-fiction reading from 13.3 to 28.9 bits/s [6].
The record for reading is older. In 1957 John Pierce and John Karlin at Bell Labs had people read word lists aloud as fast as they could and found about 43 bits per second for rapid readers, a lower bound “close to a limiting rate”; an earlier MIT report had found 30 to 35 bits/s for random dictionary words [7]. Zheng and Meister, working from eye fixations of 7 to 9 letters every 200 to 250 milliseconds, give 28 to 45 bits per second [1]. Brysbaert cites a 2016 review showing that more than 1,000 words a minute is impossible without severe loss of understanding. For what reading does for test scores, see reading and IQ.
08 How fast can humans type, in bits per second?
The average typist enters 51.56 words per minute, about 4.30 bits per second, in the largest typing study: 168,960 volunteers who copied 15 sentences each, 136 million keystrokes in all [5]. A “word” there is any 5 characters, so 51.56 words per minute is 4.3 characters a second, and at 1 bit per character, 4.30 bits per second (2.6 to 5.6 across Shannon’s range). The fastest tenth averaged 89.56 words per minute (7.5 bits/s), the slowest tenth 20.91 (1.7), and the fastest typists passed 120 words per minute, the 10 bits/s of Zheng and Meister’s example [1].
Typing is slower than speech because fingers are slower than the voice, but the gap is smaller than it looks in characters. Zheng and Meister’s point is that a professional typist and a gamer at 1,000 actions a minute (16.7 bits/s on their reckoning) land in the same range. To test your own speed on a reaction task, see the reaction time test and average reaction time by age.
09 How fast can memory champions take in information?
The fastest memory records run at 13 to 23 bits per second for 11 to 17 seconds of memorising, and fall to 2 to 3 bits per second over an hour. The speed-cards record, one shuffled deck memorised in 12.74 seconds, is 17.7 bits per second, because the order of a deck holds 225.6 bits [13]; Zheng and Meister print the same 17.7 [1]. The online Memory League record of 80 digits in 11.45 seconds is 23.2 bits/s [14]. Over an hour the numbers record (3,412 digits) is 3.1 bits/s and the cards record (1,829 cards) 2.2.
Memory champions take in 23.2 bits a second for 12 seconds, 3.1 over an hour
World records turned into bits per second of memorising time (a digit = 3.32 bits, a card in a shuffled deck = 4.34, a binary digit = 1). First column: 80 digits in 11.45 s (Memory League, online) and one deck in 12.74 s (IAM); second column: digits 15 minutes, cards 10 minutes. The 5-minute and binary-digit records are in the table below. Records as of 4 November 2026.
Source: IAM and Memory League records, via our memory world records data [13] [14]; bits per second by IQ Metrics
Data table
| material | About 12 s | 10-15 min | 30 min | 1 hour |
|---|---|---|---|---|
| Decimal digits | 23.2 | 4.8 | 3.9 | 3.1 |
| Playing cards | 17.7 | 4 | 3.1 | 2.2 |
Embed this chart
Paste this HTML into your page: it carries the numbers and the credit link to this figure.
A 2025 preprint by Bastian Wiederhold reads the same records and reports “up to 42 bit/s” in short tasks, with rates that fall with task length as a power law, and less than 1 bit/s for untrained people learning numbers [16]. Our figures count memorising time only, not recall, and use the score as printed. All records come from our memory world records study, which reads the International Association of Memory (IAM) and Memory League directly. To try a short version yourself, see the digit span test or the sequence memory game, and read what the research says about photographic memory.
10 How many bits per second is solving a Rubik's Cube?
A Rubik’s Cube holds 65.23 bits, the log of its 43,252,003,274,489,856,000 states, so the 2.51-second world record for one solve is at most 26.0 bits per second [15]. “At most”, because competitors may inspect the cube for up to 15 seconds before the timer starts (World Cube Association Regulation A3a1); counted with that time, the rate is 3.7. The average-of-five record is 18.6 bits/s, one-handed 11.6 and with the feet 4.2.
Blindfolded solving separates seeing from doing. The 11.56-second blindfolded record is 5.6 bits/s over the whole attempt; if, as Zheng and Meister report, about half goes on looking, the looking phase runs at about 11.3 [15] [1]. Their own example, the 12.78-second record of 2023 with 5.5 seconds of inspection, gives 11.8 bits/s. The multi-blind record, 63 of 65 cubes memorised and solved in 58 minutes 23 seconds, works out at 1.17 bits per second. For what cubing does and does not do for intelligence, see whether the Rubik’s Cube raises IQ.
Fast and simple or slow and rich: the same 1 to 40 bits per second
39 activities whose items can be counted, by items per second and bits per item, both on log scales; bubble area = bits per second. A Rubik's Cube state carries 65.23 bits but takes seconds; a typed character carries about 1 bit and comes 4 times a second. Products land in the same narrow band.
Bits per item (log scale)
Items per second (log scale)
Source: Our dataset [1] [2] [5] [13] [15]; IQ Metrics calculation
Data table
| activity | items_per_second | bits_per_item | group | bits_per_second |
|---|---|---|---|---|
| Speaking, average of 17 languages | 6.6 | 5.9 | language | 39.1 |
| Listening to narration, English, 160 words per minute | 13.3 | 1 | language | 13 |
| Silent reading, English non-fiction (adults) | 22.2 | 1 | language | 22.2 |
| Silent reading, English fiction (adults) | 22.5 | 1 | language | 22.5 |
| Reading aloud, English (adults) | 17.1 | 1 | language | 17.1 |
| Typing, average of 168,960 volunteers | 4.3 | 1 | motor | 4.3 |
| Typing, fastest 10% of volunteers | 7.5 | 1 | motor | 7.5 |
| Typing, slowest 10% of volunteers | 1.7 | 1 | motor | 1.7 |
| Typing, advanced typist (120 words per minute) | 10 | 1 | motor | 10 |
| Brain chip: imagined handwriting (Stanford, 2021) | 1.5 | 1 | brain-chip | 1.5 |
| Brain chip: attempted speech, Utah arrays (Stanford, 2023) | 5.7 | 1 | brain-chip | 5.7 |
| Brain chip: attempted speech, surface grid (UCSF, 2023) | 7.2 | 1 | brain-chip | 7.2 |
| Brain chip: everyday speech over 248 hours (UC Davis, 2024) | 2.9 | 1 | brain-chip | 2.9 |
| Brain chip: copying English sentences by point-and-click (Stanford, 2017) | 0.7 | 1 | brain-chip | 0.7 |
| Speed cards: one shuffled deck (IAM record) | 4.1 | 4.3 | memory | 17.7 |
| Memory League cards, online (52 cards) | 4.2 | 4.3 | memory | 18.4 |
| Memory League cards, live (52 cards) | 3.1 | 4.3 | memory | 13.4 |
| Memory League numbers, online (80 digits) | 7 | 3.3 | memory | 23.2 |
| Memory League numbers, live (80 digits) | 4.7 | 3.3 | memory | 15.8 |
| Random digits, 5 minutes (IAM record) | 2.1 | 3.3 | memory | 7 |
| Random digits, 15 minutes (IAM record) | 1.4 | 3.3 | memory | 4.8 |
| Random digits, 30 minutes (IAM record) | 1.2 | 3.3 | memory | 3.9 |
| Random digits, 1 hour (IAM record) | 0.9 | 3.3 | memory | 3.1 |
| Binary digits, 5 minutes (IAM record) | 4.9 | 1 | memory | 4.9 |
| Binary digits, 30 minutes (IAM record) | 3.5 | 1 | memory | 3.5 |
| Playing cards, 10 minutes (IAM record) | 0.9 | 4.3 | memory | 4 |
| Playing cards, 30 minutes (IAM record) | 0.7 | 4.3 | memory | 3.1 |
| Playing cards, 1 hour (IAM record) | 0.5 | 4.3 | memory | 2.2 |
| Spoken numbers, read aloud at 1 digit a second (IAM record) | 1 | 3.3 | memory | 3.3 |
| Rubik's Cube 3×3, single solve (WCA record) | 0.4 | 65.2 | puzzle | 26 |
| Rubik's Cube 3×3, average of 5 (WCA record) | 0.3 | 65.2 | puzzle | 18.6 |
| Rubik's Cube 3×3 one-handed (WCA record) | 0.2 | 65.2 | puzzle | 11.6 |
| Rubik's Cube 3×3 with feet (WCA record) | 0.1 | 65.2 | puzzle | 4.2 |
| Rubik's Cube 3×3 blindfolded, whole attempt (WCA record) | 0.1 | 65.2 | puzzle | 5.6 |
| Rubik's Cube blindfolded, looking phase only (12.78 s record of 2023) | 0.2 | 65.2 | puzzle | 11.8 |
| Multiple cubes blindfolded (WCA record) | 0 | 65.2 | puzzle | 1.2 |
| StarCraft, professional at 1,000 actions per minute | 16.7 | 1 | game | 16.7 |
| Tetris, top-tier players (3-4 pieces a second) | 3.5 | 2 | game | 7 |
| Naming objects in a 0.5-second glimpse (Sziklai 1956) | 2 | 20 | lab | 40 |
Embed this chart
Paste this HTML into your page: it carries the numbers and the credit link to this figure.
Different activities reach the same band by different routes. A cube state is rich (65.2 bits) but comes once every few seconds; a typed character is poor (about 1 bit) but comes several times a second; a syllable sits in between at about 6 bits. Multiply items per second by bits per item and most activities land between 1 and 40 bits per second.
11 Can a brain chip make you think or communicate faster?
No brain chip yet beats natural speech: the fastest published speech implant decodes 78 words per minute, about 7.2 bits per second, a fifth of the 39 bits/s of speech [11]. A Stanford speech implant reached 62 words per minute (5.7 bits/s) [10], and a UC Davis implant has run for 248 hours of everyday conversation at about 32 words per minute (2.9) [12]. These figures convert words per minute at 5.5 characters a word (Shannon’s 4.5 letters plus a space) and 1 bit per character.
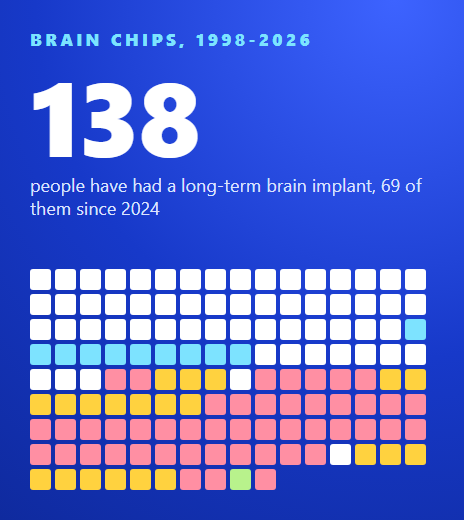
Earlier chips were slower. In 2017 a participant moving a cursor reached 3.7 bits per second on a grid of random targets, but copying English sentences at 39.2 correct characters a minute is only 0.65 bits/s, because English is predictable [8]. Imagined handwriting reached 90 characters a minute in 2021, 1.5 bits/s [9] [1]. These implants restore communication to people who have lost it; they are not a shortcut past the 10 bits/s of behaviour. Our count of people with brain implants lists every programme.
The best brain chip decodes 7.2 bits a second; speech carries 39
Best published rates of brain chips for people with paralysis, against people speaking, listening and typing. Words per minute converted at 5.5 characters a word and 1 bit per character (IQ Metrics calculation); the 2017 grid and 2021 handwriting rates are the papers' or Zheng and Meister's figures.
Source: Brain chips [8] [9] [10] [11] [12]; people [2] [1] [5]
Data table
| label | value |
|---|---|
| People: speaking, 17 languages | 39.1 |
| People: listening to narration | 13 |
| People: typing, average | 4.3 |
| Chip 2023: speech, surface grid | 7.2 |
| Chip 2023: speech, Utah arrays | 5.7 |
| Chip 2017: random grid | 3.7 |
| Chip 2024: everyday speech | 2.9 |
| Chip 2021: handwriting | 1.5 |
| Chip 2017: copying sentences | 0.7 |
Embed this chart
Paste this HTML into your page: it carries the numbers and the credit link to this figure.
12 Is "10 bits per second" right? The dispute
The 10 bits per second figure is contested, and the main gap is about method, not data. Speech at 39 bits per second counts the information in each syllable from a model of the language [2]; the 10 bits/s figure counts English text at about 1 bit per character, the entropy left after a reader predicts what comes next [6] [1]. Zheng and Meister point out that the 39 bits/s leaves out much of the redundancy of language, as the speech paper’s methods acknowledge. Counted the same way as typing, at 1 bit per character, listening at 160 words a minute is 13 bits/s and silent reading 22.2.
Other researchers argue for higher numbers. A 2025 Nature Neuroscience piece by Britton Sauerbrei and J. Andrew Pruszynski is titled “The brain works at more than 10 bits per second” [18]; we could read only its title, venue and pages. Two 2025 preprints from the same first author report up to 42 bits/s for memory athletes and above 215 bits/s for mental calculators, split into 125 bits/s of perception and 90 of calculation [16] [17]. Both are preprints and not yet peer reviewed.
Published estimates of human information rate, 1952 to 2025
Each estimate with its range where the authors give one. Not shown on this axis: the 2025 mental-calculation preprint (215 bits/s), the senses (about a billion) and the Nature Neuroscience reply titled "more than 10 bits per second", which we could not read. As printed in each source; ranges are the authors'.
Source: Hick, Fitts and Sziklai as reported by Zheng & Meister [1]; Licklider via Pierce & Karlin [7]; [8] [2] [16]
Data table
| label | low | estimate | high |
|---|---|---|---|
| Hick 1952: choice reaction | 5 | 5 | 5 |
| Fitts 1954: aimed movements | 10 | 11 | 12 |
| Licklider 1954: random words aloud | 30 | 32.5 | 35 |
| Sziklai 1956: naming objects | 30 | 40 | 50 |
| Pierce & Karlin 1957: rapid reading | 40 | 43 | 45 |
| Pandarinath 2017: brain chip | 1.4 | 3.7 | 3.7 |
| Coupe 2019: speech | 34 | 39.1 | 44.2 |
| Willett 2021: handwriting chip | 1.5 | 1.5 | 1.5 |
| Zheng & Meister 2025: behaviour | 5 | 10 | 20 |
| Wiederhold 2025: memory athletes | 42 | 42 | 42 |
Embed this chart
Paste this HTML into your page: it carries the numbers and the credit link to this figure.
Seventy-five years of measuring the speed of thought
Each dot is a published estimate or a record, by date; hover for the number. Dates within a year are approximate where the source gives only the year or month. As of 4 november 2026.
Source: Each source as dated [6] [7] [2] [19] [1] [8] [9] [10] [11] [12] [21] [16] [17] [18] [20]
Data table
| lane | type | from | to | label | detail |
|---|---|---|---|---|---|
| Language and reading | event | 1951-01 | Shannon: 1 bit per letter | Entropy of printed English, 0.6 to 1.3 bits per letter at 100 letters | |
| Language and reading | event | 1954-09 | Licklider: 30-35 bits/s | Reading random words aloud (MIT report, via Pierce & Karlin) | |
| Language and reading | event | 1957-03 | Pierce & Karlin: 43 bits/s | Rapid readers reading chosen word lists aloud | |
| Language and reading | event | 2019-09 | Coupe: 39 bits/s | Speech in 17 languages, 170 speakers | |
| Language and reading | event | 2026-07 | Gao: about 10 syllables/s | Speech comprehension falls above this rate | |
| Movement and perception | event | 1952 | Hick: about 5 bits/s | Choice reaction time (as reported by Zheng & Meister) | |
| Movement and perception | event | 1954 | Fitts: 10-12 bits/s | Aimed arm movements (as reported by Zheng & Meister) | |
| Movement and perception | event | 1956 | Sziklai: 30-50 bits/s | Objects named in half a second (as reported by Zheng & Meister) | |
| Brain chips | event | 2017-02 | Pandarinath: 3.7 bits/s | Point-and-click on a grid of random targets | |
| Brain chips | event | 2021-05 | Willett: 90 characters a minute | Imagined handwriting, about 1.5 bits/s | |
| Brain chips | event | 2023-08 | Willett and Metzger: 62 and 78 words a minute | Speech decoding, about 5.7 and 7.2 bits/s (IQ Metrics calculation) | |
| Brain chips | event | 2024-08 | Card: 32 words a minute, every day | Over 248 hours of use | |
| The 10 bits/s debate | event | 2024-08 | Zheng & Meister preprint | arXiv, 3 August 2024 | |
| The 10 bits/s debate | event | 2024-12 | Neuron paper: 10 bits/s | Online 17 December 2024 | |
| The 10 bits/s debate | event | 2024-12 | Caltech news release | 17 December 2024: "10 bits per second" | |
| The 10 bits/s debate | event | 2025-04 | Wiederhold: up to 42 bits/s | Memory athletes, short tasks | |
| The 10 bits/s debate | event | 2025-05 | Wiederhold, Stemmler, Herz: 215 bits/s | Mental calculation, shortest tasks | |
| The 10 bits/s debate | event | 2025-06 | Nature Neuroscience: "more than 10 bits per second" | Sauerbrei and Pruszynski; text not read | |
| The 10 bits/s debate | event | 2026-03 | Yin: a theory built on 10 bits/s | Uses the figure as given |
Embed this chart
Paste this HTML into your page: it carries the numbers and the credit link to this figure.
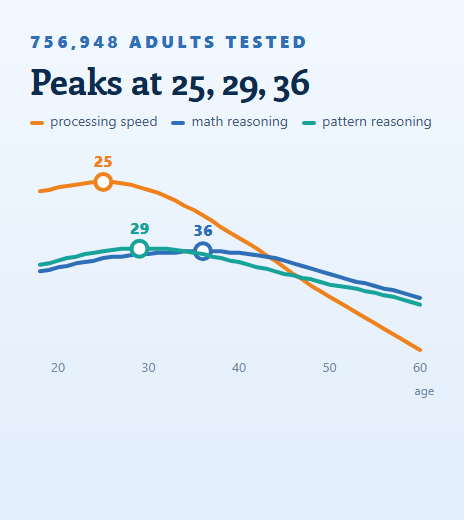
Our data support the order of magnitude and not the exact number: the median is 7.5 bits/s, 20 of 47 activities fall within a factor of 2 of 10, and the long-standing estimates cluster between 5 and 45. The more an activity is a sprint over seconds, the higher its rate; the longer it runs, the closer it falls to a few bits per second. Our peak brain age study shows how processing speed changes across a lifetime.
13 Does thinking faster mean a higher IQ?
Not directly: information rate is a property of a task, and none of the 47 activities here is an intelligence test, so no rate on this page converts to an IQ. IQ tests do include processing-speed subtests, and faster performance on them goes with higher scores on average, as processing speed and IQ explains; memory span and reasoning are related but separate (working memory and reasoning, memory and IQ).
Reasoning is not a speed contest. Test yours.
Our IQ test measures how you reason with patterns and compares your result with adults, with a percentile.
Take the IQ test14 Every activity and estimate in our dataset
Every activity in our dataset (47 rows)
Sorted by bits per second. Low to high = the entropy range (0.6 to 1.3 bits per character) for text rows, or the range the source gives. The CSV adds items per second, bits per item, the calculation and record holders.
| Brain chip: copying English sentences by point-and-click (Stanford, 2017) | Brain chip | 39.2 correct characters per minute | 2017 | 0.65 | 0.4 to 0.8 | Characters x bits per character | Pandarinath 2017 |
| Multiple cubes blindfolded (WCA record) | Puzzle | 63 of 65 cubes in 58:23 | 2025 | 1.17 | – | Items x bits per item | WCA records |
| Brain chip: imagined handwriting (Stanford, 2021) | Brain chip | 90 characters per minute | 2021 | 1.50 | – | Paper’s own figure | Willett 2021 |
| Typing, slowest 10% of volunteers | Typing | 20.91 words per minute (group mean) | 2018 | 1.74 | 1.0 to 2.3 | Characters x bits per character | Dhakal 2018 |
| Playing cards, 1 hour (IAM record) | Memory sport | 1,829 cards in 60 min | 2019 | 2.20 | – | Items x bits per item | IAM records |
| Brain chip: everyday speech over 248 hours (UC Davis, 2024) | Brain chip | 32 words per minute | 2024 | 2.93 | 1.8 to 3.8 | Characters x bits per character | Card 2024 |
| Playing cards, 30 minutes (IAM record) | Memory sport | 1,270 cards in 30 min | 2026 | 3.06 | – | Items x bits per item | IAM records |
| Random digits, 1 hour (IAM record) | Memory sport | 3,412 digits in 60 min | 2023 | 3.15 | – | Items x bits per item | IAM records |
| Spoken numbers, read aloud at 1 digit a second (IAM record) | Memory sport | 456 digits in a row | 2015 | 3.32 | – | Pace x bits per item | IAM records |
| Binary digits, 30 minutes (IAM record) | Memory sport | 6,270 binary digits in 30 min | 2017 | 3.48 | – | Items x bits per item | IAM records |
| Brain chip: point-and-click on a 6×6 grid of random targets (Stanford, 2017) | Brain chip | 3.7 bits per second (best of 3 participants; others 2.2 and 1.4) | 2017 | 3.70 | 1.4 to 3.7 | Paper’s own figure | Pandarinath 2017 |
| Random digits, 30 minutes (IAM record) | Memory sport | 2,132 digits in 30 min | 2026 | 3.94 | – | Items x bits per item | IAM records |
| Playing cards, 10 minutes (IAM record) | Memory sport | 550 cards in 10 min | 2019 | 3.98 | – | Items x bits per item | IAM records |
| Rubik’s Cube 3×3 with feet (WCA record) | Puzzle | 15.56 s | 2019 | 4.19 | 2.1 to 4.2 | Items x bits per item | WCA records |
| Typing, average of 168,960 volunteers | Typing | 51.56 words per minute (SD 20.2) | 2018 | 4.30 | 2.6 to 5.6 | Characters x bits per character | Dhakal 2018 |
| Random digits, 15 minutes (IAM record) | Memory sport | 1,300 digits in 15 min | 2019 | 4.80 | – | Items x bits per item | IAM records |
| Binary digits, 5 minutes (IAM record) | Memory sport | 1,467 binary digits in 5 min | 2019 | 4.89 | – | Items x bits per item | IAM records |
| Choice reaction: press the key for the lamp that lit (Hick 1952) | Lab task | 2 to 10 lamps, reaction times of hundreds of ms | 1952 | 5.00 | – | Paper’s own figure | Zheng & Meister 2025 |
| Rubik’s Cube 3×3 blindfolded, whole attempt (WCA record) | Puzzle | 11.56 s, look and solve | 2026 | 5.64 | 5.6 to 11.3 | Items x bits per item | WCA records |
| Brain chip: attempted speech, Utah arrays (Stanford, 2023) | Brain chip | 62 words per minute | 2023 | 5.68 | 3.4 to 7.4 | Characters x bits per character | Willett 2023 |
| Random digits, 5 minutes (IAM record) | Memory sport | 630 digits in 5 min | 2021 | 6.98 | – | Items x bits per item | IAM records |
| Tetris, top-tier players (3-4 pieces a second) | Video game | 3 to 4 pieces per second | 2024 | 7.00 | 7.0 to 20.7 | Paper’s own figure | Zheng & Meister 2025 |
| Brain chip: attempted speech, surface grid (UCSF, 2023) | Brain chip | 78 words per minute | 2023 | 7.15 | 4.3 to 9.3 | Characters x bits per character | Metzger 2023 |
| Typing, fastest 10% of volunteers | Typing | 89.56 words per minute (group mean) | 2018 | 7.46 | 4.5 to 9.7 | Characters x bits per character | Dhakal 2018 |
| Typing, advanced typist (120 words per minute) | Typing | 120 words per minute | 2024 | 10.00 | – | Paper’s own figure | Zheng & Meister 2025 |
| Thinking of a thing (the Twenty Questions game) | Perception | 20 bits in a few seconds | 2024 | 10.00 | – | Paper’s own figure | Zheng & Meister 2025 |
| Aimed arm movements between targets (Fitts 1954) | Lab task | 10 to 12 bits/s in 20-second sprees | 1954 | 11.00 | 10.0 to 12.0 | Paper’s own figure | Zheng & Meister 2025 |
| Rubik’s Cube 3×3 one-handed (WCA record) | Puzzle | 5.62 s | 2026 | 11.61 | 3.2 to 11.6 | Items x bits per item | WCA records |
| Rubik’s Cube blindfolded, looking phase only (12.78 s record of 2023) | Puzzle | 65 bits in about 5.5 s of inspection | 2023 | 11.80 | – | Paper’s own figure | Zheng & Meister 2025 |
| Listening to narration, English, 160 words per minute | Language | 160 words per minute | 2024 | 13.00 | – | Paper’s own figure | Zheng & Meister 2025 |
| Memory League cards, live (52 cards) | Memory sport | 16.86 s for 52 cards | 2016 | 13.38 | – | Items x bits per item | Memory League |
| Memory League numbers, live (80 digits) | Memory sport | 16.85 s for 80 digits | 2018 | 15.77 | – | Items x bits per item | Memory League |
| StarCraft, professional at 1,000 actions per minute | Video game | 1,000 actions per minute | 2024 | 16.70 | 10.0 to 16.7 | Paper’s own figure | Zheng & Meister 2025 |
| Reading aloud, English (adults) | Language | 183 words per minute (77 studies, 5,965 readers) | 2019 | 17.08 | 10.2 to 22.2 | Characters x bits per character | Brysbaert 2019 |
| Speed cards: one shuffled deck (IAM record) | Memory sport | 12.74 s for 52 cards | 2018 | 17.71 | – | Items x bits per item | IAM records |
| Memory League cards, online (52 cards) | Memory sport | 12.25 s for 52 cards | 2025 | 18.41 | – | Items x bits per item | Memory League |
| Rubik’s Cube 3×3, average of 5 (WCA record) | Puzzle | 3.51 s | 2026 | 18.58 | 3.5 to 18.6 | Items x bits per item | WCA records |
| Silent reading, English non-fiction (adults) | Language | 238 words per minute (190 studies, 18,573 readers) | 2019 | 22.21 | 13.3 to 28.9 | Characters x bits per character | Brysbaert 2019 |
| Silent reading, English fiction (adults) | Language | 260 words per minute | 2019 | 22.53 | 13.5 to 29.3 | Characters x bits per character | Brysbaert 2019 |
| Memory League numbers, online (80 digits) | Memory sport | 11.45 s for 80 digits | 2024 | 23.21 | – | Items x bits per item | Memory League |
| Rubik’s Cube 3×3, single solve (WCA record) | Puzzle | 2.51 s | 2026 | 25.99 | 3.7 to 26.0 | Items x bits per item | WCA records |
| Reading, from eye fixations (7-9 letters per 200-250 ms) | Language | 28 to 45 characters per second | 2024 | 36.50 | 28.0 to 45.0 | Paper’s own figure | Zheng & Meister 2025 |
| Speaking, average of 17 languages | Language | 39.15 bits/s (SD 5.10) from 170 speakers reading 15 texts | 2019 | 39.15 | 34.0 to 44.2 | Paper’s own figure | Coupe 2019 |
| Naming objects in a 0.5-second glimpse (Sziklai 1956) | Perception | 1 to 3 objects in 500 ms | 1956 | 40.00 | 30.0 to 50.0 | Paper’s own figure | Zheng & Meister 2025 |
| Memory athletes, shortest tasks (Wiederhold 2025, preprint) | Memory sport | up to 42 bits/s | 2025 | 42.00 | – | Paper’s own figure | Wiederhold 2025 (preprint) |
| Reading lists of words aloud as fast as possible | Language | about 43 bits/s for rapid readers (a lower bound) | 1957 | 43.00 | 40.0 to 45.0 | Paper’s own figure | Pierce & Karlin 1957 |
| Mental calculation, shortest competition tasks (Wiederhold 2025, preprint) | Mental calculation | above 215 bits/s (125 perceiving + 90 calculating) | 2025 | 215.00 | 125.0 to 215.0 | Paper’s own figure | Wiederhold 2025 (preprint) |
Source: Our dataset [1] [2] [4] [5] [13] [14] [15] [8] [9] [10] [11] [12] [7] [16] [17]
Every published estimate we found (17)
"Via" = we read the figure in a later paper that reports it, not in the original. Abstract = the paper's abstract only.
| 1951 | Shannon | Entropy of printed English, 100 letters of context | 1 | 0.6 to 1.3 | bits per letter | full text |
| 1952 | Hick | Choice reaction time: rate of gain of information | 5 | – | bits/s | via Zheng & Meister |
| 1954 | Fitts | Aimed movements of the arm | 11 | 10 to 12 | bits/s | via Zheng & Meister |
| 1954 | Licklider, Stevens and Hayes | Reading random dictionary words aloud | 32.5 | 30 to 35 | bits/s | via Pierce & Karlin |
| 1956 | Sziklai | Naming objects in a 0.5 s glimpse | 40 | 30 to 50 | bits/s | via Zheng & Meister |
| 1957 | Pierce and Karlin | Reading chosen word lists aloud, rapid readers | 43 | 40 to 45 | bits/s | full text |
| 2017 | Pandarinath et al. | Brain chip: point and click on a grid | 3.7 | 1.4 to 3.7 | bits/s | full text |
| 2019 | Coupe, Oh, Dediu and Pellegrino | Speech in 17 languages | 39.15 | 34.05 to 44.25 | bits/s | full text + data |
| 2021 | Willett et al. (as computed by Zheng & Meister) | Brain chip: imagined handwriting | 1.5 | – | bits/s | via Zheng & Meister |
| 2025 | Zheng and Meister | Human behaviour in general (“10 bits/s”) | 10 | 5 to 20 | bits/s | full text (arXiv v2) |
| 2025 | Zheng and Meister | Sensory input, all senses | 1 billion | – | bits/s | full text (arXiv v2) |
| 2024 | Caltech news release | Thought “10 bits per second”; senses “a billion bits per second” | 10 | – | bits/s | full text |
| 2025 | Wiederhold (preprint) | Memory athletes, shortest tasks | 42 | – | bits/s | abstract |
| 2025 | Wiederhold, Stemmler and Herz (preprint) | Mental calculation, shortest tasks | 215 | 125 to 215 | bits/s | abstract |
| 2025 | Sauerbrei and Pruszynski | “The brain works at more than 10 bits per second” (Nature Neuroscience) | – | – | bits/s | title and venue |
| 2026 | Gao et al. | Speech comprehension falls above about 10 syllables a second | 10 | – | syllables/s | abstract |
| 2026 | Yin (preprint) | Builds a theory of cognitive reserve on the 10 bits/s gap | 10 | – | bits/s | abstract |
15 How we built the dataset
- 01
Pick a record or study per activity
One named source per row: a journal paper, a records body (International Association of Memory, Memory League, World Cube Association), or our own earlier studies of memory records and brain implants, which cite their primary sources. Blogs and news were leads only. Guinness World Records data were not used.
- 02
Read every number by script
Every source was saved and every figure printed here was matched by a script against the saved text (57 checks); a figure that is not found stops the build. Paywalled papers are cited for facts only.
- 03
One method per row
The paper’s own bits per second where it computed them; otherwise characters per second x bits per character for text (Shannon: 0.6 to 1.3, central 1.0), or items per second x the exact bits per item (digit 3.322, card in a deck 4.338, deck 225.6, cube state 65.23). Words per minute: 5 characters a word for typing, 5.6 or 5.2 for reading (Brysbaert’s word lengths plus a space), 5.5 for speech.
- 04
Keep low and high
Where the entropy assumption matters, the row carries a low and a high. Sighted cube solves carry a low that adds the 15 seconds of untimed inspection.
- 05
Recompute what is open
The speech data of Coupe et al. are open under CC BY 4.0, so we recomputed every language from 2,288 readings; the paper’s model figures are quoted next to ours.
Read every number with these in mind
- Bits per second depend on the model of the material. A different entropy for English, or a different count of possibilities, moves a text row by up to the low-to-high range shown.
- Records are extremes and studies are averages; the dataset mixes both on purpose and labels each row (record, typical, lab).
- Memory rates count memorising time only, and scores as printed; recall time and errors are not modelled. Sighted cube rates ignore up to 15 seconds of inspection.
- Zheng and Meister’s figures were read in the arXiv version (v2, 15 November 2024); the journal version could not be downloaded. Hick, Fitts and Sziklai are cited through Zheng and Meister.
- The Nature Neuroscience reply and the full texts of the two 2025 preprints were not read; only titles or abstracts are used.
- No activity here is an intelligence test, and no rate on this page says anything about one person’s ability.
Sources
- Neuron (Cell Press). Zheng J, Meister M: The unbearable slowness of being: Why do we live at 10 bits/s? Neuron 2025;113(2):192-204 (online 17 December 2024; read in arXiv:2408.10234 v2, 15 November 2024). 2025. doi.org/10.1016/j.neuron.2024.11.008Neuron: Elsevier user licence; arXiv v2: CC BY-NC-ND 4.0. Facts and the authors' figures cited; table not copied
- Science Advances (AAAS). Coupe C, Oh YM, Dediu D, Pellegrino F: Different languages, similar encoding efficiency: Comparable information rates across the human communicative niche. Science Advances 2019;5(9):eaaw2594. 2019. doi.org/10.1126/sciadv.aaw2594Paper CC BY-NC 4.0 (facts cited); read in full (Europe PMC)
- GitHub, keruiduo/SupplMatInfoRate. Coupe C, Oh YM, Dediu D, Pellegrino F: Supplementary data for "Different languages, similar encoding efficiency" (InfoRateData.csv, 2,288 text readings). 2019. github.com/keruiduo/SupplMatInfoRateCC BY 4.0 (data, per the repository README)
- Journal of Memory and Language (Elsevier). Brysbaert M: How many words do we read per minute? A review and meta-analysis of reading rate. Journal of Memory and Language 2019;109:104047 (read in the PsyArXiv preprint, doi:10.31234/osf.io/xynwg). 2019. doi.org/10.1016/j.jml.2019.104047Facts cited (preprint read in full)
- ACM CHI 2018. Dhakal V, Feit AM, Kristensson PO, Oulasvirta A: Observations on typing from 136 million keystrokes. CHI 2018, Montreal, paper 646. 2018. doi.org/10.1145/3173574.3174220Facts cited (authors' PDF read in full)
- Bell System Technical Journal. Shannon CE: Prediction and entropy of printed English. Bell System Technical Journal 1951;30(1):50-64. 1951. archive.org/details/bstj30-1-50Facts cited (scan read in full)
- Bell System Technical Journal. Pierce JR, Karlin JE: Reading rates and the information rate of a human channel. Bell System Technical Journal 1957;36(2):497-516. 1957. archive.org/details/bstj36-2-497Facts cited (scan read in full)
- eLife. Pandarinath C, Nuyujukian P, Blabe CH, et al.: High performance communication by people with paralysis using an intracortical brain-computer interface. eLife 2017;6:e18554. 2017. doi.org/10.7554/eLife.18554CC0 (per Europe PMC); read in full
- Nature. Willett FR, et al.: High-performance brain-to-text communication via handwriting. Nature 2021;593:249-254. 2021. pubmed.ncbi.nlm.nih.gov/33981047Facts cited (as in our brain implant study)
- Nature. Willett FR, et al.: A high-performance speech neuroprosthesis. Nature 2023;620:1031-1036. 2023. pubmed.ncbi.nlm.nih.gov/37612500Facts cited (as in our brain implant study)
- Nature. Metzger SL, et al.: A high-performance neuroprosthesis for speech decoding and avatar control. Nature 2023;620:1037-1046. 2023. pubmed.ncbi.nlm.nih.gov/37612505Facts cited (as in our brain implant study)
- New England Journal of Medicine. Card NS, et al.: An accurate and rapidly calibrating speech neuroprosthesis. New England Journal of Medicine 2024;391:609-618. 2024. pubmed.ncbi.nlm.nih.gov/39141853Facts cited (as in our brain implant study)
- IAM. International Association of Memory: world record histories by discipline (speed cards, numbers, binary, cards, spoken numbers). 2026. iam-stats.org/discipline-record-history.php?id=SPDCARDSFacts cited; read through our memory world records data (memory_records.tsv)
- IAM / Memory League. Memory League world records (live and online), as mirrored by the IAM statistics site. 2026. iam-stats.org/records_ml.phpFacts cited; read through our memory world records data
- World Cube Association. World Cube Association: official world records (records API, read 4 November 2026), Regulations A3a1 (inspection) and the results export format (multi-blind code). 2026. www.worldcubeassociation.org/results/recordsFacts cited
- bioRxiv. Wiederhold B: The speed limits of memory. bioRxiv preprint 2025, doi:10.1101/2025.03.31.646314. 2025. doi.org/10.1101/2025.03.31.646314CC BY-NC-ND 4.0; abstract read (via OpenAlex); not peer reviewed
- bioRxiv. Wiederhold B, Stemmler M, Herz AVM: Mental calculation speeds surpass known limits for high-level cognition. bioRxiv preprint 2025, doi:10.1101/2025.05.28.656137. 2025. doi.org/10.1101/2025.05.28.656137CC BY-NC-ND 4.0; abstract read (via OpenAlex); not peer reviewed
- Nature Neuroscience. Sauerbrei B, Pruszynski JA: The brain works at more than 10 bits per second. Nature Neuroscience 2025;28(7):1365-1366. 2025. doi.org/10.1038/s41593-025-01997-0Title, venue and pages read (Crossref); text behind a bot check, not read
- Proceedings of the National Academy of Sciences. Gao Y, Fan J, Xu N, et al.: Alpha rhythms in the left auditory cortex set the speed limit for speech comprehension. PNAS 2026. 2026. doi.org/10.1073/pnas.2601610123CC BY-NC-ND 4.0; abstract read (via OpenAlex)
- bioRxiv. Yin D: The 10 bits/s bottleneck as error-correcting redundancy: an information-theoretic theory of cognitive reserve. bioRxiv preprint 2026. 2026. doi.org/10.64898/2026.03.24.713899CC BY 4.0; abstract read (via OpenAlex); not peer reviewed
- California Institute of Technology. Caltech news: "Thinking Slowly: The Paradoxical Slowness of Human Behavior", 17 December 2024. 2024. www.caltech.edu/about/news/thinking-slowly-the-paradoxical-slowness-of-human-behaviorFacts and two short quotes cited
- OurResearch (OpenAlex). OpenAlex: works citing Zheng & Meister 2025 (W4405497816), queried 4 November 2026. 2026. api.openalex.org/works?filter=cites:W4405497816CC0
Version history
- 2026.114 November 2026First release. Next update due May 2027, or sooner when the two 2025 preprints are published in journals, a memory or cube world record changes, or a brain chip passes 10 bits per second.
Leon Falkner, Data & Research Analyst. Leon owns the arithmetic on IQ Metrics: the percentile tables, the score converter and the figures in everyone else's drafts. On the research desk Leon pulls the data, builds each index and writes the method. More about Leon.
Questions
How fast do humans think?
About 10 bits per second by the best-known estimate (Zheng and Meister, Neuron 2025). The 47 activities IQ Metrics scored, from typing to speedcubing, have a median of 7.5 bits per second; speech runs at about 39.
What does 10 bits per second mean?
Ten yes-or-no answers a second, enough to pick one item out of about a thousand each second. A typist copying English at 120 words a minute transmits about that much, because English carries about 1 bit per character.
How fast does the brain process information from the senses?
About a billion bits per second at the input, by Zheng and Meister's estimate: the 6 million cones of one eye can carry about 1.6 billion bits/s and the optic nerve about 100 million. Behaviour uses about 10, a ratio of 100 million.
How fast can humans talk in bits per second?
About 39 bits per second: Coupe and colleagues measured 39.15 bits/s across 17 languages and 170 speakers. Our recalculation of their open data gives 33.8 to 45.9 bits/s by language, because fast languages carry less per syllable.
How fast can humans read?
Adults read English non-fiction silently at 238 words per minute (Brysbaert 2019), about 22.2 bits per second at 1 bit per character, or 13.3 to 28.9 across Shannon's range. Rapid readers reading word lists aloud reached about 43 bits/s in 1957.
How fast can humans type in bits per second?
The average of 168,960 typists, 51.56 words per minute, is about 4.3 bits per second; the fastest tenth average 89.56 words per minute, about 7.5 bits per second. A 120-word-per-minute typist reaches about 10.
Is anyone faster than 10 bits per second?
Yes, in short bursts. The speed-cards record is 17.7 bits per second and the Memory League numbers record 23.2; a 2025 preprint reports mental calculators above 215. Over an hour, memory records fall to about 3.1 bits per second.
Can a brain chip let you communicate faster than speech?
Not yet. The fastest published speech implant decodes 78 words per minute, about 7.2 bits per second, a fifth of natural speech; the 2021 handwriting implant reached about 1.5 bits per second.
Is the 10 bits per second figure right?
As an order of magnitude, our data agree: 20 of 47 activities sit within a factor of 2 of it. It is disputed: a 2025 Nature Neuroscience piece argues for more, and speech measured another way gives 39 bits per second.
Does thinking faster mean a higher IQ?
Not directly. Bits per second describe a task, not a person, and none of these tasks is an IQ test. Processing-speed subtests do correlate with IQ scores on average, but speed is one part of intelligence, not a measure of it.
Share it, cite it, download it
You may reuse everything on this page under CC BY 4.0: in articles, reports, lessons and posts. The one condition is credit to IQ Metrics with a link to this page.
Cite this study
Version 2026.11. Citing the version lets readers find the exact numbers.
Archived copy with a DOI: 10.5281/zenodo.23939704 (report PDF and data on Zenodo).
Falkner, L. (2026). How fast do humans think? 47 activities measured in bits per second (Version 2026.11) [Data set]. IQ Metrics Research. https://iqmetrics.org/research/how-fast-do-humans-think/ (DOI: 10.5281/zenodo.23939704)
Falkner, Leon. "How fast do humans think? 47 activities measured in bits per second." IQ Metrics Research, 4 Nov. 2026, iqmetrics.org/research/how-fast-do-humans-think/. DOI: 10.5281/zenodo.23939704.
Falkner, Leon. "How fast do humans think? 47 activities measured in bits per second." IQ Metrics Research. November 4, 2026. https://iqmetrics.org/research/how-fast-do-humans-think/. DOI: 10.5281/zenodo.23939704.
@misc{iqmetrics2026howfastdohumansthink, author = {Falkner, Leon}, title = {How fast do humans think? 47 activities measured in bits per second}, institution = {IQ Metrics}, year = {2026}, version = {2026.11}, doi = {10.5281/zenodo.23939704}, url = {https://iqmetrics.org/research/how-fast-do-humans-think/} }
Source: Leon Falkner, "How fast do humans think? 47 activities measured in bits per second." IQ Metrics Research, version 2026.11, https://iqmetrics.org/research/how-fast-do-humans-think/ (DOI 10.5281/zenodo.23939704)
Embed the key numbers
Paste this into an article or post. It lists the main numbers and credits the source.
Get the data
One row per activity (47 rows): the human figure from a named record or study, the item and items per second, bits per item, the method, bits per second with a low and a high where the entropy assumption matters, the source paper’s own figure where it gave one, the calculation in words, the source and the record holder.
| Column | What it holds |
|---|---|
id, activity, category, level | Row key, what people do, type (language, motor, memory, puzzle, game, lab, perception, brain-chip, calculation), and record, typical or lab |
human_figure, year | The figure as the source prints it, and the year of the record or study |
item, items_per_second, bits_per_item | The unit counted (character, syllable, digit, card, cube state …), how many per second, and the bits in each |
method | paper (the source's own bits per second), text (characters x bits per character), count (items x bits per item) or pace (count, pace set by the task) |
bits_per_second, bits_per_second_low, bits_per_second_high | Our central figure and the low and high where the entropy assumption or the source's range matters |
source_paper_figure | The bits per second the source paper printed, where it printed one |
how_calculated, source, record_holder | The calculation in words, the source, and the record holder for records |
For journalists, researchers and teachers
Everything on this page may be quoted, charted and republished with credit. No embargo, no permission needed, no sign-up. If you need a number that is not here, ask.
Summary you can paste
Plain news style. Edit freely; keep the credit.
IQ Metrics Research turned 47 human activities into bits per second, each from a named record or study with one stated method: speech, reading, typing, memory sports, the Rubik's Cube, video games, lab tasks and brain chips. The median is 7.5 bits per second and 20 of 47 sit within a factor of 2 of the "10 bits per second" estimate of Zheng and Meister (Neuron, 2025); speech carries about 39. We also recomputed speech rates for 17 languages from open data and traced the published estimates since 1951. Source: IQ Metrics Research, https://iqmetrics.org/research/how-fast-do-humans-think/
Angles for a story
- Every activity on one scale: 24 of 47 below 10 bits per second (Figure 1)
- The fastest talkers say the least per syllable (Figure 5, Figure 6)
- Memory champions: 23 bits a second for 12 seconds, 3 over an hour (Figure 9)
- Brain chips still decode a fifth of the speed of speech (Figure 11)
- From “a billion” to “the trillion”: how the senses figure grew in one press release (Figure 3)
- Seventy-five years of estimates, from Shannon to the 2025 replies (Figure 13)
Quotes you can use
Attributable as written, with the name and title. For a different angle or a quote on a specific figure, ask through the contact page.
Ten bits per second sounds absurdly slow until you check it. Typing, reading, memory records and the Rubik’s Cube all land between about 1 and 40.
Leon Falkner, Data & Research Analyst, IQ Metrics ResearchThe fastest human figures are sprints. A memory champion can take in more than 20 bits a second for 12 seconds; over an hour it is about 3.
Leon Falkner, Data & Research Analyst, IQ Metrics ResearchSpeech is the fast lane. Every one of 17 languages lands near 39 bits a second, because the fast talkers say less with each syllable.
Leon Falkner, Data & Research Analyst, IQ Metrics Research
Files
- CSV of every activity, with the human figure, items per second, bits per item, method, bits per second with low and high, source and record holder (CC BY 4.0)
- Every figure as a print-ready PNG: use the Image button under each figure
- Embed code and data table under every figure
- Share images for social media in three sizes, with the credit line built in
- Citations in APA, MLA, Chicago, BibTeX and plain text
Terms, contact and corrections
Credit: “IQ Metrics Research, How fast do humans think? (2026)” with a link to this page. On air or in print, “IQ Metrics” and the page address are enough.
What it covers: 47 human activities from records and studies 1951 to 2026, 17 published estimates, and 17 languages recomputed from open data, as of 4 November 2026.
Contact: the research team, through the contact page. Corrections are made on this page with a dated note in the version history.