





Reaction Time Test: How to Measure It, Why Online Scores Run Slow and What Changes It
A reaction time test depends on the equipment: 203 ms with a falling rod, 231 ms on a calibrated computer, 273 ms online. See the ruler drop conversion table, why online scores run slow, driving and sprint reaction times, and what really changes your speed.

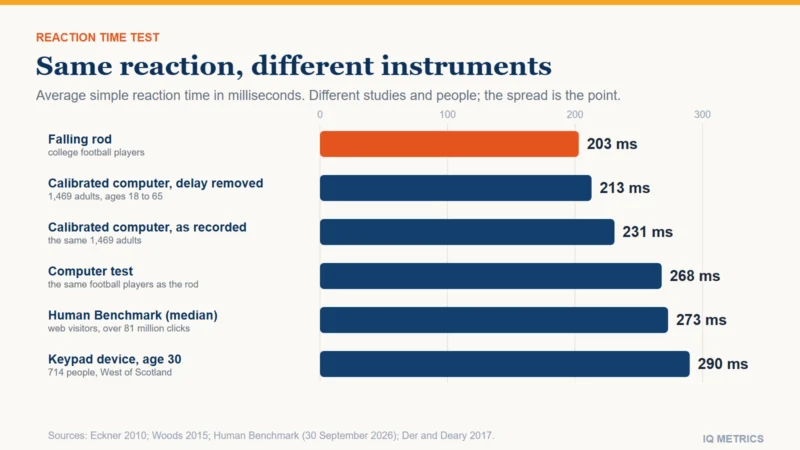
A reaction time test measures the delay between a signal and your response, and the result depends on the equipment as much as on you. A ruler drop test needs only a ruler: catching it after 20 cm means about 202 ms of fall, though that includes closing your fingers. Online tests add lag. Robot-pressed keys on realistic browser set-ups lagged by about 80 ms on average, and college football players averaged 203 ms with a falling rod but 268 ms on a computer. Real-world reactions are slower than a lab click: drivers need about 0.7 second when they expect a signal and 1.5 seconds for a surprise. Sleep loss slows responses, and simple reaction time barely trains. For average reaction times by age and the link to IQ, see our news guide to average reaction time by age; this guide covers how to measure reaction time, why online scores run slow and what changes it.
- Ruler drop: 10 cm is about 143 ms, 20 cm about 202 ms and 30 cm about 247 ms (our calculation); the simple ruler drop had poor test-retest reliability in older adults (0.57).
- Online lag: web set-ups added about 80 ms on average in robot tests, and at least 30 ms on all 19 computers in an earlier check.
- Same people, two tests: 203 ms with a falling rod and 268 ms on a computer in college football players.
- Driving: about 0.7 second expected, 1.25 seconds unexpected, 1.5 seconds for a surprise; road design uses 2.5 seconds.
- Sleep: after 17 to 19 hours awake, response speeds were “up to 50% slower for some tests.”
- Practice: simple reaction time did not differ by sport or skill in baseball, tennis and non-athlete groups.
How does a reaction time test work?
Simple reaction time is one stimulus and one response, such as pressing a button when a light comes on. Choice reaction time adds decisions, such as pressing the button that matches one of four lights, and takes about twice as long. A careful lab test looks like this: in a 2015 study of 1,469 adults aged 18 to 65 in New Zealand, people sat 0.7 m from a monitor, practiced for 20 trials, then did 120 test trials with a random wait of 1,000 to 1,800 ms before each signal, using a gaming mouse (Woods et al. 2015). Responses outside a window of 110 to 1,000 ms did not count. The average was 231 ms, or 213 ms after subtracting 17.8 ms of measured screen and mouse delay.
Three features of a good test come straight from those numbers. A random wait matters, because reactions were about 15% slower after the shortest wait than the longest, a gap of about 28 ms. Fatigue matters within a sitting: mean reaction time rose from 228.1 ms in the first block of 20 trials to 237.2 ms in the sixth. And one click is noisy, since a person’s own trial-to-trial standard deviation was about 40 ms on the calibrated test and 72 ms on a keypad device at age 30, so several trials should be averaged. Human Benchmark itself tells users to perform “at least 5 clicks.”
The ruler drop test: what the distance means
The ruler drop test needs no equipment beyond a 30 cm ruler and a friend. The dropper releases it without warning, you catch it, and the distance fallen gives the time from falling-object physics, t = √(2d/g). Our conversion, ignoring air resistance:
| Distance fallen | Time | Distance fallen | Time |
|---|---|---|---|
| 5 cm | 101 ms | 30 cm | 247 ms |
| 10 cm | 143 ms | 35 cm | 267 ms |
| 15 cm | 175 ms | 40 cm | 286 ms |
| 20 cm | 202 ms | 45 cm | 303 ms |
| 25 cm | 226 ms | 50 cm | 319 ms |
Hold the ruler with its zero at the top of your open thumb and finger, and have the dropper vary the moment of release so you cannot time it. The time includes closing your fingers, so it is not a pure reaction time, but it has no screen or input lag. That is why it reads shorter than a computer: in college football players a falling rod averaged 203 ms and a computerized test 268 ms, and the two correlated only .445 in the 68 whose computer tests passed an integrity check (Eckner et al. 2010). In a study of 903 adults in Sri Lanka, 95% caught the ruler at or under 40 cm (about 286 ms of fall time), and the authors proposed more than 40 cm as a screen for alcohol intoxication (Rajapaksha et al. 2023). Do not treat a single drop as precise. In 51 older adults the simple ruler drop had poor test-retest reliability (intraclass correlation 0.57) a week apart, and its correlation with a computer test was .42 (Ferreira et al. 2024).
Why online reaction tests read slower than the lab
Human Benchmark, the best-known online test, says its own median is 273 ms “according to the data collected so far” and its mean 284 ms across more than 81 million clicks, and warns that the test “is affected by the latency of your computer and monitor.” Its test page adds, without naming a source, that “an average human reaction time may fall between 200-250ms” and that your computer “could be adding 10-50ms on top.” Its statistics page says recorded times have gotten slightly slower over the years, “almost certainly due to changes in input / display technology.”
Independent checks agree that hardware matters. Robot-pressed keys on realistic browser set-ups showed response times that “on average lag 80 ms, and extend to 100 ms on some set-ups” (Anwyl-Irvine et al. 2021). An earlier test of 19 computers found that “all systems overestimated response times, by at least 30 ms” (Reimers and Stewart 2015). A comparison of five cognitive tasks found “a fixed additive timing offset” of 37 ms for web technology and 87 ms for recording online, against lab data (Semmelmann and Weigelt 2017). In the calibrated study the screen and mouse alone added 17.8 ms. Because much of the lag looks like a fixed offset, comparing your own score across days on the same device is more informative than comparing it with a stranger’s on another.
| Measurement | Mean | Who and how |
|---|---|---|
| Falling rod, college football players | 203 ms | Eckner et al. 2010: 94 US Division I players, rod caught by hand |
| Calibrated computer test, delay subtracted | 213 ms | Woods et al. 2015: 1,469 adults aged 18 to 65 in New Zealand |
| Calibrated computer test, as recorded | 231 ms | Same study, before subtracting 17.8 ms of delay |
| Computer test, same football players | 268 ms | Same study, computerized simple reaction time |
| Human Benchmark, all visitors | 273 ms median; 284 ms mean | Self-selected web visitors, over 81 million clicks, lag included |
| Keypad device, age 30 | 290 ms | Der and Deary 2017: 714 people in West Scotland |
Reaction time on the road
Lab reaction time is only the first part of stopping a car. Marc Green’s review of driver studies found that when drivers fully expect a brake signal they need about 0.70 to 0.75 second to detect it and move the foot to the brake, about 1.25 seconds for an unexpected but common signal such as brake lights, and roughly 1.5 seconds for a surprise such as an object moving into the path (Green 2000). Green’s own website adds that a standard perception-brake time “cannot and does not exist.” Highway design uses a longer figure: the Iowa Department of Transportation’s manual, following the AASHTO Green Book, specifies a brake reaction time of 2.5 seconds in its stopping-distance formula. At 60 mph (26.8 m/s), our calculation gives 6.7 m covered in 0.25 second, 18.8 m in 0.7 second, 40.2 m in 1.5 seconds and 67.1 m in 2.5 seconds. A meta-analysis of 33 driving studies (94 effect sizes, about 2,000 participants) found that phone-related tasks added a mean of 0.25 second to reaction times, with handheld phones and phones used without holding them causing similar decrements (Caird et al. 2008).
Reaction time in sport
Sprinting sets the fast end. World Athletics counts a reaction under 0.100 second as a false start, a rule that a 2021 paper on hurdlers also cites, and the threshold is disputed: a study of nine sprinters and ex-sprinters found five with mean reaction times under 100 ms in at least one condition, measured as the start of force in the blocks (Pain and Hibbs 2007). That is a force-plate measurement with an athlete already braced, not the reaction of a relaxed finger. Formula 1 quotes are looser still. Valtteri Bottas said his first movement after the lights went out in 2019 took “four-hundredths,” and clarified that this was the paddle, not the car moving; in 2017 Sebastian Vettel said that “normally, the reactions are 0.2s for everyone.” Treat those as driver statements, not measurements. Athletes are not necessarily faster on a simple test: in 82 university students and 17 professional baseball players, and in 94 senior high school students followed for two years, “there were no differences in simple reaction time either for sports experience or for skill levels,” although Go/No-go reaction time improved with hitting practice (Kida et al. 2005).
Where would your own score land?
Take the IIF-certified assessment and get your score with the scale it was measured on, the percentile it corresponds to and the confidence range around it — the three figures most online tests leave out.
Find your IQ score now! →What changes your reaction time?
- Sleep loss: in 39 transport and army volunteers, after 17 to 19 hours awake “performance on some tests was equivalent or worse” than at a blood alcohol level of 0.05%, and “response speeds were up to 50% slower for some tests” (Williamson and Feyer 2000). See our guides to sleep and IQ and sleep loss and test performance.
- Fatigue and waiting time: both shift results within a single sitting, as the lab numbers above show.
- Practice: simple reaction time barely trains, as the sport data show; choice and Go/No-go reaction times can improve.
- Caffeine: small trials suggest it speeds responses through attention, with effects that vary by dose and task; see our guide to caffeine and test performance.
- Video games: the evidence is contested. One review says the very act of playing action video games “significantly reduces reaction times without sacrificing accuracy” (Dye et al. 2009), while a 2018 meta-analysis found “small or null overall effect sizes” for cognitive ability (Sala et al. 2018); see video games and IQ.
- Age: about 0.55 ms slower per year between 18 and 65 in the calibrated test, with trial-to-trial variability growing after 60.
Age, IQ and what a fast reaction time means
Two questions come up next, and our news guide to average reaction time by age and what it says about IQ answers them in detail. In brief: in the calibrated test, group means rose from about 218 ms at a mean age of 21 to 239 ms at 62, and on a keypad device three Scottish cohorts averaged 290, 318 and 354 ms at ages 30, 50 and 69 (Der and Deary 2017). The same study found simple reaction time correlated between −0.27 and −0.32 with a timed reasoning test, and four-choice reaction time between −0.44 and −0.53. Those are observed correlations, worth about 7% to 28% of shared variance (our calculation), so a click score cannot tell you your IQ. Speed is one strand of a full test; see our guide to processing speed and IQ and the timed IQ test page.
Quick answers
- What is a good reaction time? On a computer, roughly 200 to 300 ms is ordinary; the device changes the number by tens of milliseconds, so compare like with like.
- How accurate is an online reaction time test? It includes screen, input and browser lag: robot tests found about 80 ms on average, and Human Benchmark says its own scores are affected by latency.
- How do you do the ruler drop test? Have a friend drop a ruler without warning, catch it, read the distance and convert it: 20 cm is about 202 ms. Average several drops.
- What is the average reaction time when driving? About 0.7 second when expected, 1.25 seconds when unexpected and 1.5 seconds for a surprise (Green 2000); road design uses 2.5 seconds.
- Can you improve your reaction time? Simple reaction time barely changes with practice; sleep, attention and the task matter more.
- Does reaction time measure IQ? Only weakly: correlations of −0.27 to −0.32 for simple and −0.44 to −0.53 for four-choice reaction time in three Scottish cohorts.
The bottom line
A reaction time score is a reading from an instrument. The same person can score 203 ms with a falling rod, 231 ms on a calibrated computer and close to 300 ms on a phone or keypad, and the difference is mostly the device. Use the ruler drop for a quick comparison with no screen lag, average several trials, test when rested, and compare yourself with yourself on the same device. If you want a measure of reasoning rather than speed, a timed IQ test asks for both under standard conditions, and our digit span guide covers a different short-term-memory measure.
Sources
- Woods, D.L., Wyma, J.M., Yund, E.W., Herron, T.J. and Reed, B. (2015): Factors influencing the latency of simple reaction time, Frontiers in Human Neuroscience, 9, 131.
- Der, G. and Deary, I.J. (2017): The relationship between intelligence and reaction time varies with age: results from three representative narrow-age age cohorts at 30, 50 and 69 years, Intelligence, 64, 89-97.
- Human Benchmark: Reaction time statistics and test page (median 273 ms, mean 284 ms), checked 30 September 2026.
- Anwyl-Irvine, A., Dalmaijer, E.S., Hodges, N. and Evershed, J.K. (2021): Realistic precision and accuracy of online experiment platforms, web browsers, and devices, Behavior Research Methods, 53(4), 1407-1425.
- Reimers, S. and Stewart, N. (2015): Presentation and response timing accuracy in Adobe Flash and HTML5/JavaScript web experiments, Behavior Research Methods, 47(2), 309-327.
- Semmelmann, K. and Weigelt, S. (2017): Online psychophysics: reaction time effects in cognitive experiments, Behavior Research Methods, 49(4), 1241-1260.
- Eckner, J.T., Kutcher, J.S. and Richardson, J.K. (2010): Pilot evaluation of a novel clinical test of reaction time in National Collegiate Athletic Association Division I football players, Journal of Athletic Training, 45(4), 327-332.
- Rajapaksha, S. et al. (2023): The establishment of a population-specific reference value for the ruler drop test for the clinical assessment of reaction time, Journal of Forensic and Legal Medicine, 96, 102525.
- Ferreira, S. et al. (2024): Validity and reliability of a ruler drop test to measure dual-task reaction time, choice reaction time and discrimination reaction time, Aging Clinical and Experimental Research, 36, 61.
- Green, M. (2000): “How long does it take to stop?” Methodological analysis of driver perception-brake times, Transportation Human Factors, 2(3), 195-216; and Green’s driver reaction time page.
- Iowa Department of Transportation: Design Manual, Chapter 6, Section 6D-1, Sight Distance (brake reaction time of 2.5 s).
- Caird, J.K., Willness, C.R., Steel, P. and Scialfa, C. (2008): A meta-analysis of the effects of cell phones on driver performance, Accident Analysis and Prevention, 40(4), 1282-1293.
- Pain, M.T.G. and Hibbs, A. (2007): Sprint starts and the minimum auditory reaction time, Journal of Sports Sciences, 25(1), 79-86.
- Ntolaptsis, K. and Panoutsakopoulos, V. (2021): Relationship between reaction time, medal winning and performance in the 60 m hurdle indoor event before and after the change of false start rule, Acta Facultatis Educationis Physicae Universitatis Comenianae, 61(1), 72-85.
- Motorsport.com: Bottas on his start reaction time (25 October 2019), and the 2017 Austrian Grand Prix report.
- Williamson, A.M. and Feyer, A.M. (2000): Moderate sleep deprivation produces impairments in cognitive and motor performance equivalent to legally prescribed levels of alcohol intoxication, Occupational and Environmental Medicine, 57(10), 649-655.
- Kida, N., Oda, S. and Matsumura, M. (2005): Intensive baseball practice improves the Go/Nogo reaction time, but not the simple reaction time, Cognitive Brain Research, 22(2), 257-264.
- Dye, M.W.G., Green, C.S. and Bavelier, D. (2009): Increasing speed of processing with action video games, Current Directions in Psychological Science, 18(6), 321-326.
- Sala, G., Tatlidil, K.S. and Gobet, F. (2018): Video game training does not enhance cognitive ability: a comprehensive meta-analytic investigation, Psychological Bulletin, 144(2), 111-139.
Keep reading
All articles →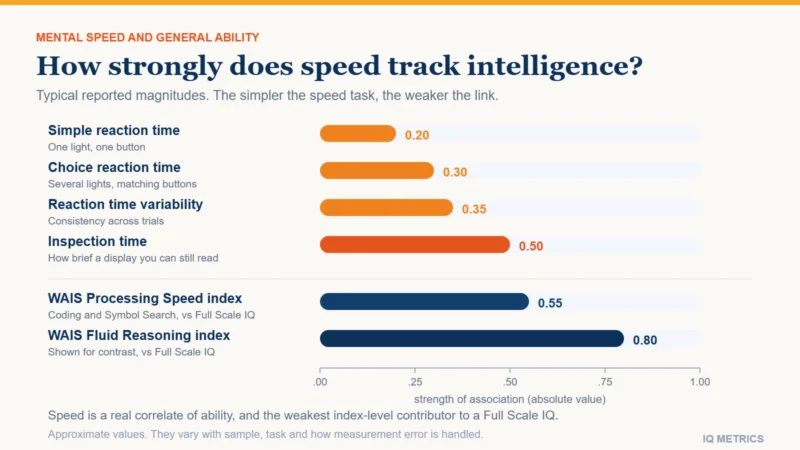 Understanding IQ
Processing Speed and IQ
Fast thinkers are assumed to be smart thinkers, and there is a real finding underneath the stereotype: people who score higher on IQ tests do respond faster on tasks with no reasoning content at all. But the link is weaker than the folklore, and on a professional battery the speed index is the least g-loaded.
 Research & Evidence
Sleep and IQ
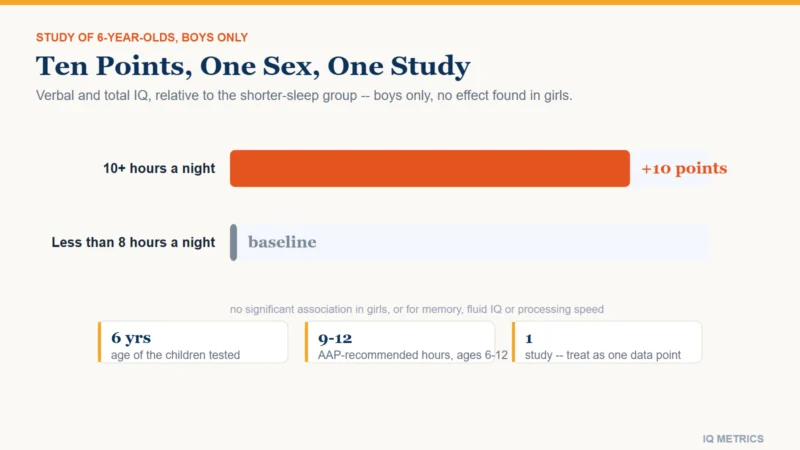
This site's news desk has already covered what one bad night does to a test score on the day it is taken. This is a different and, for children especially, more consequential question: what years of too little sleep do to the cognitive systems an IQ test measures in the first place.
 Scores & Scales
Digit Span Test
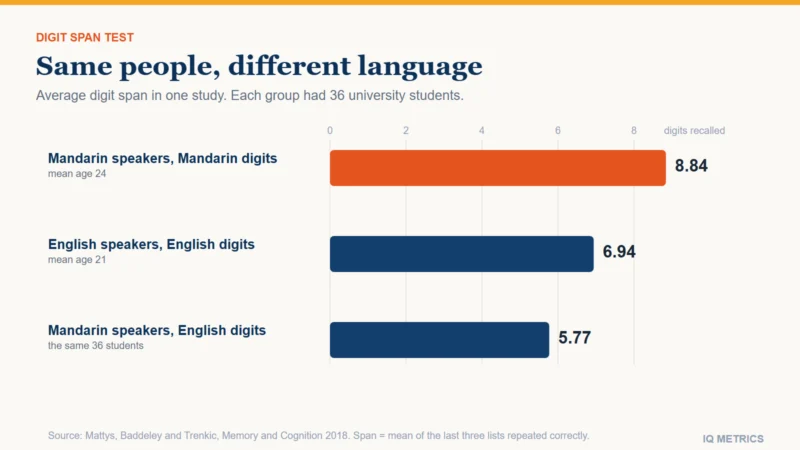
A digit span test asks you to repeat lists of digits; on the WAIS it has three tasks of eight items. Verified adult averages run from 5.3 to 6.9 digits, not seven, and language matters: 8.84 in Mandarin versus 5.77 in English for the same people.