
Does heat affect your brain? 36 studies and 41 exam windows, measured
We read every study we could find that tested thinking or exam scores against temperature, and measured how hot 12 national exams in 40 cities have become since 1981.

By Leon Falkner, Data & Research Analyst · Reviewed by Aarav Vardhan, Editor-in-Chief · Published 4 November 2026 · 13 min read
About this study
- Report type
- Data study: a study ledger and our own climate calculation
- Data
- 36 studies (27 with a readable finding); 41 exam windows in 40 cities, 11 countries
- Weather
- NASA POWER daily maximum temperature, 1981-2025; 5 cities checked against NOAA stations
- Years
- Studies 2002 to 2026; exam dates and sources checked as of 4 November 2026
- Licence
- CC BY 4.0 (our dataset and charts)
- Version
- 2026.11
- Sources
- 53
Yes: in 18 of the 27 studies whose results we could read, people scored or thought worse when it was hotter. Exam days are warming too: 33 of 41 exam windows in 40 cities got hotter between 1981-2000 and 2006-2025, by +0.68 °C on average. IQ Metrics Research, 4 November 2026.
01 Key findings
- Heat lowers scores in most studies we could read. 18 of 27 found worse thinking or test scores when hotter, 7 found it for some tasks or groups only, and 2 found no effect.IQ Metrics ledger, 36 studies
- Real exams show it, in small units. On the gaokao, +1 °C went with 0.029 SD lower scores (our conversion of the authors’ figure); in Tulsa a day in the 90s °F cost 0.06 SD of math.Graff Zivin et al.; Carlson and Shepardson
- Exam days are warming. 33 of 41 exam windows in 40 cities got hotter between 1981-2000 and 2006-2025, by +0.68 °C on average.IQ Metrics, NASA POWER
- More exam days pass 30 °C. Their share rose from 17.6% to 22.0% of all exam days; on the gaokao from 54.0% to 62.1%.IQ Metrics calculation
- Air conditioning changes the picture. The 4 studies that tested it found the harm smaller or gone with cooling.Park 2020; Cedeño Laurent 2018; Wargocki 2007; Porras-Salazar 2018
- Linked, not proven for each city. We show exposure and study effects side by side; we do not say any city’s students lost points.IQ Metrics
02 Statistics to quote
studies with a readable finding report worse thinking or test scores when hotter (7 mixed, 2 no effect).
IQ Metrics ledgerexam windows in 40 cities had hotter exam days in 2006-2025 than in 1981-2000.
IQ Metrics, NASA POWERmean change in the exam-day maximum across 41 exam windows (median +0.63 °C).
IQ Metrics calculationshare of all exam days with a maximum of 30 °C or more, 1981-2000 to 2006-2025.
IQ Metrics calculationexam days at 30 °C or more per year, summed over all 41 exam windows.
IQ Metrics calculationgaokao exam days at 30 °C or more in 12 Chinese cities, 1981-2000 to 2006-2025.
IQ Metrics calculationmean exam-day maximum in Kano during the WASSCE in 2025, the hottest exam window in our data.
IQ Metrics, NASA POWERlower gaokao score per +1 °C, from Graff Zivin and co-authors: 9.62% of an SD per 3.29 °C.
Graff Zivin et al.; IQ Metrics calculationlower math score on a test day in the 90s °F than in the 70s °F, in Tulsa, Oklahoma (Carlson and Shepardson 2026).
Carlson and Shepardson 2026of a year’s learning lost per 1 °F hotter school year without air conditioning (US PSAT data).
Park et al. 2020slower Stroop reaction times in students without air conditioning during a Boston heat wave (n = 44).
Cedeño Laurent et al. 2018studies give an effect we can convert to standard deviations per +1 °C; most report other units.
IQ Metrics ledger03 Does heat affect your brain?
Yes, in most studies: 18 of the 27 studies whose findings we could read report worse thinking or lower test scores when it was hotter, from 2002 to 2026. The effects are small for one person on one day, a few hundredths of a standard deviation per degree in national exams, and they grow with the heat, with time spent in it and with the lack of cooling. We built a ledger of 36 studies that measured thinking or test scores against temperature, read each finding in an open abstract or the authors’ working paper, and added our own climate calculation: how hot exam days have become in 40 cities that hold 12 national exams.
Heat and cognitive performance are linked in three kinds of evidence. Lab studies heat a room and test people in it: in a chamber at 39 °C and 70% humidity, accuracy fell against 26 °C [37]. School and exam studies match weather records to millions of scores: hotter school days in the years before the PSAT lowered US scores [21], and hot exam days lowered results on New York’s Regents exams [18] and on China’s gaokao [5]. Everyday studies follow people through a heat wave: students in Boston dormitories without air conditioning were slower on attention and arithmetic tests than students with it [28].
- Heat and cognitive performance
- How well people think (attention, memory, reasoning, speed) at different temperatures. Studies measure it with tests, exam scores or work tasks [43].
- Daily maximum temperature (Tmax)
- The highest air temperature of a day at 2 metres above the ground. We use it because exams are sat in the day; our data are the NASA POWER daily maxima [1].
- Hot exam day
- In this study, an exam day with a daily maximum of 30 °C or more (we also count 32 °C). It is a weather threshold, not a classroom temperature.
- 26 °C threshold
- The temperature above which Graff Zivin, Hsiang and Neidell found children’s math scores falling on the day of a test [29]. Our CSV counts exam days above it.
- Standard deviation (SD)
- The usual spread of scores. 0.03 SD is about 1 percentile point for a student near the middle; it lets studies of different tests be compared.
- Wet bulb globe temperature (WBGT)
- A heat index that adds humidity, sun and wind to air temperature. The Pilcher meta-analysis found the largest losses at 32.2 °C WBGT or more [44].
- Meta-analysis
- A study that pools the results of many studies. Hancock’s pooled 528 effect sizes from 49 publications [43].
- Exam window
- The days on which a national exam is sat. We take each board’s current official dates and apply them to every year from 1981 to 2025.
04 What do studies say about heat and cognitive performance?
Heat and cognitive performance studies mostly agree on direction: 18 of 27 with a readable finding report harm, 7 report it for some tasks or groups only and 2 find no effect. We screened 398 records from eight OpenAlex searches and the named leads, kept 38 after reading titles and abstracts, and counted 36 that measured thinking or test scores against temperature [4]. For 9 of them the finding is not in an open abstract, so we list them as records and do not code a result: among them the PISA study by Park, Behrer and Goodman [46], Cho’s Korean cohort [45] and a classroom meta-analysis by Wargocki and co-authors [47].
From 398 records to 2 comparable numbers: how we screened the studies
Stage 1: unique records from 8 OpenAlex searches plus the named leads. Stage 2: kept after reading titles and abstracts. Stage 3: measured thinking or test scores against temperature. Stage 4: the finding is printed in an open abstract or the authors' working paper. Stage 5: the effect converts to standard deviations per +1 °C. As of 4 November 2026.
Source: OpenAlex [4]; our ledger; counts by IQ Metrics
Data table
| stage | count | pct_of_first | pct_of_previous |
|---|---|---|---|
| Records found (8 OpenAlex searches + named leads) | 398 | 100 | 100 |
| Kept after title and abstract screening | 38 | 9.6 | 9.6 |
| Measured thinking or test scores against temperature | 36 | 9.1 | 94.7 |
| Finding readable in an open abstract or working paper | 27 | 6.8 | 75 |
| Effect convertible to SD per +1 C | 2 | 0.5 | 7.4 |
Embed this chart
Paste this HTML into your page: it carries the numbers and the credit link to this figure.
Only 2 studies give an effect we can convert to the same unit, standard deviations per +1 °C, so a forest plot with a pooled estimate would mislead: the rest report percent of a year’s learning, percentiles, points on a local test, percent slower reaction times or simply “significantly worse”. Below, each study is one dot in its setting and its finding. The two meta-analyses agree that heat hurts performance, but Hancock and co-authors found cognitive tasks the least affected kind of task, behind perceptual and psychomotor tasks [43] [44].
What each study found, by setting: 18 of 27 worse when hotter
One dot per study whose finding we could read (27 of 36 in the ledger); hover for the place and the temperature contrast. A forest plot is not possible: only 2 studies give an effect we can put on one scale, in standard deviations per +1 °C. As of 4 November 2026.
Source: Our ledger of 36 studies [18] [19] [20] [21] [28] [43] [44] [35] [34]; coding by IQ Metrics
Data table
| id | setting | finding | name |
|---|---|---|---|
| park2022 | Exams and school tests | Worse when hotter | Park (2020) |
| graffzivin2020 | Exams and school tests | Worse when hotter | Graff Zivin et al. (2020) |
| carlson2026 | Exams and school tests | Worse when hotter | Carlson and Shepardson (2026) |
| park2020 | Exams and school tests | Worse when hotter | Park et al. (2020) |
| garg2020 | Exams and school tests | Worse when hotter | Garg et al. (2020) |
| vidogbena2026 | Exams and school tests | Worse when hotter | Vidogbena et al. (2026) |
| haverinen2015 | Classrooms | Worse when hotter | Haverinen‐Shaughnessy and Shaughnessy (2015) |
| wargocki2007 | Classrooms | Worse when hotter | Wargocki and Wyon (2007) |
| porras2018 | Classrooms | Worse when hotter | Porras-Salazar et al. (2018) |
| kirkil2025 | Classrooms | Worse when hotter | Kirkil (2025) |
| cedeno2018 | Everyday life and surveys | Worse when hotter | Cedeño Laurent et al. (2018) |
| graffzivin2018 | Everyday life and surveys | Worse on some tasks or groups | Graff Zivin et al. (2017) |
| hou2023 | Everyday life and surveys | Worse when hotter | Hou and Xu (2023) |
| choi2023 | Everyday life and surveys | Worse on some tasks or groups | Choi et al. (2023) |
| masuda2020 | Everyday life and surveys | Worse when hotter | Masuda et al. (2020) |
| chang2019 | Lab experiments | Worse on some tasks or groups | Chang and Kajackaite (2019) |
| stroom2021 | Lab experiments | No effect found | Stroom et al. (2021) |
| kramer2026 | Lab experiments | No effect found | Kramer and Schiavon (2026) |
| lan2020 | Lab experiments | Worse when hotter | Lan et al. (2020) |
| tian2020 | Lab experiments | Worse when hotter | Tian et al. (2020) |
| zhang2016 | Lab experiments | Worse on some tasks or groups | Zhang and de Dear (2016) |
| liu2021 | Lab experiments | Worse on some tasks or groups | Liu et al. (2021) |
| piil2020 | Lab experiments | Worse when hotter | Piil et al. (2020) |
| gaoua2010 | Lab experiments | Worse on some tasks or groups | Gaoua et al. (2010) |
| wijayanto2017 | Lab experiments | Worse on some tasks or groups | Wijayanto et al. (2017) |
| hancock2007 | Meta-analyses | Worse when hotter | Hancock et al. (2007) |
| pilcher2002 | Meta-analyses | Worse when hotter | Pilcher et al. (2002) |
Embed this chart
Paste this HTML into your page: it carries the numbers and the credit link to this figure.
Where the studies come from, who took part, and what they found
27 studies with a readable finding. Left: setting. Middle: who was tested. Right: the finding. Every exam and school-test study we could read found lower scores when it was hotter; the two studies that found no effect are lab experiments with adults at 28 °C or below. As of 4 November 2026.
Source: Our ledger [18] [19] [22] [24] [35] [34]; coding by IQ Metrics
Data table
| from | to | studies |
|---|---|---|
| Exams and school tests | Teenagers | 3 |
| Teenagers | Worse when hotter | 3 |
| Exams and school tests | Children | 3 |
| Children | Worse when hotter | 6 |
| Classrooms | Children | 3 |
| Classrooms | Young adults | 1 |
| Young adults | Worse when hotter | 2 |
| Everyday life and surveys | Young adults | 1 |
| Everyday life and surveys | Children | 1 |
| Children | Worse on some tasks or groups | 1 |
| Everyday life and surveys | Older adults | 2 |
| Older adults | Worse when hotter | 1 |
| Older adults | Worse on some tasks or groups | 1 |
| Everyday life and surveys | Adults | 1 |
| Adults | Worse when hotter | 4 |
| Lab experiments | Adults | 8 |
| Adults | Worse on some tasks or groups | 3 |
| Adults | No effect found | 2 |
| Lab experiments | Young adults | 2 |
| Young adults | Worse on some tasks or groups | 2 |
| Meta-analyses | Pooled studies | 2 |
| Pooled studies | Worse when hotter | 2 |
Embed this chart
Paste this HTML into your page: it carries the numbers and the credit link to this figure.
Not every study finds harm. In a chamber in the San Francisco Bay Area, 75 adults worked at 21, 23, 25 and 27 °C and showed no significant change in cognitive ability [35], and 257 lab participants at 28 °C made decisions as well as at 22 °C [34]. Chang and Kajackaite found women scoring better on math and verbal tasks at higher temperatures and men worse [33]. The mixed results cluster in the range of a warm office; the clear losses appear at higher heat, with longer exposure, and in people who could not cool down. Related research on other everyday factors is on our pages on air pollution and IQ, sleep and IQ and how much test anxiety costs.
05 Does hot weather lower test scores?
Hot weather lowers test scores by a few hundredths of a standard deviation per degree in the exam studies we could read: 0.029 SD per +1 °C on China’s gaokao and about 0.0054 SD per +1 °C in Tulsa (our conversions). Graff Zivin, Song, Tang and Zhang report that a one-standard-deviation rise in temperature (3.29 °C) lowered the total gaokao score by 1.12%, or 9.62% of a standard deviation [5] [19]. Carlson and Shepardson found that a test day in the 90s °F lowered math scores by roughly 0.06 standard deviations against a day in the 70s, with smaller declines in reading [20].
Temperature and exam performance meet most sharply in high-stakes tests. Park’s study of New York City’s Regents exams found that hot temperature reduced performance by up to 13 percent of a standard deviation, and that teachers then nudged up grades after hotter exams [18]. Heat also works over a school year: without air conditioning, a 1 °F hotter school year reduced that year’s learning by 1 percent in US PSAT data, and hot days explained roughly 5 percent of the racial achievement gap [21]. Garg, Jagnani and Taraz found high temperatures lowering math and reading scores in India [22], and a 2026 study of West and Central Africa found sizable effects for pupils in Grade 2 [23].
How big is 0.03 SD? For a student in the middle of the distribution it is about one percentile point. That is small for one person and one exam, but the exam studies cover millions of scores, and on a selection test a small shift moves some students across a cut-off. Park reports effects on high school graduation in New York [18]. A related point on speed: hot rooms slowed reaction times by 13.4% in the Boston heat-wave study [28], the same kind of speed that processing speed measures and that a reaction time test records.
Air conditioning is the clearest moderator in the evidence. Park and co-authors found that school air conditioning largely offset heat’s effect on learning [21]; in Boston, students in rooms without air conditioning slowed relative to students with it during a heat wave [28]; cooling a Costa Rican classroom from about 30 °C to 25 °C made 11-year-olds faster on language and logical-thinking tasks [26]; and two crossover trials in classrooms found children faster at 20 °C than at 25 °C [25]. The 4 studies that tested cooling all point the same way.
06 What is the best room temperature for studying?
Studies of classrooms and labs find the best results at about 20 to 24 °C in most of the settings they tested. In US classrooms, math scores rose by 12 to 13 points for each 1 °C cooler within 20 to 25 °C [24]; undergraduates did best at 24 °C and 40% humidity [39]; a university classroom study recommends 20 to 22 °C [27]; and in a lab, several tasks were worse at 27 °C than at 23 °C [36]. The upper range matters more than the exact optimum: the Pilcher meta-analysis found the largest decline, 14.88%, at 32.2 °C WBGT or more [44].
Two cautions. First, the studies disagree near the middle: one chamber study found no change from 21 to 27 °C [35] and Chang and Kajackaite found women doing better when warmer [33]. Second, these are averages of groups, not a rule for one person; clothing, humidity and acclimatisation shift them. People from tropical Asia kept their scores in a heat test where Japanese participants lost them on mental arithmetic [42], and lower humidity at 39 °C restored some accuracy [37]. We give no advice for individuals; for the science of memory and reasoning see working memory and reasoning.
07 Are exam days getting hotter?
Yes: 33 of 41 exam windows in 40 cities had hotter exam days in 2006-2025 than in 1981-2000, by +0.68 °C on average (median +0.63 °C), and the share of exam days at 30 °C or more rose from 17.6% to 22.0%. We took the current official dates of 12 national exams from each exam board, applied the same calendar days to every year from 1981 to 2025, and read the daily maximum for each city from NASA POWER [1]. Using today’s dates on purpose means the change is climate alone: the gaokao, for example, moved from July to June in 2003, and that move is not in our numbers.
How many exam days reach 30 °C? The average exam window, five years at a time since 1981
Share of exam days with a maximum of 30 °C or more, averaged over 41 exam windows in 40 cities and over each five-year period (today's exam dates applied to every year). Mean 25.0% in 1981-2000 and 30.6% in 2006-2025. IQ Metrics calculation from NASA POWER daily maxima. As of 4 November 2026.
Source: NASA POWER T2M_MAX [1]; exam dates from each board [6] [7] [9] [13]; calculation by IQ Metrics
Data table
| label | value |
|---|---|
| 1981-1985 | 22.8 |
| 1986-1990 | 26.1 |
| 1991-1995 | 24.7 |
| 1996-2000 | 26.3 |
| 2001-2005 | 29.2 |
| 2006-2010 | 26.6 |
| 2011-2015 | 30.4 |
| 2016-2020 | 30 |
| 2021-2025 | 35.5 |
Embed this chart
Paste this HTML into your page: it carries the numbers and the credit link to this figure.
Counted in days, the 41 exam windows had 65.7 exam days at 30 °C or more per year in 1981-2000 and 82.3 in 2006-2025, 25% more. At 32 °C the share of exam days rose from 12.1% to 14.8%. 27 windows gained hot exam days, 4 lost some, 8 had none in either period (mostly winter exams and exams in cool cities) and 2 had the same number. The year-to-year swing is large, because a two-day exam can fall in a heat wave one year and a cool spell the next.
33 of 41 exam windows got hotter: mean exam-day maximum, 1981-2000 against 2006-2025
Each row is one exam in one city: the mean daily maximum on its exam days in 1981-2000 and in 2006-2025, sorted by the change. Mean change +0.68 °C, median +0.63 °C. Largest rise: Lyon (bac) (+2.3 °C). IQ Metrics calculation. As of 4 November 2026.
Mean daily maximum on exam days (°C)
Source: NASA POWER [1]; exam dates [6] [7] [8] [9] [10] [11] [12] [13] [14] [15] [16] [17]; calculation by IQ Metrics
Data table
| exam window | 1981-2000 | 2006-2025 |
|---|---|---|
| Lyon (bac) | 21.4 | 23.8 |
| Madrid (PAU) | 24.4 | 26.6 |
| Kano (WASSCE) | 36.4 | 38.3 |
| Paris (bac) | 20.9 | 22.6 |
| Marseille (bac) | 26.4 | 28 |
| Zhengzhou (gaokao) | 33.1 | 34.6 |
| Abuja (WASSCE) | 29 | 30.4 |
| London (GCSE/A level) | 17.5 | 18.8 |
| Sydney (HSC) | 20.8 | 22 |
| Houston (AP) | 28.8 | 29.9 |
| Wuhan (gaokao) | 29.1 | 30.3 |
| Birmingham (GCSE/A level) | 16.8 | 17.8 |
| Manchester (GCSE/A level) | 15.5 | 16.5 |
| Hangzhou (gaokao) | 28.7 | 29.7 |
| Nanjing (gaokao) | 29.6 | 30.5 |
| Miami (AP) | 26.7 | 27.6 |
| Phoenix (AP) | 32.8 | 33.7 |
| Boston (AP) | 16.9 | 17.6 |
| Guangzhou (gaokao) | 30.2 | 30.9 |
| Brasilia (ENEM) | 28.2 | 28.8 |
| Sao Paulo (ENEM) | 27.2 | 27.8 |
| Tianjin (gaokao) | 32.6 | 33.2 |
| New York (Regents) | 22.5 | 23 |
| Changsha (gaokao) | 29.4 | 29.9 |
| Seoul (CSAT) | 8.9 | 9.4 |
| Washington, D.C. (AP) | 20.6 | 21.1 |
| Chicago (AP) | 13.5 | 13.9 |
| New York (AP) | 15.4 | 15.8 |
| Lagos (WASSCE) | 28.3 | 28.5 |
| Shanghai (gaokao) | 27.6 | 27.8 |
| Thessaloniki (Panhellenic) | 27.2 | 27.4 |
| Atlanta (AP) | 25.4 | 25.6 |
| Athens (Panhellenic) | 27.8 | 28 |
| Rio de Janeiro (ENEM) | 26.4 | 26.4 |
| Dallas (AP) | 27.7 | 27.6 |
| Tokyo (Common Test) | 9.1 | 8.9 |
| Beijing (gaokao) | 32.5 | 32.3 |
| Xi'an (gaokao) | 31.6 | 31.4 |
| Los Angeles (AP) | 23.7 | 23.5 |
| Chengdu (gaokao) | 32.6 | 32.3 |
| Chongqing (gaokao) | 30.4 | 29.6 |
Embed this chart
Paste this HTML into your page: it carries the numbers and the credit link to this figure.
How much did exam days warm? Most windows rose by 0 to 1 °C
Change in the mean exam-day maximum between 1981-2000 and 2006-2025 for 41 exam windows, in half-degree bins. 33 warmed, 8 cooled; median +0.63 °C. For one city the change is uncertain (see the station check). IQ Metrics calculation. As of 4 November 2026.
Change in mean exam-day maximum (°C)
Source: NASA POWER [1]; exam dates from each board; calculation by IQ Metrics
Data table
| from | to | exam windows |
|---|---|---|
| -1 | -0.5 | 1 |
| -0.5 | 0 | 7 |
| 0 | 0.5 | 7 |
| 0.5 | 1 | 14 |
| 1 | 1.5 | 6 |
| 1.5 | 2 | 4 |
| 2 | 2.5 | 2 |
| 2.5 | 3 | 0 |
Embed this chart
Paste this HTML into your page: it carries the numbers and the credit link to this figure.
The largest rise is Lyon (bac), +2.3 °C, and the largest fall Chongqing (gaokao), -0.8 °C. Exams held in the same week across many cities show how much depends on local weather: the 12 gaokao cities range from cooling to warming on the same two June days. For that reason we read the city rows as exposure, not as a forecast, and we never write that students in any city lost points. Linked, not proven for each city.
Did every city of the same exam warm? The spread inside each exam
Change in mean exam-day maximum, 1981-2000 to 2006-2025, one dot per city, for the 6 exams held in 3 or more of our cities. Box = middle half, whiskers = lowest and highest city. Same exam dates, different weather: short windows (the 2-day gaokao) swing more from year to year. IQ Metrics calculation. As of 4 November 2026.
Change in mean exam-day maximum (°C). Dotted line: No change.
Source: NASA POWER [1]; exam dates [6] [7] [9] [10] [13] [16]; quartiles by IQ Metrics
Data table
| exam | n | low | q1 | median | q3 | high |
|---|---|---|---|---|---|---|
| bac (France) | 3 | 1.6 | 1.6 | 1.7 | 2 | 2.3 |
| WASSCE (Nigeria) | 3 | 0.2 | 0.8 | 1.4 | 1.6 | 1.9 |
| GCSE/A level (United Kingdom) | 3 | 1 | 1 | 1 | 1.1 | 1.3 |
| ENEM (Brazil) | 3 | -0 | 0.3 | 0.6 | 0.6 | 0.6 |
| gaokao (China) | 12 | -0.8 | -0.2 | 0.6 | 0.9 | 1.5 |
| AP (United States) | 10 | -0.3 | 0.2 | 0.5 | 0.8 | 1.1 |
Embed this chart
Paste this HTML into your page: it carries the numbers and the credit link to this figure.
08 Which national exams are sat in the most heat?
The hottest exam window in 2025 was the WASSCE in Kano, with a mean exam-day maximum of 40.1 °C over 28 exam days, followed by the gaokao in Zhengzhou (37.0 °C) and Chengdu (36.1 °C). Across its 12 cities, 62.1% of gaokao exam days reached 30 °C in 2006-2025, up from 54.0% in 1981-2000; China’s Ministry of Education holds the exam on 7 and 8 June nationwide, with some provinces adding 9 and 10 June [6]. Nigeria’s WASSCE runs from 12 May to 19 June in our count [13], so Kano and Abuja have the most hot exam days per year in our data: Kano 27.9 of its 28 exam days a year in 2006-2025, Abuja up from 6.0 to 14.2.
Exam-day heat in every city, five years at a time
Mean daily maximum (°C) on each exam's days, averaged over each five-year period 1981-2025; darker = hotter. Rows sorted by 2006-2025. Northern exams in May and June and southern ones in October and November are the warm ones; winter exams (Seoul, Tokyo) stay cold. IQ Metrics calculation. As of 4 November 2026.
Source: NASA POWER [1]; exam dates from each board; calculation by IQ Metrics
Data table
| exam window | 1981-85 | 1986-90 | 1991-95 | 1996-00 | 2001-05 | 2006-10 | 2011-15 | 2016-20 | 2021-25 |
|---|---|---|---|---|---|---|---|---|---|
| Kano (WASSCE) | 36.2 | 36.9 | 35.7 | 36.8 | 37.3 | 38.3 | 38 | 38.5 | 38.6 |
| Zhengzhou (gaokao) | 34.5 | 32 | 33.4 | 32.3 | 34.4 | 33 | 35.9 | 33.1 | 36.4 |
| Phoenix (AP) | 32.4 | 33.3 | 31.3 | 34.3 | 33.6 | 33.9 | 33.1 | 34.1 | 33.5 |
| Tianjin (gaokao) | 36.3 | 29 | 32.1 | 33 | 32.9 | 33.4 | 32.8 | 33.7 | 32.9 |
| Chengdu (gaokao) | 30.4 | 33.4 | 34.9 | 31.8 | 31.6 | 30.2 | 32.8 | 32.8 | 33.4 |
| Beijing (gaokao) | 35.4 | 30.4 | 31.3 | 32.9 | 32.1 | 31.6 | 31.8 | 33.9 | 31.8 |
| Xi'an (gaokao) | 32.5 | 29.7 | 34.6 | 29.6 | 32.9 | 30.4 | 33.2 | 28.6 | 33.2 |
| Guangzhou (gaokao) | 30.3 | 30.1 | 29.3 | 30.9 | 30.2 | 29.7 | 32.4 | 30.2 | 31.2 |
| Nanjing (gaokao) | 30.7 | 30.1 | 29 | 28.7 | 30.9 | 30.6 | 30.6 | 30.8 | 30.2 |
| Abuja (WASSCE) | 28.5 | 29.2 | 28.8 | 29.5 | 29.8 | 30.1 | 30.2 | 30.2 | 30.9 |
| Wuhan (gaokao) | 29.2 | 29.8 | 29.6 | 27.9 | 30.1 | 29.3 | 30.4 | 30.4 | 30.9 |
| Houston (AP) | 28.6 | 28.5 | 27.6 | 30.4 | 29.3 | 29.9 | 28.9 | 30.3 | 30.6 |
| Changsha (gaokao) | 29.5 | 28.8 | 29.6 | 29.7 | 29.8 | 29.3 | 29.7 | 29.4 | 31.3 |
| Hangzhou (gaokao) | 28.6 | 28.7 | 28.2 | 29.4 | 30.4 | 29.8 | 29.6 | 29.7 | 29.8 |
| Chongqing (gaokao) | 28.7 | 31.7 | 31.9 | 29.4 | 29.9 | 27.9 | 30.5 | 30.1 | 29.9 |
| Brasilia (ENEM) | 27.1 | 28.3 | 28.9 | 28.5 | 29.3 | 29 | 27 | 28.7 | 30.7 |
| Lagos (WASSCE) | 28.1 | 28.4 | 28.2 | 28.5 | 28.2 | 28.3 | 28.1 | 28.7 | 29 |
| Marseille (bac) | 26.8 | 25.8 | 25.8 | 27.3 | 29.3 | 27.1 | 26.9 | 27.1 | 31 |
| Athens (Panhellenic) | 27.3 | 27.8 | 28.4 | 27.9 | 26.8 | 27.9 | 26.8 | 27.7 | 29.5 |
| Sao Paulo (ENEM) | 28.3 | 26.1 | 28.4 | 25.9 | 27.3 | 26.4 | 26.6 | 28.6 | 29.5 |
| Shanghai (gaokao) | 26.6 | 28.5 | 27.1 | 28.1 | 27.6 | 27.5 | 27.6 | 27.8 | 28.3 |
| Dallas (AP) | 27.8 | 27.3 | 26.3 | 29.4 | 27.8 | 27.1 | 27.3 | 27.6 | 28.5 |
| Miami (AP) | 26.4 | 26.4 | 27 | 27 | 26.7 | 27.8 | 27.2 | 27.3 | 28.1 |
| Thessaloniki (Panhellenic) | 27.5 | 26.8 | 27.4 | 27.2 | 25.8 | 25.9 | 26.7 | 27.5 | 29.6 |
| Madrid (PAU) | 22 | 27 | 24.7 | 24 | 29.3 | 26.5 | 27.1 | 26.7 | 25.9 |
| Rio de Janeiro (ENEM) | 26.6 | 26.3 | 27.3 | 25.5 | 25.8 | 26.6 | 25.8 | 26.4 | 26.9 |
| Atlanta (AP) | 25.4 | 24.8 | 24.9 | 26.3 | 26.5 | 26.2 | 25.7 | 24.9 | 25.5 |
| Lyon (bac) | 20.8 | 21.8 | 21 | 22.2 | 25.9 | 22.8 | 23.4 | 22.5 | 26.4 |
| Los Angeles (AP) | 23.8 | 25.1 | 22.1 | 23.9 | 24.1 | 24.7 | 23.6 | 22.5 | 23 |
| New York (Regents) | 22.5 | 21.8 | 22.7 | 22.9 | 23.5 | 22.8 | 23.2 | 22.6 | 23.4 |
| Paris (bac) | 19.7 | 21.1 | 20.6 | 22.2 | 23.1 | 22.1 | 21.3 | 21.4 | 25.6 |
| Sydney (HSC) | 20.7 | 21.6 | 20.6 | 20.3 | 22 | 22 | 22.2 | 21.9 | 22 |
| Washington, D.C. (AP) | 21.8 | 19.7 | 20.3 | 20.7 | 21.8 | 21 | 22.2 | 19.7 | 21.7 |
| London (GCSE/A level) | 17.1 | 17.4 | 17.6 | 18 | 18.4 | 18.6 | 17.5 | 19.5 | 19.6 |
| Birmingham (GCSE/A level) | 16.6 | 16.5 | 16.8 | 17.2 | 17.5 | 17.6 | 16.6 | 18.4 | 18.6 |
| Boston (AP) | 17.2 | 16.1 | 16.9 | 17.4 | 17.5 | 17.7 | 18.6 | 15.7 | 18.5 |
| Manchester (GCSE/A level) | 15.5 | 15.3 | 15.2 | 16 | 16 | 16.3 | 15.2 | 17.1 | 17.3 |
| New York (AP) | 16 | 14.6 | 15.7 | 15.4 | 16 | 16.1 | 16.3 | 14.3 | 16.4 |
| Chicago (AP) | 13.4 | 13.1 | 13.4 | 14.2 | 14 | 13.4 | 14.5 | 12.8 | 15 |
| Seoul (CSAT) | 8.4 | 8.4 | 11.7 | 7.1 | 9.5 | 5.9 | 9.4 | 10.6 | 11.8 |
| Tokyo (Common Test) | 7 | 9.8 | 9.5 | 9.9 | 8.1 | 8.5 | 7.5 | 10.1 | 9.5 |
Embed this chart
Paste this HTML into your page: it carries the numbers and the credit link to this figure.
Share of exam days at 30 °C or more, by exam: 1981-2000 against 2006-2025
Each line is one exam, averaged over its cities (12 exams, 40 cities). The gaokao goes from 54.0% to 62.1% of exam days; five exams stay at or near 0%. IQ Metrics calculation from NASA POWER. As of 4 November 2026.
Source: NASA POWER [1]; exam dates [6] [13] [10] [11] [16]; calculation by IQ Metrics
Data table
| exam | 1981-2000 | 2006-2025 |
|---|---|---|
| gaokao | 54 | 62.1 |
| WASSCE | 41.1 | 51.4 |
| ENEM | 14.2 | 25 |
| Panhellenic | 21.2 | 21.2 |
| PAU | 10 | 20 |
| AP | 14.2 | 17.1 |
| bac | 5 | 15 |
| HSC | 0.6 | 1.9 |
| Regents | 0 | 1.4 |
| GCSE/A level | 0 | 0 |
| CSAT | 0 | 0 |
| Common Test | 0 | 0 |
Embed this chart
Paste this HTML into your page: it carries the numbers and the credit link to this figure.
European exams start from cooler weather but changed the most. France’s written baccalaureate papers (11 to 18 June) [10] went from 5.0% to 15.0% of exam days at 30 °C in Paris, Lyon and Marseille together, and Madrid’s university entrance exam (1 to 4 June) [11] from 10.0% to 20.0%. England’s GCSE and A level timetable (7 May to 23 June) [9] warmed by +1.09 °C on average and still had no 30 °C exam days in our cities. Winter exams are the control group: Korea’s CSAT on 19 November [14] and Japan’s Common Test in mid-January [15] stay far below any threshold.
The hottest exam windows, then and now: rank among 41
Rank of each exam window by its mean exam-day maximum in 1981-2000 and in 2006-2025 (1 = hottest of 41); the 15 hottest of 2006-2025. Abuja (WASSCE) moved furthest up (from 13 to 10). IQ Metrics calculation. As of 4 November 2026.
Source: NASA POWER [1]; exam dates from each board; ranks by IQ Metrics
Data table
| exam window | 1981-2000 | 2006-2025 |
|---|---|---|
| Kano (WASSCE) | 1 | 1 |
| Zhengzhou (gaokao) | 2 | 2 |
| Phoenix (AP) | 3 | 3 |
| Tianjin (gaokao) | 5 | 4 |
| Chengdu (gaokao) | 4 | 5 |
| Beijing (gaokao) | 6 | 6 |
| Xi'an (gaokao) | 7 | 7 |
| Guangzhou (gaokao) | 9 | 8 |
| Nanjing (gaokao) | 10 | 9 |
| Abuja (WASSCE) | 13 | 10 |
| Wuhan (gaokao) | 12 | 11 |
| Houston (AP) | 14 | 12 |
| Changsha (gaokao) | 11 | 13 |
| Hangzhou (gaokao) | 15 | 14 |
| Chongqing (gaokao) | 8 | 15 |
Embed this chart
Paste this HTML into your page: it carries the numbers and the credit link to this figure.
In the United States, the AP exams (4 to 15 May) [7] are sat in Phoenix, Houston, Dallas and Miami heat and in cooler Boston, Chicago and New York. New York’s June Regents [8] are the exams of Park’s study; in 2025, 2 of their combined 17 AP and Regents exam days in New York reached 30 °C in the grid data. Southern-hemisphere exams fall in spring: Brazil’s ENEM on two November Sundays [16] and the New South Wales HSC from 13 October to 5 November [17]. Greece’s Panhellenic exams (29 May to 8 June) [12] already had about a fifth of exam days at 30 °C in both periods.
Exam season 2025 in New York: daily maximum, with the exam days ringed
Daily maximum temperature, 1 May to 30 June 2025, at the NASA POWER cell over New York City; today's AP (May) and Regents (June) dates ringed. 2 of 17 exam days reached 30 °C; the hottest reached 32.0 °C. The New York Regents are the exams in Park's study of heat and scores. As of 4 November 2026.
- Sun 4 May 2025 AP exams, 15.1 °C
- Mon 5 May 2025 AP exams, 14.4 °C
- Tue 6 May 2025 AP exams, 16.3 °C
- Wed 7 May 2025 AP exams, 17.9 °C
- Thu 8 May 2025 AP exams, 18.3 °C
- Sun 11 May 2025 AP exams, 22.4 °C
- Mon 12 May 2025 AP exams, 17.8 °C
- Tue 13 May 2025 AP exams, 16.1 °C
- Wed 14 May 2025 AP exams, 15.7 °C
- Thu 15 May 2025 AP exams, 17.7 °C
- Mon 9 Jun 2025 Regents, 18.4 °C
- Tue 10 Jun 2025 Regents, 21.1 °C
- Tue 17 Jun 2025 Regents, 19.1 °C
- Wed 18 Jun 2025 Regents, 22.5 °C
- Mon 23 Jun 2025 Regents, 28.6 °C
- Tue 24 Jun 2025 Regents, 32.0 °C
- Wed 25 Jun 2025 Regents, 31.0 °C
Source: NASA POWER [1]; AP dates [7]; Regents dates [8]; Park [18]
Data table
| date | daily maximum, New York (°C) |
|---|---|
| 2025-05-01 | 14 |
| 2025-05-02 | 19.4 |
| 2025-05-03 | 17.9 |
| 2025-05-04 | 15.1 |
| 2025-05-05 | 14.4 |
| 2025-05-06 | 16.3 |
| 2025-05-07 | 17.9 |
| 2025-05-08 | 18.3 |
| 2025-05-09 | 16 |
| 2025-05-10 | 18.3 |
| 2025-05-11 | 22.4 |
| 2025-05-12 | 17.8 |
| 2025-05-13 | 16.1 |
| 2025-05-14 | 15.7 |
| 2025-05-15 | 17.7 |
| 2025-05-16 | 18.7 |
| 2025-05-17 | 21.1 |
| 2025-05-18 | 19.7 |
| 2025-05-19 | 18.4 |
| 2025-05-20 | 17.1 |
| 2025-05-21 | 13.5 |
| 2025-05-22 | 12.8 |
| 2025-05-23 | 15.3 |
| 2025-05-24 | 16 |
| 2025-05-25 | 16.7 |
| 2025-05-26 | 19.3 |
| 2025-05-27 | 17.7 |
| 2025-05-28 | 15.7 |
| 2025-05-29 | 18.3 |
| 2025-05-30 | 18.3 |
| 2025-05-31 | 18.5 |
| 2025-06-01 | 16.6 |
| 2025-06-02 | 18.5 |
| 2025-06-03 | 21.1 |
| 2025-06-04 | 20.6 |
| 2025-06-05 | 22.2 |
| 2025-06-06 | 21.9 |
| 2025-06-07 | 21 |
| 2025-06-08 | 19.8 |
| 2025-06-09 | 18.4 |
| 2025-06-10 | 21.1 |
| 2025-06-11 | 23.2 |
| 2025-06-12 | 25.5 |
| 2025-06-13 | 20.6 |
| 2025-06-14 | 17.5 |
| 2025-06-15 | 17.1 |
| 2025-06-16 | 18.3 |
| 2025-06-17 | 19.1 |
| 2025-06-18 | 22.5 |
| 2025-06-19 | 24.4 |
| 2025-06-20 | 24.3 |
| 2025-06-21 | 25.2 |
| 2025-06-22 | 26.1 |
| 2025-06-23 | 28.6 |
| 2025-06-24 | 32 |
| 2025-06-25 | 31 |
| 2025-06-26 | 25.9 |
| 2025-06-27 | 21.1 |
| 2025-06-28 | 25.8 |
| 2025-06-29 | 27.8 |
| 2025-06-30 | 25.8 |
Embed this chart
Paste this HTML into your page: it carries the numbers and the credit link to this figure.
09 How accurate is the temperature data?
NASA POWER tracks city weather stations closely day to day (correlation 0.94 to 0.99) but runs cooler, by 0.14 to 2.60 °C on average, because each value covers a grid cell about 50 km across. We checked five cities against NOAA’s GHCN-Daily stations [2]: New York Central Park, Beijing, Tokyo, Madrid Retiro and Sydney Observatory Hill. The offset matters little for change over time, since it is there in both periods, but it does mean our hot-day counts are conservative for city centres.
How close is the grid to a thermometer? NASA POWER minus the weather station
Mean difference in daily maximum, 1981-2025, between the NASA POWER grid cell and the GHCN-Daily station in the same city (negative = the grid is cooler). Day-to-day correlation 0.94 to 0.99. A grid cell averages about 50 km of land, sea and suburbs, so it runs cooler than a city-centre station. IQ Metrics calculation.
Source: NASA POWER [1]; NOAA GHCN-Daily [2]; comparison by IQ Metrics
Data table
| label | value |
|---|---|
| New York (Central Park) | -2.6 |
| Sydney (Observatory Hill) | -1.6 |
| Tokyo | -0.5 |
| Madrid (Retiro) | -0.3 |
| Beijing | -0.1 |
Embed this chart
Paste this HTML into your page: it carries the numbers and the credit link to this figure.
For single exam windows the two sources can disagree on the change. Madrid’s PAU warmed by +3.16 °C at the station and +2.14 °C in the grid; Sydney’s HSC by +1.22 and +1.21 °C. But in New York the station shows the AP days -0.45 °C and the Regents days -0.41 °C against +0.39 and +0.54 °C in the grid, opposite signs. Beijing’s station misses many recent gaokao days, so we do not compare it. This is why the page leans on the 41-window totals and not on any one city: a change under 1 °C in one place is within the gap between a grid cell and a thermometer.
10 What does this mean, and what does it not show?
The two halves of this study sit side by side and are not multiplied together. The ledger shows that heat lowers measured thinking in most settings; the climate calculation shows that exam days in most of our cities are warmer than they were. We do not estimate points lost in any city, because exam rooms may be cooled, students differ, and the effect sizes come from other places and tests. Heat is one of many everyday influences on a score, like sleep loss before a test; none of them changes the ability a test is built to measure, as our explainer on fluid and crystallised intelligence sets out.
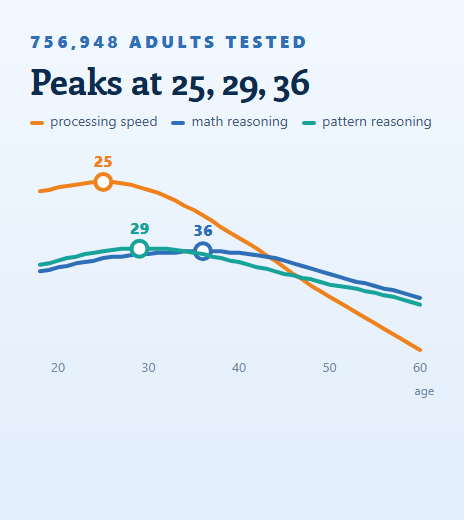
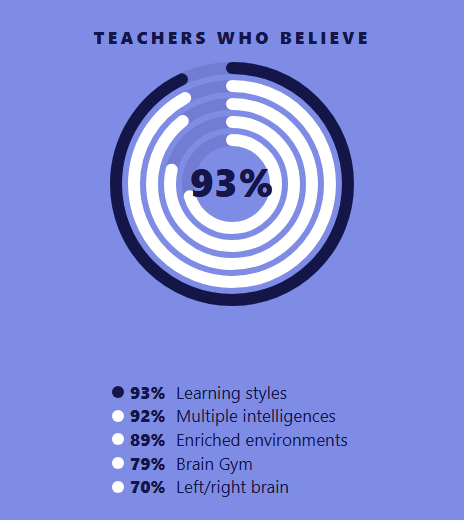
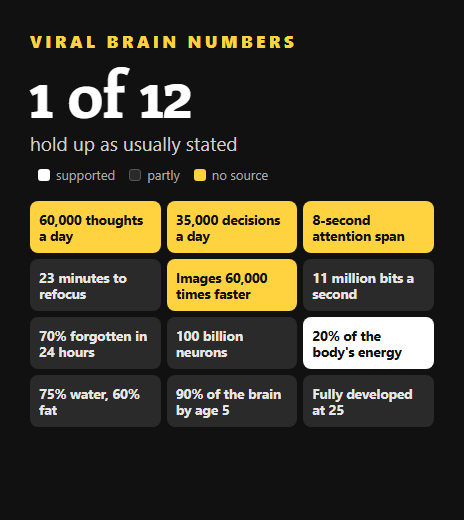
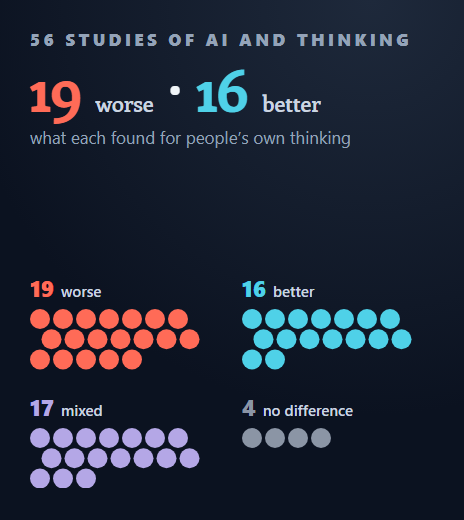
Several widely shared claims about the brain fail a check, as our brain statistics fact check and neuromyths survey show; this one holds up in direction, with small effects. How abilities change across a life is in our study of peak brain age, and what tools do to thinking is in our study of AI and your brain.
Room temperature does not decide your score. Your reasoning does.
Our IQ test measures pattern reasoning and compares your result with adults, with a percentile.
Take the IQ test11 Every exam window and every study in our dataset
Every exam window in our dataset (41 rows, 40 cities)
Dates are month-day of the current official timetable (2026; Japan January 2027). Means are per exam day (°C) or hot days (30 °C or more) per year. The CSV adds 32 °C days, the share above 26 °C, the trend per decade, 2025 values and coordinates. IQ Metrics calculation. As of 4 November 2026.
| Sydney | Australia | HSC | 10-13 to 11-05 | 18 | 20.8 | 22.0 | +1.2 | 0.1 | 0.3 | 23.7 |
| Brasilia | Brazil | ENEM | 11-08 to 11-15 | 2 | 28.2 | 28.8 | +0.6 | 0.5 | 0.7 | 32.9 |
| Rio de Janeiro | Brazil | ENEM | 11-08 to 11-15 | 2 | 26.4 | 26.4 | -0.0 | 0.1 | 0.2 | 28.4 |
| Sao Paulo | Brazil | ENEM | 11-08 to 11-15 | 2 | 27.2 | 27.8 | +0.6 | 0.3 | 0.6 | 27.9 |
| Beijing | China | gaokao | 06-07 to 06-08 | 2 | 32.5 | 32.3 | -0.2 | 1.6 | 1.5 | 34.2 |
| Changsha | China | gaokao | 06-07 to 06-08 | 2 | 29.4 | 29.9 | +0.5 | 0.9 | 1.1 | 31.9 |
| Chengdu | China | gaokao | 06-07 to 06-08 | 2 | 32.6 | 32.3 | -0.3 | 1.5 | 1.7 | 36.1 |
| Chongqing | China | gaokao | 06-07 to 06-08 | 2 | 30.4 | 29.6 | -0.8 | 1.0 | 0.8 | 34.6 |
| Guangzhou | China | gaokao | 06-07 to 06-08 | 2 | 30.2 | 30.9 | +0.7 | 1.1 | 1.2 | 34.4 |
| Hangzhou | China | gaokao | 06-07 to 06-08 | 2 | 28.7 | 29.7 | +1.0 | 0.8 | 0.8 | 30.2 |
| Nanjing | China | gaokao | 06-07 to 06-08 | 2 | 29.6 | 30.5 | +0.9 | 0.8 | 1.3 | 27.0 |
| Shanghai | China | gaokao | 06-07 to 06-08 | 2 | 27.6 | 27.8 | +0.2 | 0.3 | 0.2 | 28.8 |
| Tianjin | China | gaokao | 06-07 to 06-08 | 2 | 32.6 | 33.2 | +0.6 | 1.4 | 1.7 | 33.5 |
| Wuhan | China | gaokao | 06-07 to 06-08 | 2 | 29.1 | 30.3 | +1.1 | 0.7 | 1.3 | 30.2 |
| Xi’an | China | gaokao | 06-07 to 06-08 | 2 | 31.6 | 31.4 | -0.2 | 1.3 | 1.4 | 33.3 |
| Zhengzhou | China | gaokao | 06-07 to 06-08 | 2 | 33.1 | 34.6 | +1.5 | 1.6 | 1.8 | 37.0 |
| Lyon | France | bac | 06-11 to 06-18 | 6 | 21.4 | 23.8 | +2.3 | 0.1 | 0.3 | 25.7 |
| Marseille | France | bac | 06-11 to 06-18 | 6 | 26.4 | 28.0 | +1.6 | 0.8 | 2.1 | 33.5 |
| Paris | France | bac | 06-11 to 06-18 | 6 | 20.9 | 22.6 | +1.7 | 0.0 | 0.2 | 25.7 |
| Athens | Greece | Panhellenic | 05-29 to 06-08 | 4 | 27.8 | 28.0 | +0.1 | 1.0 | 1.0 | 30.7 |
| Thessaloniki | Greece | Panhellenic | 05-29 to 06-08 | 4 | 27.2 | 27.4 | +0.2 | 0.7 | 0.7 | 30.7 |
| Tokyo | Japan | Common Test | 01-16 to 01-17 | 2 | 9.1 | 8.9 | -0.2 | 0.0 | 0.0 | 8.1 |
| Abuja | Nigeria | WASSCE | 05-12 to 06-19 | 28 | 29.0 | 30.4 | +1.4 | 6.0 | 14.2 | 32.2 |
| Kano | Nigeria | WASSCE | 05-12 to 06-19 | 28 | 36.4 | 38.3 | +1.9 | 27.7 | 27.9 | 40.1 |
| Lagos | Nigeria | WASSCE | 05-12 to 06-19 | 28 | 28.3 | 28.5 | +0.2 | 0.9 | 1.1 | 28.9 |
| Seoul | South Korea | CSAT | 11-19 to 11-19 | 1 | 8.9 | 9.4 | +0.5 | 0.0 | 0.0 | 5.8 |
| Madrid | Spain | PAU | 06-01 to 06-04 | 4 | 24.4 | 26.6 | +2.1 | 0.4 | 0.8 | 26.4 |
| Birmingham | United Kingdom | GCSE/A level | 05-07 to 06-23 | 34 | 16.8 | 17.8 | +1.0 | 0.0 | 0.0 | 19.2 |
| London | United Kingdom | GCSE/A level | 05-07 to 06-23 | 34 | 17.5 | 18.8 | +1.3 | 0.0 | 0.0 | 20.4 |
| Manchester | United Kingdom | GCSE/A level | 05-07 to 06-23 | 34 | 15.5 | 16.5 | +1.0 | 0.0 | 0.0 | 17.7 |
| Atlanta | United States | AP | 05-04 to 05-15 | 10 | 25.4 | 25.6 | +0.2 | 0.7 | 0.9 | 25.5 |
| Boston | United States | AP | 05-04 to 05-15 | 10 | 16.9 | 17.6 | +0.7 | 0.0 | 0.0 | 19.5 |
| Chicago | United States | AP | 05-04 to 05-15 | 10 | 13.5 | 13.9 | +0.4 | 0.0 | 0.0 | 14.9 |
| Dallas | United States | AP | 05-04 to 05-15 | 10 | 27.7 | 27.6 | -0.1 | 2.4 | 2.5 | 27.4 |
| Houston | United States | AP | 05-04 to 05-15 | 10 | 28.8 | 29.9 | +1.1 | 3.1 | 4.6 | 30.7 |
| Los Angeles | United States | AP | 05-04 to 05-15 | 10 | 23.7 | 23.5 | -0.3 | 0.8 | 1.0 | 22.3 |
| Miami | United States | AP | 05-04 to 05-15 | 10 | 26.7 | 27.6 | +0.9 | 0.0 | 0.2 | 27.9 |
| New York | United States | AP | 05-04 to 05-15 | 10 | 15.4 | 15.8 | +0.4 | 0.0 | 0.0 | 17.2 |
| Phoenix | United States | AP | 05-04 to 05-15 | 10 | 32.8 | 33.7 | +0.9 | 7.3 | 7.8 | 30.4 |
| Washington, D.C. | United States | AP | 05-04 to 05-15 | 10 | 20.6 | 21.1 | +0.5 | 0.1 | 0.0 | 23.8 |
| New York | United States | Regents | 06-09 to 06-25 | 7 | 22.5 | 23.0 | +0.5 | 0.0 | 0.1 | 24.7 |
Source: NASA POWER [1]; GeoNames [3]; exam boards [6] [7] [8] [9] [10] [11] [12] [13] [14] [15] [16] [17]; calculation by IQ Metrics
Every study in our ledger (36 rows)
Sorted by whether we could read the finding, then setting and year. "Not read" rows are studies we found but whose finding is not in an open abstract; we cite them as records only. The quoted sentence behind each finding is in data/studies.tsv. As of 4 November 2026.
| Wargocki and Wyon (2007) [25] | Classroom experiment | not stated in abstract | not in abstract | 25 C vs 20 C | Worse when hotter | yes: cooling units on vs idle |
| Haverinen‐Shaughnessy and Shaughnessy (2015) [24] | Classroom (measured) | USA (Southwest) | 3109 students | +1 C classroom temperature, 20-25 C | Worse when hotter | not tested |
| Porras-Salazar et al. (2018) [26] | Classroom experiment | Costa Rica | 37 children | About 30 C vs 25 C | Worse when hotter | yes: AC on vs fans only |
| Kirkil (2025) [27] | Classroom experiment | not stated in abstract | 53 students | 27 C vs 20 C | Worse when hotter | not tested |
| Graff Zivin et al. (2017) [29] | Survey (repeated tests) | USA | not in abstract | Day of the test above 26 C | Worse on some tasks or groups | not tested |
| Cedeño Laurent et al. (2018) [28] | Everyday life (heat wave) | USA (Boston) | 44 students | Heat wave, rooms without vs with AC | Worse when hotter | yes: dorms with vs without AC |
| Masuda et al. (2020) [32] | Field experiment | Indonesia (East Kalimantan) | not in abstract | Deforested (2.1 C hotter) vs forested work site | Worse when hotter | not tested |
| Hou and Xu (2023) [30] | Survey (older adults) | China | not in abstract | +1 C monthly high temperature | Worse when hotter | not tested |
| Choi et al. (2023) [31] | Survey (older adults) | USA | not in abstract | High vs low cumulative extreme heat | Worse on some tasks or groups | not tested |
| Park (2020) [18] | National exam | USA (New York City) | not in abstract | Hot vs mild exam day | Worse when hotter | not in abstract |
| Graff Zivin et al. (2020) [19] | National exam | China | not in abstract | +1 SD of temperature (3.29 C) on exam days | Worse when hotter | not in abstract |
| Park et al. (2020) [21] | School year | USA | not in abstract | Hotter school days in the years before the test | Worse when hotter | yes: air conditioning largely offsets it |
| Garg et al. (2020) [22] | School year | India | not in abstract | Hot days in the year | Worse when hotter | not tested |
| Carlson and Shepardson (2026) [20] | School tests | USA (Tulsa) | not in abstract | Test day in the 90s F vs the 70s F | Worse when hotter | not in abstract |
| Vidogbena et al. (2026) [23] | School year | West and Central Africa | not in abstract | High temperatures in the school year | Worse when hotter | not tested |
| Gaoua et al. (2010) [41] | Lab experiment | not stated in abstract | 16 participants | 50 C vs 20 C (passive heating) | Worse on some tasks or groups | not tested |
| Zhang and de Dear (2016) [38] | Lab experiment | not stated in abstract | not in abstract | Temperature cycles above a 22 or 24 C set point | Worse on some tasks or groups | not tested |
| Wijayanto et al. (2017) [42] | Lab experiment | Japan | not in abstract | Passive leg heating at 28 C air | Worse on some tasks or groups | not tested |
| Chang and Kajackaite (2019) [33] | Lab experiment | not stated in abstract | 543 participants | Room temperature varied | Worse on some tasks or groups | not tested |
| Lan et al. (2020) [36] | Lab experiment | not stated in abstract | not in abstract | 27 C vs 23 C | Worse when hotter | not tested |
| Tian et al. (2020) [37] | Lab experiment | not stated in abstract | 48 participants | 39 C vs 26 C (70% humidity) | Worse when hotter | not tested |
| Piil et al. (2020) [40] | Lab experiment | not stated in abstract | not in abstract | Prolonged sunlight-level heat on head and neck | Worse when hotter | not tested |
| Stroom et al. (2021) [34] | Lab experiment | not stated in abstract | 257 participants | 28 C vs 22 C for two hours | No effect found | not tested |
| Liu et al. (2021) [39] | Lab experiment | not stated in abstract | not in abstract | Several temperature and humidity levels | Worse on some tasks or groups | not tested |
| Kramer and Schiavon (2026) [35] | Lab experiment | USA (San Francisco Bay Area) | 75 participants | 21, 23, 25 and 27 C | No effect found | not tested |
| Pilcher et al. (2002) [44] | Meta-analysis | Studies worldwide | 515 effect sizes (22 studies) | 32.2 C WBGT or above vs neutral | Worse when hotter | not tested |
| Hancock et al. (2007) [43] | Meta-analysis | Studies worldwide | 528 effect sizes (49 publications) | Heat and cold stress vs neutral | Worse when hotter | not tested |
| Picchio and van Ours (2024) [51] | Work tasks | not read | not in abstract | High temperatures | Not read (no open abstract) | not read |
| Cho (2017) [45] | School year | South Korea | not in abstract | Summer heat | Not read (no open abstract) | not read |
| Park et al. (2020) [46] | International tests | Many countries and USA | not in abstract | Heat exposure | Not read (no open abstract) | not read |
| Cook and Heyes (2020) [48] | University exams (cold) | Canada | not in abstract | Outdoor cold on exam day | Not read (no open abstract) | not read |
| Roach and Whitney (2021) [49] | School year | USA | not in abstract | Heat | Not read (no open abstract) | not read |
| Shah (2025) [50] | School year | Spain | not in abstract | Heat | Not read (no open abstract) | not read |
| Liu et al. (2021) [52] | Lab experiment | China | not in abstract | Temperature steps in hot summer | Not read (no open abstract) | not read |
| Porras-Salazar et al. (2024) [53] | Lab experiment | not read | 58 people | Indoor temperature | Not read (no open abstract) | not read |
| Wargocki et al. (2019) [47] | Meta-analysis | Studies worldwide | not in abstract | Classroom temperature | Not read (no open abstract) | not read |
Source: OpenAlex [4]; Crossref; NBER [5]; coding by IQ Metrics
12 How we built the dataset
- 01
Find the studies
Eight searches in OpenAlex (temperature and test scores, heat and cognitive performance, classroom temperature, heat waves and others, 1990-2026) plus the named leads gave 398 unique records; we kept 38 after reading titles and abstracts. OpenAlex flags no retraction among them; of 15 Crossref records we read, one carries a correction and one an erratum.
- 02
Read each finding
Each finding was copied as a sentence from the open abstract (OpenAlex or Crossref) or the authors’ working paper and checked by script against the saved text. Paywalled papers are cited for facts only. Rows without an open finding are marked “not read”.
- 03
Take exam dates from the boards
Twelve exam boards’ current timetables were saved and each date was checked by script. Where a board gives only a first and last day, every weekday between counts. Five exams were dropped: India’s CBSE (scanned date sheet), Italy’s maturita (site refused scripted requests), Turkey’s YKS and Vietnam’s exam (sites unreachable) and Egypt’s (no official page found).
- 04
Read the weather
NASA POWER daily maximum temperature, 1981-2025, one request per city at GeoNames coordinates [3]; five cities checked against NOAA GHCN-Daily stations.
- 05
Compute
For each exam window and year: mean exam-day maximum, days at 30 and 32 °C, days above 26 °C. Then 1981-2000 against 2006-2025 means. All IQ Metrics calculations, scripted from the cached files.
Read every number with these in mind
- Linked, not proven for each city: study effects come from other places and tests, and exam rooms may be cooled. We never estimate points lost in a city.
- Grid values are not thermometer readings: NASA POWER runs 0.1 to 2.6 °C cooler than city stations on average, and for one exam window the change can differ in sign from the station’s.
- Today’s exam dates are applied to every year on purpose; real past exams sometimes fell on other days.
- The ledger is a lower bound: 36 studies found by our searches and leads; 9 of them could not be read in an open abstract. Directions are our coding of the authors’ own sentence.
- Only 2 studies convert to standard deviations per degree; our conversions assume the authors’ temperature step (Carlson: a 20 °F step between the 70s and the 90s).
- Exams in India, Italy, Turkey, Vietnam and Egypt are missing because their official timetables could not be read by script.
Sources
- NASA Langley Research Center. NASA Langley Research Center, POWER Project: Daily API, T2M_MAX (temperature at 2 metres, daily maximum), MERRA-2, 1981 to 2025, v2.10.2. 2026. power.larc.nasa.govUS government work, public domain (one request per city, cached)
- NOAA National Centers for Environmental Information. Menne MJ, Durre I, Vose RS, Gleason BE, Houston TG: An overview of the Global Historical Climatology Network-Daily database. Journal of Atmospheric and Oceanic Technology 2012;29(7):897-910; data through the NCEI Access Data Service (TMAX, 5 stations). 2012. doi.org/10.1175/JTECH-D-11-00103.1US government work, public domain (station data)
- GeoNames. GeoNames: cities15000 (city coordinates). 2026. download.geonames.org/export/dumpCC BY 4.0
- OurResearch. OpenAlex: works metadata and abstracts (8 searches and 38 records). 2026. openalex.orgCC0 (metadata)
- National Bureau of Economic Research. Graff Zivin J, Song Y, Tang Q, Zhang P: Temperature and high-stakes cognitive performance: evidence from the National College Entrance Examination in China. NBER Working Paper 24821 (abstract page). 2018. www.nber.org/papers/w24821Working paper; facts cited from the abstract
- Ministry of Education of China. Ministry of Education of China: official 2026 dates of the Gaokao (national college entrance exam) (2026-06-07 to 2026-06-08). 2026. http://www.moe.gov.cn/jyb_xwfb/gzdt_gzdt/s5987/202606/t20260606_1438986.htmlOfficial notice; dates cited as facts
- College Board. College Board: official 2026 dates of the AP exams (2026-05-04 to 2026-05-15). 2026. apstudents.collegeboard.org/ap-exams-what-to-know/past-exam-dates/2026Official notice; dates cited as facts
- New York State Education Department. New York State Education Department: official 2026 dates of the Regents exams (June) (2026-06-09 to 2026-06-25). 2026. www.nysed.gov/sites/default/files/programs/state-assessment/regents-exams-schedule-june-2026.pdfOfficial notice; dates cited as facts
- Joint Council for Qualifications. Joint Council for Qualifications: official 2026 dates of the GCSE and A level (June series) (2026-05-07 to 2026-06-23). 2026. www.jcq.org.uk/wp-content/uploads/sites/2/2025/09/Key_Dates_June2026_FINAL.pdfOfficial notice; dates cited as facts
- Ministry of National Education (Bulletin officiel 36, 25 Sept 2025, annexe III). Ministry of National Education (Bulletin officiel 36, 25 Sept 2025, annexe III): official 2026 dates of the Baccalaureat general (written papers) (2026-06-11 to 2026-06-18). 2026. www.education.gouv.fr/sites/default/files/annexe-iii-session-2026-calendrier-des-preuves-crites-du-baccalaur-at-g-n-ral-442200.pdfOfficial notice; dates cited as facts
- Comunidad de Madrid. Comunidad de Madrid: official 2026 dates of the PAU (university entrance), Madrid region (2026-06-01 to 2026-06-04). 2026. www.comunidad.madrid/educacion/calendario-acceso-universidadOfficial notice; dates cited as facts
- Ministry of Education of Greece. Ministry of Education of Greece: official 2026 dates of the Panhellenic exams (general lyceum) (2026-05-29 to 2026-06-08). 2026. www.minedu.gov.gr/ (press release of 11 Sept 2025, programme of the 2026 Panhellenic exams)Official notice; dates cited as facts
- West African Examinations Council (Nigeria). West African Examinations Council (Nigeria): official 2026 dates of the WASSCE for school candidates (written papers) (2026-05-12 to 2026-06-19). 2026. www.waecnigeria.org/sites/default/files/2026-03/FINAL%20TIMETABLE%20WASSCE%20(SC)%202026%20-%20NIGERIA.pdfOfficial notice; dates cited as facts
- Ministry of Education / Korea Institute for Curriculum and Evaluation. Ministry of Education / Korea Institute for Curriculum and Evaluation: official 2026 dates of the CSAT (suneung) (2026-11-19 to 2026-11-19). 2026. www.moe.go.kr/boardCnts/viewRenew.do?boardID=294&boardSeq=105756&lev=0&m=020402Official notice; dates cited as facts
- National Center for University Entrance Examinations. National Center for University Entrance Examinations: official 2026 dates of the Common Test for University Admissions (2027-01-16 to 2027-01-17). 2026. www.dnc.ac.jp/kyotsu/shiken_jouhou/r9Official notice; dates cited as facts
- INEP (Ministry of Education). INEP (Ministry of Education): official 2026 dates of the ENEM (2026-11-08 to 2026-11-15). 2026. www.gov.br/inep/pt-br/centrais-de-conteudo/noticias/enem/enem-2026-falta-um-mes-para-o-primeiro-dia-de-provasOfficial notice; dates cited as facts
- NSW Education Standards Authority. NSW Education Standards Authority: official 2026 dates of the HSC written exams (2026-10-13 to 2026-11-05). 2026. educationstandards.nsw.edu.au/wps/portal/nesa/11-12/hsc/key-dates-exam-timetablesOfficial notice; dates cited as facts
- The Journal of Human Resources 2020. Park: Hot Temperature and High-Stakes Performance. The Journal of Human Resources 2020. 2020. doi.org/10.3368/jhr.57.2.0618-9535r3Paywalled: facts cited from the abstract
- Journal of Environmental Economics and Management 2020. Graff Zivin et al.: Temperature and high-stakes cognitive performance: Evidence from the national college entrance examination in China. Journal of Environmental Economics and Management 2020. 2020. doi.org/10.1016/j.jeem.2020.102365Paywalled: facts cited from the abstract
- American Educational Research Journal 2026. Carlson and Shepardson: Under the Weather? Seasonal Effects of Temperature on Student Test Performance. American Educational Research Journal 2026. 2026. doi.org/10.3102/00028312261489233Paywalled: facts cited from the abstract
- American Economic Journal Economic Policy 2020. Park et al.: Heat and Learning. American Economic Journal Economic Policy 2020. 2020. doi.org/10.1257/pol.20180612Paywalled: facts cited from the abstract
- Journal of the Association of Environmental and Resource Economists 2020. Garg et al.: Temperature and Human Capital in India. Journal of the Association of Environmental and Resource Economists 2020. 2020. doi.org/10.1086/710066Open access
- Population and Environment 2026. Vidogbena et al.: The impacts of temperature on reading and math test scores in West and Central Africa. Population and Environment 2026. 2026. doi.org/10.1007/s11111-026-00531-zCC BY (open access)
- PLoS ONE 2015. Haverinen‐Shaughnessy and Shaughnessy: Effects of Classroom Ventilation Rate and Temperature on Students’ Test Scores. PLoS ONE 2015. 2015. doi.org/10.1371/journal.pone.0136165CC BY (open access)
- Science and Technology for the Built Environment 2007. Wargocki and Wyon: The Effects of Moderately Raised Classroom Temperatures and Classroom Ventilation Rate on the Performance of Schoolwork by Children (RP-1257). Science and Technology for the Built Environment 2007. 2007. doi.org/10.1080/10789669.2007.10390951Paywalled: facts cited from the abstract
- Indoor Air 2018. Porras-Salazar et al.: Reducing classroom temperature in a tropical climate improved the thermal comfort and the performance of elementary school pupils. Indoor Air 2018. 2018. doi.org/10.1111/ina.12501Open access
- Frontiers in Built Environment 2025. Kirkil: Effects of classroom temperature and humidity on student learning performance: an experimental study using sensor-based monitoring. Frontiers in Built Environment 2025. 2025. doi.org/10.3389/fbuil.2025.1678438CC BY (open access)
- PLoS Medicine 2018. Cedeño Laurent et al.: Reduced cognitive function during a heat wave among residents of non-air-conditioned buildings: An observational study of young adults in the summer of 2016. PLoS Medicine 2018. 2018. doi.org/10.1371/journal.pmed.1002605CC BY (open access)
- Journal of the Association of Environmental and Resource Economists 2017. Graff Zivin et al.: Temperature and Human Capital in the Short and Long Run. Journal of the Association of Environmental and Resource Economists 2017. 2017. doi.org/10.1086/694177Paywalled: facts cited from the abstract
- Scientific Reports 2023. Hou and Xu: Ambient temperatures associated with reduced cognitive function in older adults in China. Scientific Reports 2023. 2023. doi.org/10.1038/s41598-023-44776-2CC BY (open access)
- Journal of Epidemiology and Community Health 2023. Choi et al.: Cumulative exposure to extreme heat and trajectories of cognitive decline among older adults in the USA. Journal of Epidemiology and Community Health 2023. 2023. doi.org/10.1136/jech-2023-220675Paywalled: facts cited from the abstract
- Environmental Research Letters 2020. Masuda et al.: Heat exposure from tropical deforestation decreases cognitive performance of rural workers: an experimental study. Environmental Research Letters 2020. 2020. doi.org/10.1088/1748-9326/abb96cCC BY (open access)
- PLoS ONE 2019. Chang and Kajackaite: Battle for the thermostat: Gender and the effect of temperature on cognitive performance. PLoS ONE 2019. 2019. doi.org/10.1371/journal.pone.0216362CC BY (open access)
- Judgment and Decision Making 2021. Stroom et al.: Turning up the heat: The impact of indoor temperature on selected cognitive processes and the validity of self-report. Judgment and Decision Making 2021. 2021. doi.org/10.1017/s1930297500007828CC BY (open access)
- Buildings and Cities 2026. Kramer and Schiavon: Indoor temperature and office work performance in a temperate climate. Buildings and Cities 2026. 2026. doi.org/10.5334/bc.876CC BY (open access)
- Indoor Air 2020. Lan et al.: Perceived air quality and cognitive performance decrease at moderately raised indoor temperatures even when clothed for comfort. Indoor Air 2020. 2020. doi.org/10.1111/ina.12685Open access
- Indoor Air 2020. Tian et al.: Decreased humidity improves cognitive performance at extreme high indoor temperature. Indoor Air 2020. 2020. doi.org/10.1111/ina.12755Open access
- Indoor Air 2016. Zhang and de Dear: University students' cognitive performance under temperature cycles induced by direct load control events. Indoor Air 2016. 2016. doi.org/10.1111/ina.12296Open access
- Case Studies in Thermal Engineering 2021. Liu et al.: Influence of indoor air temperature and relative humidity on learning performance of undergraduates. Case Studies in Thermal Engineering 2021. 2021. doi.org/10.1016/j.csite.2021.101458CC BY NC ND (open access)
- Scientific Reports 2020. Piil et al.: Direct exposure of the head to solar heat radiation impairs motor-cognitive performance. Scientific Reports 2020. 2020. doi.org/10.1038/s41598-020-64768-wCC BY (open access)
- International Journal of Hyperthermia 2010. Gaoua et al.: Alterations in cognitive performance during passive hyperthermia are task dependent. International Journal of Hyperthermia 2010. 2010. doi.org/10.3109/02656736.2010.516305Open access
- Journal of PHYSIOLOGICAL ANTHROPOLOGY 2017. Wijayanto et al.: Cognitive performance during passive heat exposure in Japanese males and tropical Asian males from Southeast Asian living in Japan. Journal of PHYSIOLOGICAL ANTHROPOLOGY 2017. 2017. doi.org/10.1186/s40101-016-0124-4CC BY (open access)
- Human Factors The Journal of the Human Factors and Ergonomics Society 2007. Hancock et al.: A Meta-Analysis of Performance Response Under Thermal Stressors. Human Factors The Journal of the Human Factors and Ergonomics Society 2007. 2007. doi.org/10.1518/001872007×230226Open access
- Ergonomics 2002. Pilcher et al.: Effects of hot and cold temperature exposure on performance: a meta-analytic review. Ergonomics 2002. 2002. doi.org/10.1080/00140130210158419Paywalled: facts cited from the abstract
- Journal of Environmental Economics and Management 2017. Cho: The effects of summer heat on academic achievement: A cohort analysis. Journal of Environmental Economics and Management 2017. 2017. doi.org/10.1016/j.jeem.2017.03.005Paywalled: facts cited from the abstract; finding not read (no open abstract), cited as a record only
- Nature Human Behaviour 2020. Park et al.: Learning is inhibited by heat exposure, both internationally and within the United States. Nature Human Behaviour 2020. 2020. doi.org/10.1038/s41562-020-00959-9Paywalled: facts cited from the abstract; finding not read (no open abstract), cited as a record only
- Building and Environment 2019. Wargocki et al.: The relationship between classroom temperature and children’s performance in school. Building and Environment 2019. 2019. doi.org/10.1016/j.buildenv.2019.04.046Open access; finding not read (no open abstract), cited as a record only
- Journal of Environmental Economics and Management 2020. Cook and Heyes: Brain freeze: outdoor cold and indoor cognitive performance. Journal of Environmental Economics and Management 2020. 2020. doi.org/10.1016/j.jeem.2020.102318Open access; finding not read (no open abstract), cited as a record only
- Education Economics 2021. Roach and Whitney: Heat and learning in elementary and middle school. Education Economics 2021. 2021. doi.org/10.1080/09645292.2021.1931815Paywalled: facts cited from the abstract; finding not read (no open abstract), cited as a record only
- International Journal of Educational Research 2025. Shah: Heat affects learning: Evidence from Spanish autonomous regions. International Journal of Educational Research 2025. 2025. doi.org/10.1016/j.ijer.2025.102772Paywalled: facts cited from the abstract; finding not read (no open abstract), cited as a record only
- Labour Economics 2024. Picchio and van Ours: The impact of high temperatures on performance in work-related activities. Labour Economics 2024. 2024. doi.org/10.1016/j.labeco.2024.102509CC BY (open access); finding not read (no open abstract), cited as a record only
- Energy and Buildings 2021. Liu et al.: Overall effects of temperature steps in hot summer on students' subjective perception, physiological response and learning performance. Energy and Buildings 2021. 2021. doi.org/10.1016/j.enbuild.2021.111124Open access; finding not read (no open abstract), cited as a record only
- Building and Environment 2024. Porras-Salazar et al.: The effect of indoor temperature on work performance of fifty-eight people in a simulated office environment. Building and Environment 2024. 2024. doi.org/10.1016/j.buildenv.2024.111813Paywalled: facts cited from the abstract; finding not read (no open abstract), cited as a record only
Version history
- 2026.114 November 2026First release. Next update due February 2027, after the 2026 exam seasons are complete in NASA POWER and new exam timetables are out; sooner if a study in the ledger is corrected or retracted.
Leon Falkner, Data & Research Analyst. Leon owns the arithmetic on IQ Metrics: the percentile tables, the score converter and the figures in everyone else's drafts. On the research desk Leon pulls the data, builds each index and writes the method. More about Leon.
Questions
Does heat affect your brain?
Yes, in most studies. 18 of the 27 studies whose findings we could read report worse thinking or lower test scores when hotter; 7 find it for some tasks or groups only and 2 find no effect, mostly in mild office-range heat.
Does heat make you dumber?
No lasting loss of intelligence is shown. Heat lowers performance while it lasts: on China's gaokao about 0.029 standard deviations per extra degree, a fraction of a percentile point. IQ is not lowered by a hot day.
Does hot weather lower test scores?
Yes, by small amounts. A test day in the 90s °F cost about 0.06 SD of math in Tulsa, and hot exam days lowered New York Regents scores by up to 13 percent of an SD. Effects add up over millions of tests.
What is the best room temperature for studying?
Classroom and lab studies find the best results at about 20 to 24 °C. US math scores rose 12 to 13 points per 1 °C cooler within 20 to 25 °C; one chamber study found no change from 21 to 27 °C.
How does temperature affect exam performance?
Temperature and exam performance studies find scores fall as exam days get hotter: 9.62% of an SD per 3.29 °C on the gaokao. Air conditioning largely offset heat's effect in US schools.
Are exam days getting hotter?
In our data, yes: 33 of 41 exam windows in 40 cities were hotter in 2006-2025 than in 1981-2000, by +0.68 °C on average, and exam days at 30 °C or more rose from 17.6% to 22.0%.
Which exam is sat in the most heat?
Nigeria's WASSCE in Kano had the hottest exam days in 2025, a mean maximum of 40.1 °C, and 62.1% of China's gaokao days in our 12 cities reached 30 °C in 2006-2025.
Does air conditioning help students in the heat?
In all 4 studies that tested it. US school air conditioning largely offset heat's effect on PSAT learning, and in a 2016 Boston heat wave students without air conditioning were 13.4% slower on a Stroop test than those with it.
Is heat worse for children or adults?
The studies do not compare ages directly. Every exam and school-test study we could read found harm in children or teenagers; lab studies of adults are mixed, with two finding no effect at 27 to 28 °C.
Where do the temperature data come from?
NASA POWER daily maximum temperatures (public domain) for each city, 1981 to 2025, checked against NOAA GHCN-Daily stations in five cities. The grid runs cooler than city stations by 0.1 to 2.6 °C on average.
Share it, cite it, download it
You may reuse everything on this page under CC BY 4.0: in articles, reports, lessons and posts. The one condition is credit to IQ Metrics with a link to this page.
Cite this study
Version 2026.11. Citing the version lets readers find the exact numbers.
Archived copy with a DOI: 10.5281/zenodo.23939702 (report PDF and data on Zenodo).
Falkner, L. (2026). Does heat affect your brain? 36 studies and 41 exam windows, measured (Version 2026.11) [Data set]. IQ Metrics Research. https://iqmetrics.org/research/does-heat-affect-your-brain/ (DOI: 10.5281/zenodo.23939702)
Falkner, Leon. "Does heat affect your brain? 36 studies and 41 exam windows, measured." IQ Metrics Research, 4 Nov. 2026, iqmetrics.org/research/does-heat-affect-your-brain/. DOI: 10.5281/zenodo.23939702.
Falkner, Leon. "Does heat affect your brain? 36 studies and 41 exam windows, measured." IQ Metrics Research. November 4, 2026. https://iqmetrics.org/research/does-heat-affect-your-brain/. DOI: 10.5281/zenodo.23939702.
@misc{iqmetrics2026doesheataffectyourbrain, author = {Falkner, Leon}, title = {Does heat affect your brain? 36 studies and 41 exam windows, measured}, institution = {IQ Metrics}, year = {2026}, version = {2026.11}, doi = {10.5281/zenodo.23939702}, url = {https://iqmetrics.org/research/does-heat-affect-your-brain/} }
Source: Leon Falkner, "Does heat affect your brain? 36 studies and 41 exam windows, measured." IQ Metrics Research, version 2026.11, https://iqmetrics.org/research/does-heat-affect-your-brain/ (DOI 10.5281/zenodo.23939702)
Embed the key numbers
Paste this into an article or post. It lists the main numbers and credits the source.
Get the data
One row per exam window (41 rows: an exam in a city): the current official exam days, the mean daily maximum on those days in 1981-2000 and 2006-2025, the change, hot exam days at 30 and 32 °C, the share of exam days above 26 °C, the trend per decade, 2025 values, coordinates and the NASA POWER grid cell. The study ledger is in the table’s own CSV.
| Column | What it holds |
|---|---|
exam, country, city | The exam (board's name), its country and the city whose weather is used |
n_days, first_2026, last_2026 | Number of exam days and the first and last day of the current official timetable (Japan: January 2027) |
p1_mean_tmax, p2_mean_tmax, change_mean_tmax | Mean daily maximum on exam days (°C), 1981-2000 and 2006-2025, and the change |
trend_c_per_decade | Least-squares trend of the yearly exam-day mean, 1981-2025, °C per decade |
p1_hot30_days, p2_hot30_days, change_hot30_days, p1_hot32_days, p2_hot32_days | Exam days per year at 30 °C or more (and 32 °C), period means |
p1_share_over26, p2_share_over26 | Share of exam days above 26 °C (%), period means |
y2025_mean_tmax, y2025_max_tmax, y2025_hot30_days | The same for 2025 alone |
lat, lon, power_cell_lat, power_cell_lon | GeoNames city coordinates and the NASA POWER point returned |
source_url | The exam board page or document the dates were read from |
For journalists, researchers and teachers
Everything on this page may be quoted, charted and republished with credit. No embargo, no permission needed, no sign-up. If you need a number that is not here, ask.
Summary you can paste
Plain news style. Edit freely; keep the credit.
IQ Metrics Research built a ledger of 36 studies that measured thinking or test scores against temperature (2002 to 2026) and calculated exam-day heat for 41 national exam windows in 40 cities from NASA POWER, 1981 to 2025. 18 of 27 studies with a readable finding report worse scores when hotter. 33 of 41 exam windows got hotter between 1981-2000 and 2006-2025, by +0.68 °C on average; exam days at 30 °C rose from 17.6% to 22.0%. Linked, not proven for each city. Source: IQ Metrics Research, https://iqmetrics.org/research/does-heat-affect-your-brain/
Angles for a story
- 33 of 41 exam windows got hotter: which ones (Figure 5)
- The gaokao: 62.1% of exam days at 30 °C in 12 cities (Figure 9)
- Exam season 2025 in New York, day by day (Figure 11)
- From 398 records to 2 comparable numbers: why heat studies are hard to pool (Figure 1)
- Air conditioning: every study that tested it found less harm (the exam section)
- Grid against thermometer: how far NASA POWER is from city stations (Figure 12)
Quotes you can use
Attributable as written, with the name and title. For a different angle or a quote on a specific figure, ask through the contact page.
Heat lowers scores in most studies, but by small amounts per degree. What is changing is how often exams are sat in that heat.
Leon Falkner, Data & Research Analyst, IQ Metrics ResearchWe used today’s exam dates for every year since 1981, so the warming we measured is the weather, not a moved timetable.
Leon Falkner, Data & Research Analyst, IQ Metrics ResearchA grid cell is not a thermometer. For one city a change under a degree is noise; across 41 exam windows the direction is clear.
Leon Falkner, Data & Research Analyst, IQ Metrics Research
Files
- CSV of every exam window: exam, city, dates, mean exam-day maximum 1981-2000 and 2006-2025, hot days at 30 and 32 °C, share above 26 °C, trend, 2025 values (CC BY 4.0)
- The study ledger: the Data button under the study table
- Every figure as a print-ready PNG: use the Image button under each figure
- Embed code and data table under every figure
- Share images for social media in three sizes, with the credit line built in
- Citations in APA, MLA, Chicago, BibTeX and plain text
Terms, contact and corrections
Credit: “IQ Metrics Research, Does heat affect your brain? (2026)” with a link to this page. On air or in print, “IQ Metrics” and the page address are enough.
What it covers: studies of temperature and thinking or test scores found by our searches (2002 to 2026), and exam-day heat for 41 exam windows in 40 cities, 1981 to 2025.
Contact: the research team, through the contact page. Corrections are made on this page with a dated note in the version history.