Left Brain, Right Brain, and Five Other Myths About Intelligence
You are not left-brained or right-brained, you do not use ten per cent of your brain, and matching a lesson to your learning style does not help you learn. Six claims about intelligence that almost everyone repeats, what the studies that tested them found, and the smaller true fact hiding inside each one.
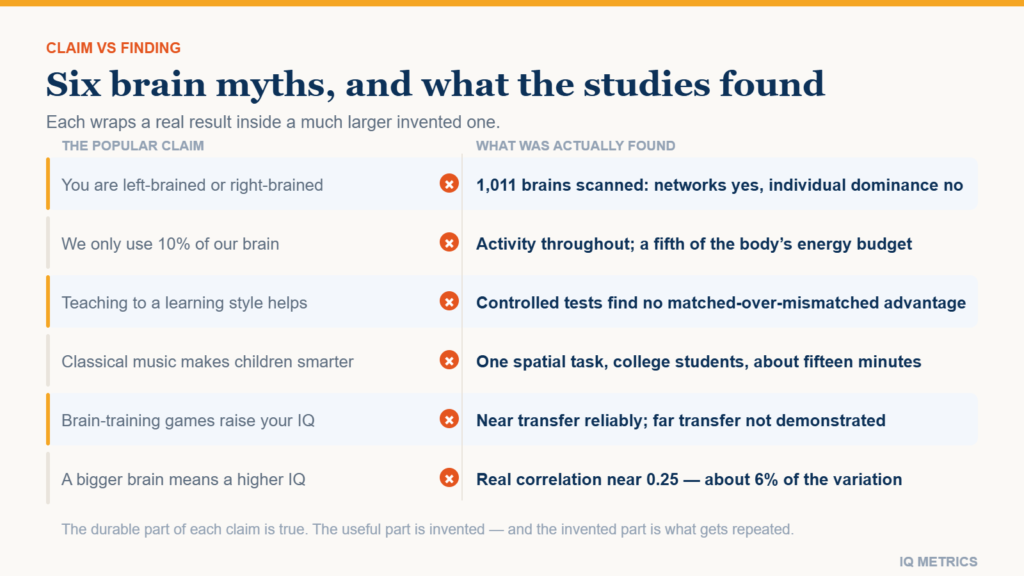
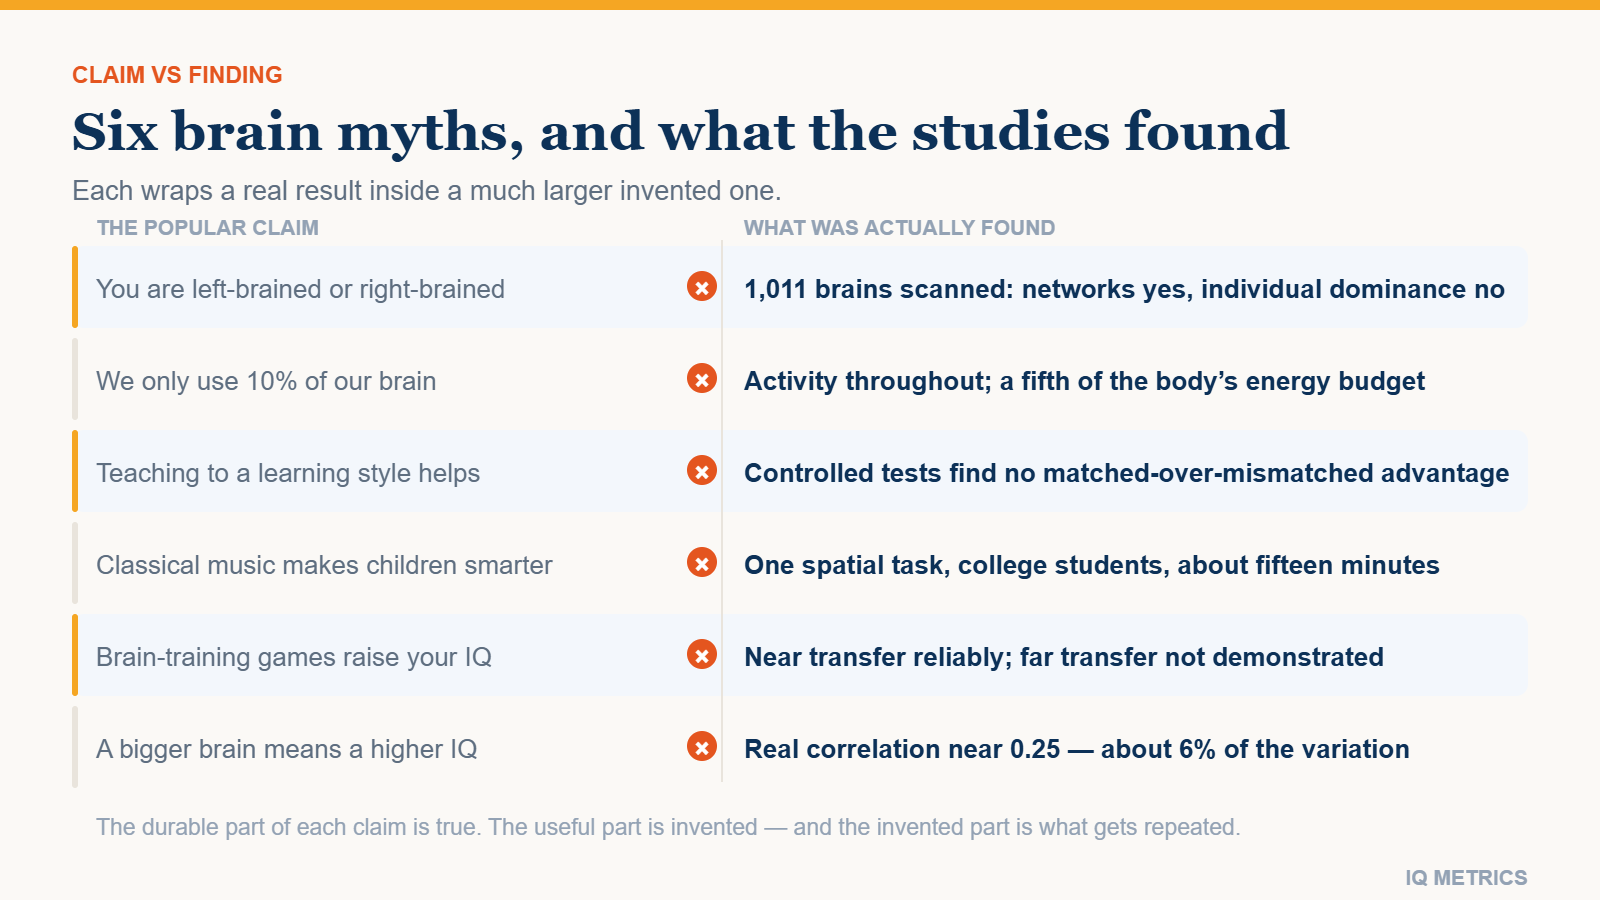
Most brain myths about intelligence survive because each one wraps a real finding in a much larger false one. Hemispheres really do specialise — but nobody is left-brained. Brain size really does correlate with test scores — but far too weakly to tell you anything about a person. The durable part is true, the useful part is invented, and the invented part is what gets repeated.
Here are six of them, the study that tested each, and the smaller true fact left standing afterwards.
Myth 1: you are left-brained or right-brained
The claim is that people have a dominant hemisphere, and that dominance produces a personality: left-brained people are logical and analytical, right-brained people creative and intuitive.
It was tested directly. A 2013 University of Utah analysis of resting-state scans from over a thousand brains looked for exactly this — individuals whose left-lateralised networks were globally stronger than their right, or the reverse. The lateralised networks were there. The individual dominance was not. People did not sort into two types.
The idea has a respectable ancestor, which is why it is so hard to dislodge. Roger Sperry and Michael Gazzaniga’s split-brain work in the 1960s studied patients whose corpus callosum had been severed to control epilepsy, and demonstrated that the disconnected hemispheres really could process information separately. That is a Nobel-recognised finding about surgically divided brains. The leap from there to intact brains having a dominant half, and from a dominant half to a personality, was made by popular writing in the 1970s and never by the research.
What is true: lateralisation is real and well-mapped. Language production is left-lateralised in the large majority of right-handed people; aspects of spatial attention and prosody lean right. What does not follow is a personality type, and certainly not a study technique. Every complex task, including every item on an IQ test, recruits both sides. Our page on which part of the brain IQ tests measure covers the distributed frontal and parietal network that actually does the work.
Myth 2: we only use 10 per cent of our brain
This one has no identifiable source study, which is itself telling. It has been attributed to William James, to Einstein and to a misreading of early glial-cell counts, and none of the attributions holds up.
It fails on three independent grounds. Functional imaging finds activity throughout the brain over the course of a day, not in a tenth of it. The brain consumes roughly a fifth of the body’s energy at about two per cent of body weight — metabolically implausible for tissue that is ninety per cent idle. And damage to almost any region produces a deficit, which would not be the case if most of the organ were spare capacity.
What is true: not all neurons fire at once, which would be a seizure. Efficiency, not idleness, is the finding — and there is some evidence that higher-scoring brains show less activation on easy tasks, not more.
Myth 3: teaching to a learning style improves learning
The claim: people are visual, auditory or kinaesthetic learners, and matching instruction to the style raises achievement.
This is the myth with the cleanest test, because the claim makes a specific prediction — an interaction. Assess learners, split them, teach half in their preferred style and half in another, then test everyone. The matched groups should win. A 2008 review commissioned by Psychological Science in the Public Interest found that studies using this design were rare, and that the few well-controlled ones did not produce the interaction. Later replications have agreed.
Belief in it remains close to universal. Surveys of teachers across several countries have repeatedly found nine in ten endorsing the idea, and it persists in training materials long after the reviews. The reason it feels true is that it makes a correct prediction about something else: students who are taught in a way they enjoy report enjoying it more, and engagement genuinely helps. The style-matching part adds nothing on top of that.
What is true: people do have preferences, and material has a best modality — you learn geography from a map and pronunciation from audio, whoever you are. Preference is real; the benefit of matching is what fails. This one matters more than it looks, because it is the mechanism by which multiple intelligences theory is most often misapplied in classrooms.
Myth 4: classical music makes children smarter
The 1993 study behind the “Mozart effect” reported a small, temporary improvement on one spatial task in college students, lasting about fifteen minutes. It did not test children, did not measure IQ and did not claim a lasting effect. Everything else was added by the coverage. Later work traced the small effect to arousal and mood: anything enjoyable produces it, including an audiobook, if you like audiobooks. Our fact-check on whether music raises IQ has the full history.
What is true: sustained musical training is a different proposition with a genuinely more interesting literature, though causal claims there remain contested too.
Where would your own score land?
Take the IIF-certified assessment and get your score with the scale it was measured on, the percentile it corresponds to and the confidence range around it — the three figures most online tests leave out.
Myth 5: brain-training games raise your IQ
People who practise a brain-training task get better at that task. They also improve on tasks that closely resemble it. What large randomised trials have struggled to demonstrate is far transfer — improvement on unrelated reasoning that was never trained. Meta-analyses of working-memory training find reliable near transfer and little to no far transfer.
The largest single test of the claim recruited more than eleven thousand participants through a television-linked online trial and trained them on reasoning, memory and attention tasks over six weeks. Trained tasks improved. Untrained cognitive tasks did not improve more in the training groups than in the control group. Subsequent trials have complicated the picture in places, particularly for older adults and for specific working-memory paradigms, but no result has established the broad transfer the products advertise.
What is true: scores do move, and the honest account of why is unglamorous. Familiarity with format, reduced anxiety and better strategy are real gains that show up as points without a change in underlying ability. That distinction is the whole subject of whether you can improve your IQ, and it is why a second sitting of the same test is not independent evidence.
Myth 6: a bigger brain means a higher IQ
Unlike the others, this one starts from a real correlation. Meta-analyses of in-vivo imaging put the relationship between total brain volume and IQ score at roughly 0.24 to 0.30 in adults. It is a genuine, replicated finding.
It is also nearly useless about an individual. A correlation of 0.25 accounts for around six per cent of the variance, which means brain volume tells you almost nothing about any particular person’s score. Organisation, connectivity and cortical thickness carry more signal than gross volume, and between-species and between-sex comparisons break the pattern entirely.
The historical record here is a warning rather than a curiosity. Nineteenth-century craniometry measured skulls with real instruments and real arithmetic, and produced conclusions that tracked the prejudices of the measurers rather than the tissue. The methods were not the problem; the willingness to read a small, noisy correlation as a verdict about groups was. That failure mode has not gone away, which is part of why the history of intelligence testing is worth knowing before quoting any number about brains.
Why these particular myths survive
Three features keep them alive, and recognising the pattern is more useful than memorising the list.
- Each contains a true kernel, so a correction that denies the whole claim sounds wrong to anyone who knows the kernel.
- Each offers an identity or a shortcut. Being a right-brained visual learner explains something about you and asks nothing of you.
- Each is unfalsifiable in daily life. Nothing that happens this week will disconfirm the ten per cent claim.
Checking a brain claim in ninety seconds
You do not need a neuroscience background to filter most of this. Four questions catch the large majority of bad claims.
- Does it describe a type of person? Brains vary continuously. Claims that sort people into two or four kinds are almost always folk taxonomy wearing a lab coat.
- What was the outcome measure? “Improved brain function” is not one. A named task with a published score is.
- Was there a control group doing something equally engaging? Most training and music effects vanish against an active control rather than a do-nothing one.
- How large is the effect, in the units you care about? A real but tiny correlation is the commonest way a true finding becomes a false headline.
The same three features explain why the popular picture of intelligence drifts so far from the measured one — and why the gap between IQ and emotional intelligence as marketed and as measured is so wide. If you want to see what a test actually samples rather than what folklore says it does, the IQ tests hub sets out each reasoning domain and what it is built to capture.
Keep reading
 Research & Evidence
Gardner’s Multiple Intelligences
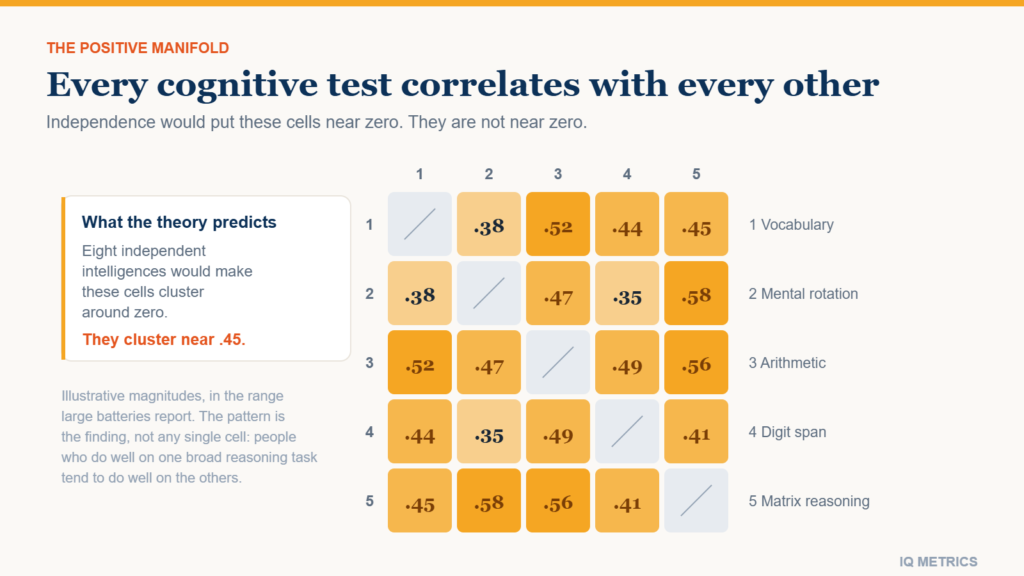
Gardner’s multiple intelligences theory is one of the most influential ideas in education and almost entirely absent from the tests psychologists use. That gap is not stubbornness. It comes down to one stubborn statistical finding, one missing instrument, and a real insight the theory carries.
 Understanding IQ
Which Part of the Brain, IQ Tests Measures
Finally, IQ tests focus on certain regions of the brain to reveal the chemical basis of intelligence. If we want to know how we gain intelligence, we must study the roles and connections between these domains. It is essential to recognize that IQ tests have limitations, and a more thorough assessment of intelligence is necessary.
 Mind & Everyday Life
IQ vs EQ
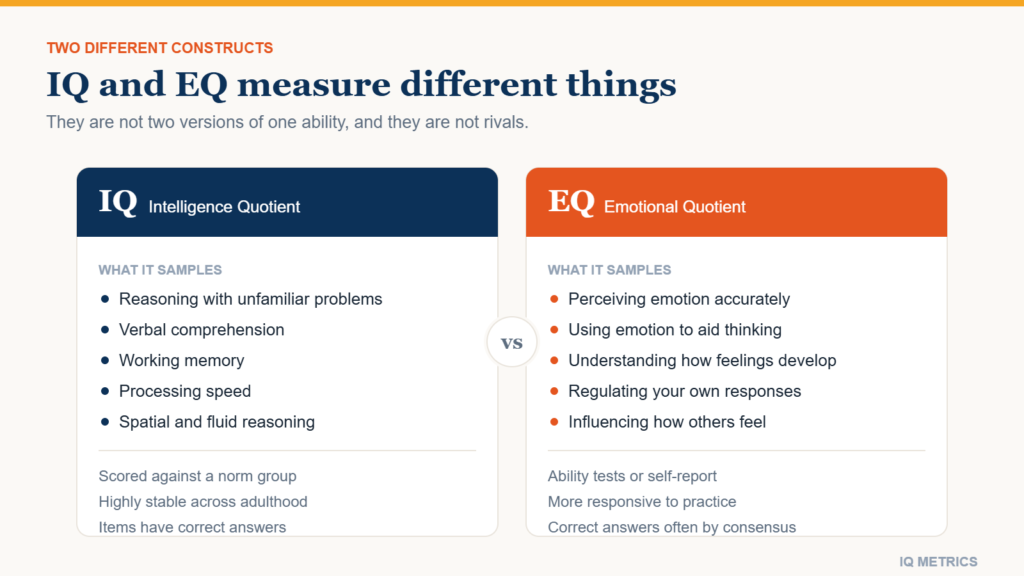
IQ measures reasoning; EQ measures how well you read and manage emotion. They are different constructs, measured in different ways, with different amounts of evidence behind them. Here is what each one actually predicts, which is easier to change, and where the popular claim that EQ matters more comes from.