IQ Metrics
IIF Certified Assessment Start IQ Test
IIF Certified Assessment

Brain Myths About Intelligence

Understanding IQ

Left Brain, Right Brain, and Five Other Myths About Intelligence

You are not left-brained or right-brained, you do not use ten per cent of your brain, and matching a lesson to your learning style does not help you learn. Six claims about intelligence that almost everyone repeats, what the studies that tested them found, and the smaller true fact hiding inside each one.
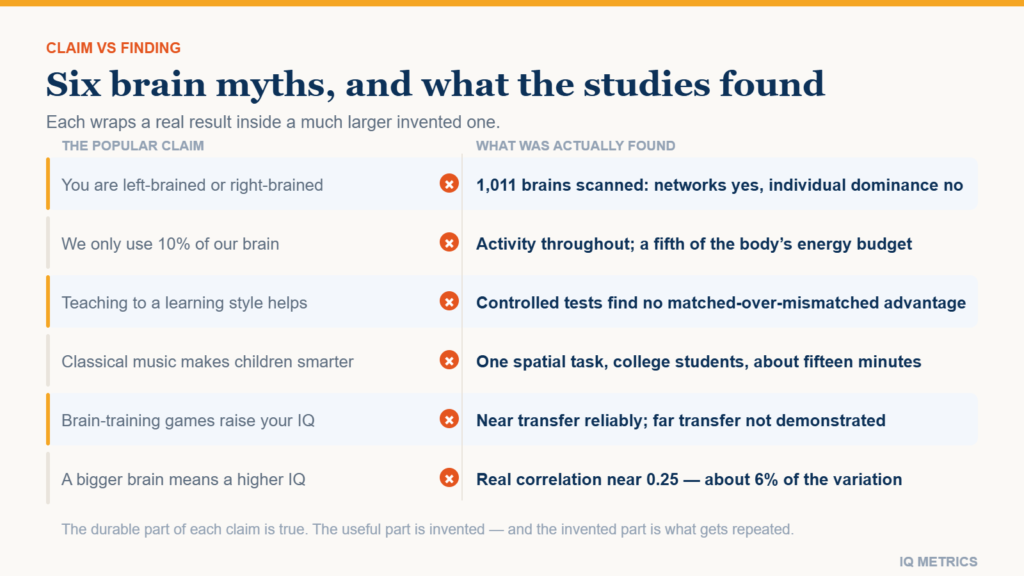
Chart contrasting six popular brain claims with what research found, showing the residual grain of truth in each: lateralisation without dominance, whole-brain activity, no meshing effect, no far transfer and a small brain size correlation

Most brain myths about intelligence survive because each one wraps a real finding in a much larger false one. Hemispheres really do specialise — but nobody is left-brained. Brain size really does correlate with test scores — but far too weakly to tell you anything about a person. The durable part is true, the useful part is invented, and the invented part is what gets repeated.

Here are six of them, the study that tested each, and the smaller true fact left standing afterwards.

Myth 1: you are left-brained or right-brained

The claim is that people have a dominant hemisphere, and that dominance produces a personality: left-brained people are logical and analytical, right-brained people creative and intuitive.

It was tested directly. A 2013 University of Utah analysis of resting-state scans from over a thousand brains looked for exactly this — individuals whose left-lateralised networks were globally stronger than their right, or the reverse. The lateralised networks were there. The individual dominance was not. People did not sort into two types.

The idea has a respectable ancestor, which is why it is so hard to dislodge. Roger Sperry and Michael Gazzaniga’s split-brain work in the 1960s studied patients whose corpus callosum had been severed to control epilepsy, and demonstrated that the disconnected hemispheres really could process information separately. That is a Nobel-recognised finding about surgically divided brains. The leap from there to intact brains having a dominant half, and from a dominant half to a personality, was made by popular writing in the 1970s and never by the research.

What is true: lateralisation is real and well-mapped. Language production is left-lateralised in the large majority of right-handed people; aspects of spatial attention and prosody lean right. What does not follow is a personality type, and certainly not a study technique. Every complex task, including every item on an IQ test, recruits both sides. Our page on which part of the brain IQ tests measure covers the distributed frontal and parietal network that actually does the work.

Myth 2: we only use 10 per cent of our brain

This one has no identifiable source study, which is itself telling. It has been attributed to William James, to Einstein and to a misreading of early glial-cell counts, and none of the attributions holds up.

It fails on three independent grounds. Functional imaging finds activity throughout the brain over the course of a day, not in a tenth of it. The brain consumes roughly a fifth of the body’s energy at about two per cent of body weight — metabolically implausible for tissue that is ninety per cent idle. And damage to almost any region produces a deficit, which would not be the case if most of the organ were spare capacity.

What is true: not all neurons fire at once, which would be a seizure. Efficiency, not idleness, is the finding — and there is some evidence that higher-scoring brains show less activation on easy tasks, not more.

Myth 3: teaching to a learning style improves learning

The claim: people are visual, auditory or kinaesthetic learners, and matching instruction to the style raises achievement.

This is the myth with the cleanest test, because the claim makes a specific prediction — an interaction. Assess learners, split them, teach half in their preferred style and half in another, then test everyone. The matched groups should win. A 2008 review commissioned by Psychological Science in the Public Interest found that studies using this design were rare, and that the few well-controlled ones did not produce the interaction. Later replications have agreed.

Belief in it remains close to universal. Surveys of teachers across several countries have repeatedly found nine in ten endorsing the idea, and it persists in training materials long after the reviews. The reason it feels true is that it makes a correct prediction about something else: students who are taught in a way they enjoy report enjoying it more, and engagement genuinely helps. The style-matching part adds nothing on top of that.

What is true: people do have preferences, and material has a best modality — you learn geography from a map and pronunciation from audio, whoever you are. Preference is real; the benefit of matching is what fails. This one matters more than it looks, because it is the mechanism by which multiple intelligences theory is most often misapplied in classrooms.

Myth 4: classical music makes children smarter

The 1993 study behind the “Mozart effect” reported a small, temporary improvement on one spatial task in college students, lasting about fifteen minutes. It did not test children, did not measure IQ and did not claim a lasting effect. Everything else was added by the coverage. Later work traced the small effect to arousal and mood: anything enjoyable produces it, including an audiobook, if you like audiobooks. Our fact-check on whether music raises IQ has the full history.

What is true: sustained musical training is a different proposition with a genuinely more interesting literature, though causal claims there remain contested too.
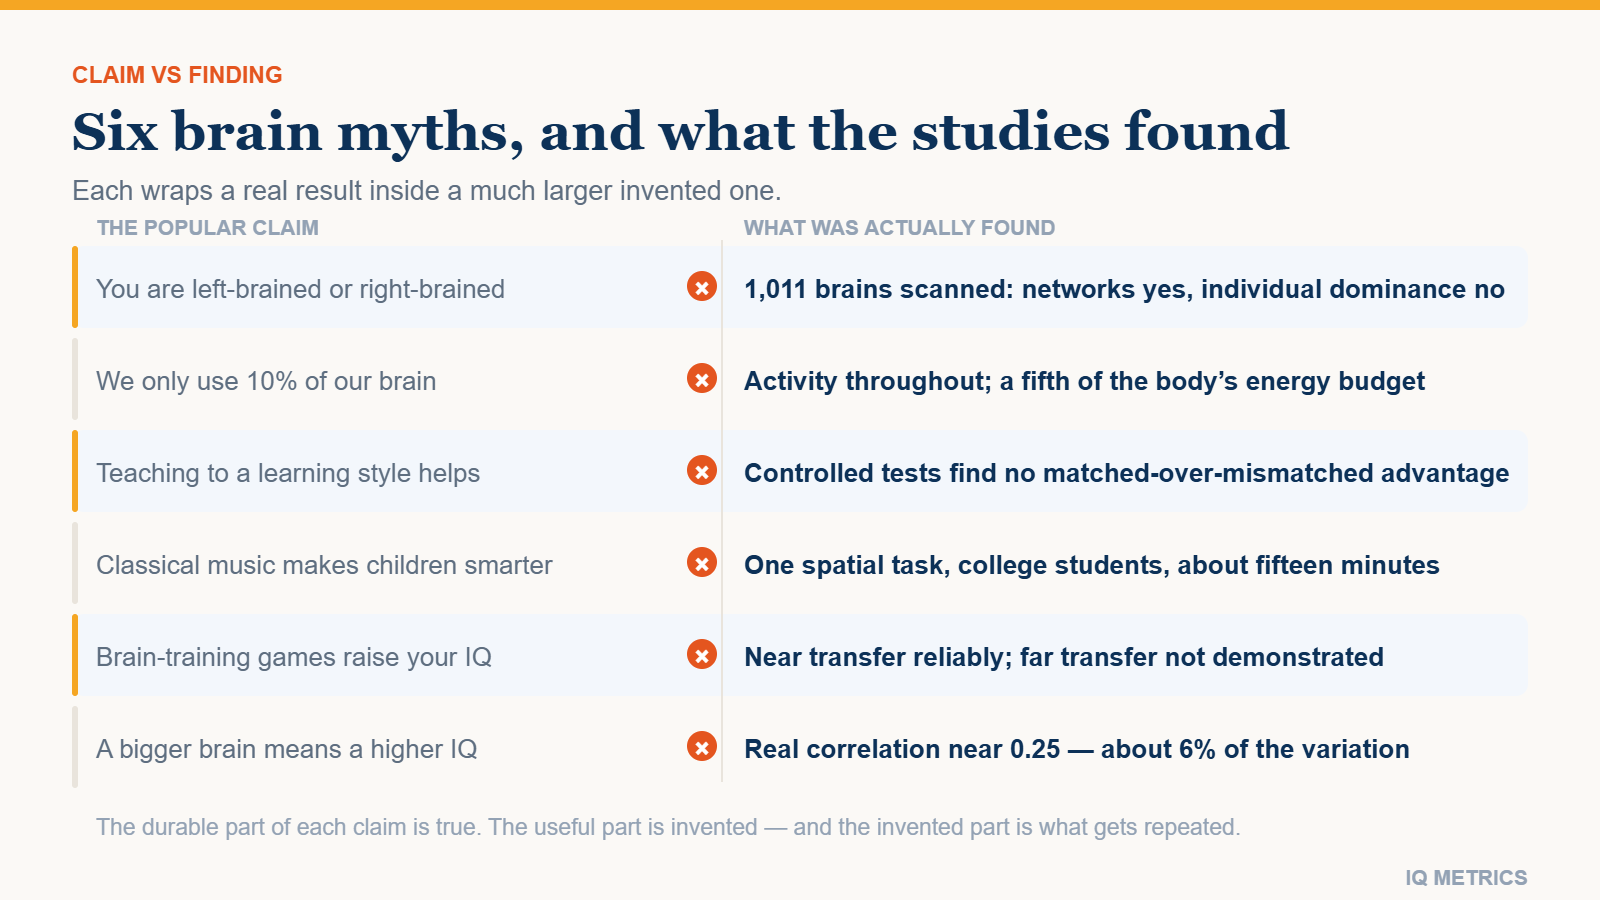
Chart contrasting six popular brain claims with what research found, showing the residual grain of truth in each: lateralisation without dominance, whole-brain activity, no meshing effect, no far transfer and a small brain size correlation
Your own number

Where would your own score land?

Take the IIF-certified assessment and get your score with the scale it was measured on, the percentile it corresponds to and the confidence range around it — the three figures most online tests leave out.

Find your IQ score now!

Secure & encryptedInstant results10–20 minutes

Myth 5: brain-training games raise your IQ

People who practise a brain-training task get better at that task. They also improve on tasks that closely resemble it. What large randomised trials have struggled to demonstrate is far transfer — improvement on unrelated reasoning that was never trained. Meta-analyses of working-memory training find reliable near transfer and little to no far transfer.

The largest single test of the claim recruited more than eleven thousand participants through a television-linked online trial and trained them on reasoning, memory and attention tasks over six weeks. Trained tasks improved. Untrained cognitive tasks did not improve more in the training groups than in the control group. Subsequent trials have complicated the picture in places, particularly for older adults and for specific working-memory paradigms, but no result has established the broad transfer the products advertise.

What is true: scores do move, and the honest account of why is unglamorous. Familiarity with format, reduced anxiety and better strategy are real gains that show up as points without a change in underlying ability. That distinction is the whole subject of whether you can improve your IQ, and it is why a second sitting of the same test is not independent evidence.

Myth 6: a bigger brain means a higher IQ

Unlike the others, this one starts from a real correlation. Meta-analyses of in-vivo imaging put the relationship between total brain volume and IQ score at roughly 0.24 to 0.30 in adults. It is a genuine, replicated finding.

It is also nearly useless about an individual. A correlation of 0.25 accounts for around six per cent of the variance, which means brain volume tells you almost nothing about any particular person’s score. Organisation, connectivity and cortical thickness carry more signal than gross volume, and between-species and between-sex comparisons break the pattern entirely.

The historical record here is a warning rather than a curiosity. Nineteenth-century craniometry measured skulls with real instruments and real arithmetic, and produced conclusions that tracked the prejudices of the measurers rather than the tissue. The methods were not the problem; the willingness to read a small, noisy correlation as a verdict about groups was. That failure mode has not gone away, which is part of why the history of intelligence testing is worth knowing before quoting any number about brains.

Why these particular myths survive

Three features keep them alive, and recognising the pattern is more useful than memorising the list.

  • Each contains a true kernel, so a correction that denies the whole claim sounds wrong to anyone who knows the kernel.
  • Each offers an identity or a shortcut. Being a right-brained visual learner explains something about you and asks nothing of you.
  • Each is unfalsifiable in daily life. Nothing that happens this week will disconfirm the ten per cent claim.

Checking a brain claim in ninety seconds

You do not need a neuroscience background to filter most of this. Four questions catch the large majority of bad claims.

  • Does it describe a type of person? Brains vary continuously. Claims that sort people into two or four kinds are almost always folk taxonomy wearing a lab coat.
  • What was the outcome measure? “Improved brain function” is not one. A named task with a published score is.
  • Was there a control group doing something equally engaging? Most training and music effects vanish against an active control rather than a do-nothing one.
  • How large is the effect, in the units you care about? A real but tiny correlation is the commonest way a true finding becomes a false headline.

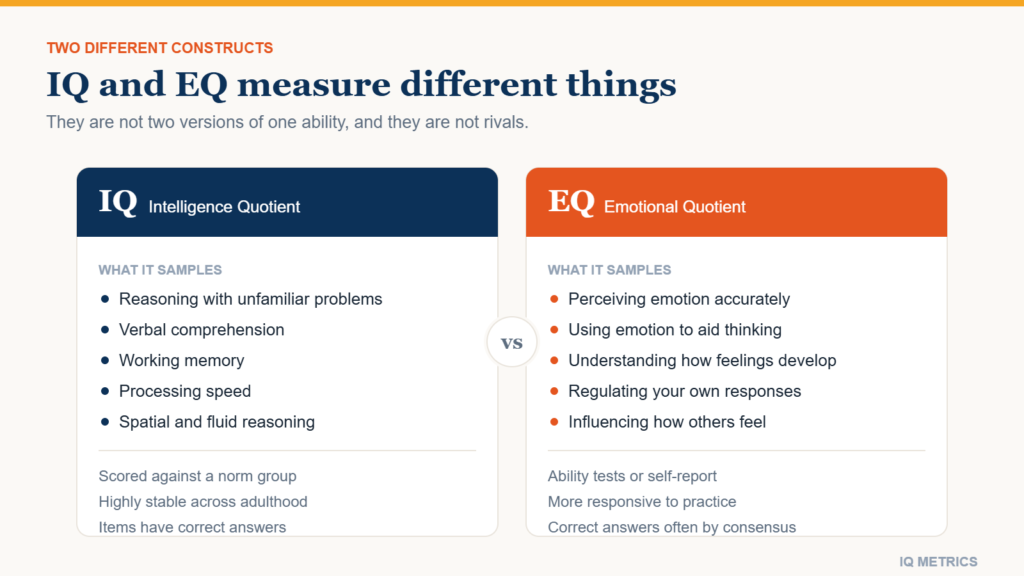
The same three features explain why the popular picture of intelligence drifts so far from the measured one — and why the gap between IQ and emotional intelligence as marketed and as measured is so wide. If you want to see what a test actually samples rather than what folklore says it does, the IQ tests hub sets out each reasoning domain and what it is built to capture.

Share this article

Know someone who keeps seeing these numbers quoted without the scale they were measured on? Send it to them.

ADHD, Autism and Dyslexia in IQ Testing

Taking a Test

How ADHD, Autism and Dyslexia Change What an IQ Test Measures

A test score is a measurement, and a measurement can be biased by the conditions under which it is taken. ADHD, autism and dyslexia each depress performance on particular kinds of item without lowering the reasoning underneath. Here is what actually interferes, condition by condition, and what to do next.

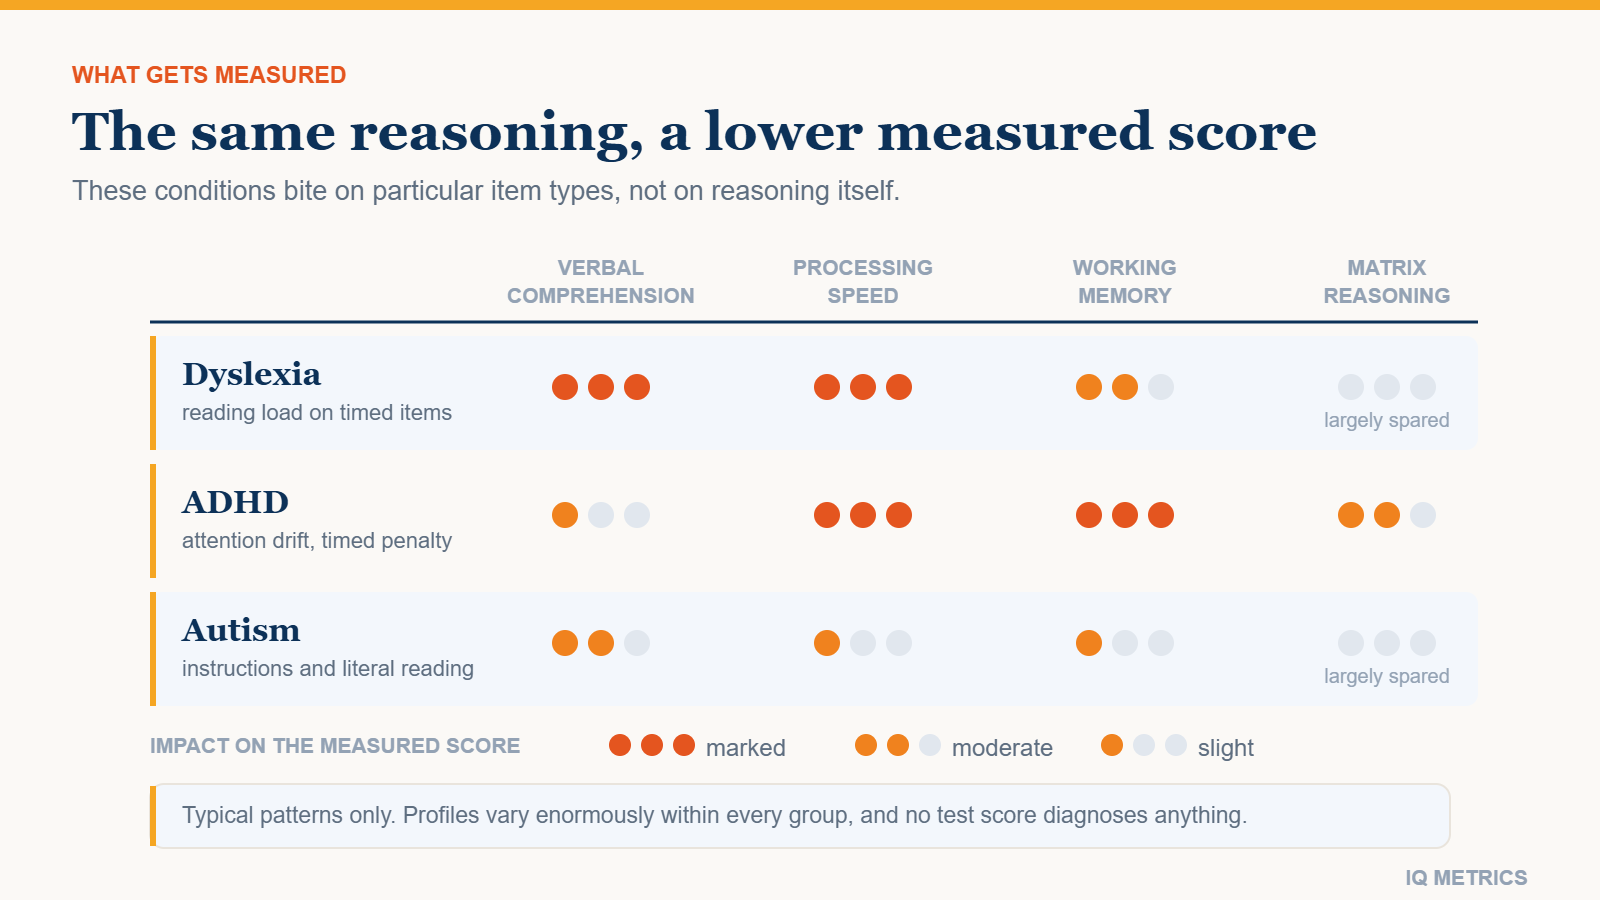
Grid rating how far dyslexia, ADHD and autism affect four IQ test domains: verbal comprehension, processing speed, working memory and matrix reasoning, which is largely spared

If you have ADHD, autism or dyslexia, a score from a timed online test is not meaningless, but for many people it reads lower than their reasoning does. ADHD and IQ test scores interact through the format rather than through intelligence: attention, reading load and the clock all sit between your thinking and the number at the end. What follows names the mechanism for each condition, and what to do about it.

This site publishes tests and explains scores; it has no clinical standing, and nothing here is diagnosis or medical advice. No IQ score, and least of all an unproctored online one, can indicate or rule out ADHD, autism or dyslexia. A qualified assessor is the only route to that answer.

A Depressed Score Is Not a Lower Ability

Much of what is written about neurodevelopmental conditions and testing quietly folds two different claims into one. The first is that measured composites in these groups often come out lower than in comparison samples. For ADHD and dyslexia that is a reasonably consistent finding; for autism it depends heavily on which test was used and how the sample was recruited.

The second claim is that these groups reason less well. That does not follow from the first. A test score is a measurement, and any measurement can be distorted by the conditions under which it is taken. It is more precise to say the score is depressed than that the ability is lower.

A bathroom scale on a thick carpet reads wrong; the reading changed, the weight did not. Much of what these three conditions do to a test result is carpet.

Ordinary test-day variables work the same way; the same person can land several points apart across a fortnight. Our longer piece on the factors that affect IQ test results covers sleep, anxiety, caffeine and practice. The difference is that these three conditions are stable features of how you process information, not the state you turned up in.

Where the Interference Actually Lands

A modern battery is not one thing. It samples several fairly distinct abilities and averages them into a single composite, and interference rarely hits all of them equally. It lands hard on one or two, and the composite carries the damage without saying so.

  • Verbal comprehension – vocabulary, similarities, general knowledge; all of it delivered in written language.
  • Fluid reasoning – matrices and number series, the part closest to raw pattern-finding.
  • Working memory – holding material in mind and manipulating it while you use it.
  • Processing speed – how quickly you get through easy items, not how hard the items are.
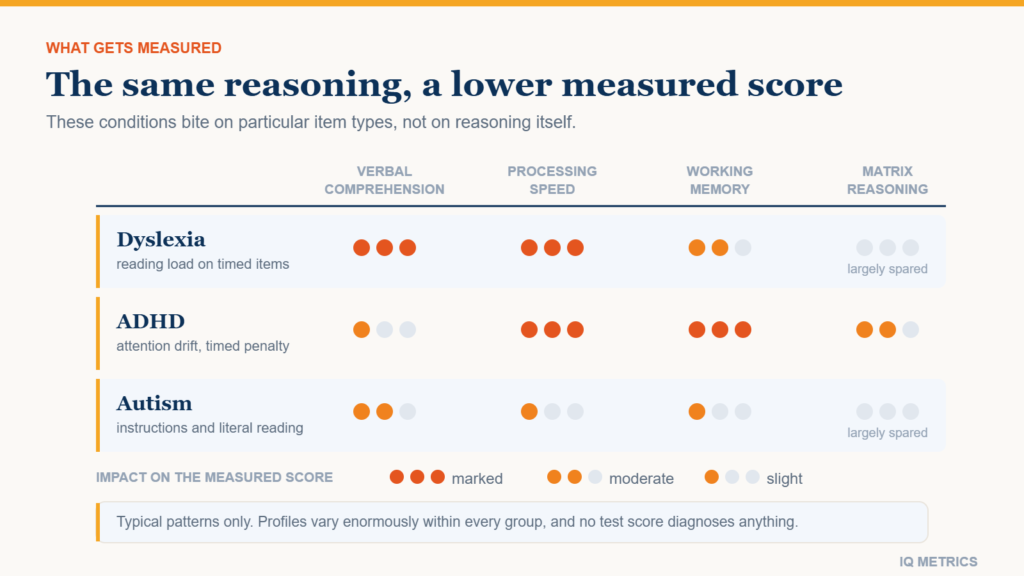
Grid rating how far dyslexia, ADHD and autism affect four IQ test domains: verbal comprehension, processing speed, working memory and matrix reasoning, which is largely spared

This is exactly why a profile beats a composite, and why the index-by-index breakdown produced by professionally administered tests is worth far more to a reader in this position than the headline figure.

Dyslexia: The Reading Load Hidden Inside the Test

Dyslexia is a difficulty with accurate or fluent word recognition, decoding and spelling, neurobiological in origin and not explained by a lack of instruction. On a test it lands in two predictable places. Verbal comprehension items have to be read, and so do the instructions and the answer options.

Processing-speed items are trivially easy in content and hard to finish. On a professional battery they use symbols rather than words, and are still often lower in dyslexic profiles because naming things quickly is part of what they measure. On an online test the speeded items are usually words and sentences, which puts the reading load back on top of the clock.

Fluid reasoning typically holds. A dyslexic reader who grinds through a vocabulary section will often complete matrix items at roughly the level the rest of their profile predicts, because a matrix does not have to be read. The composite then averages one fair estimate with one depressed estimate and understates the reasoning.

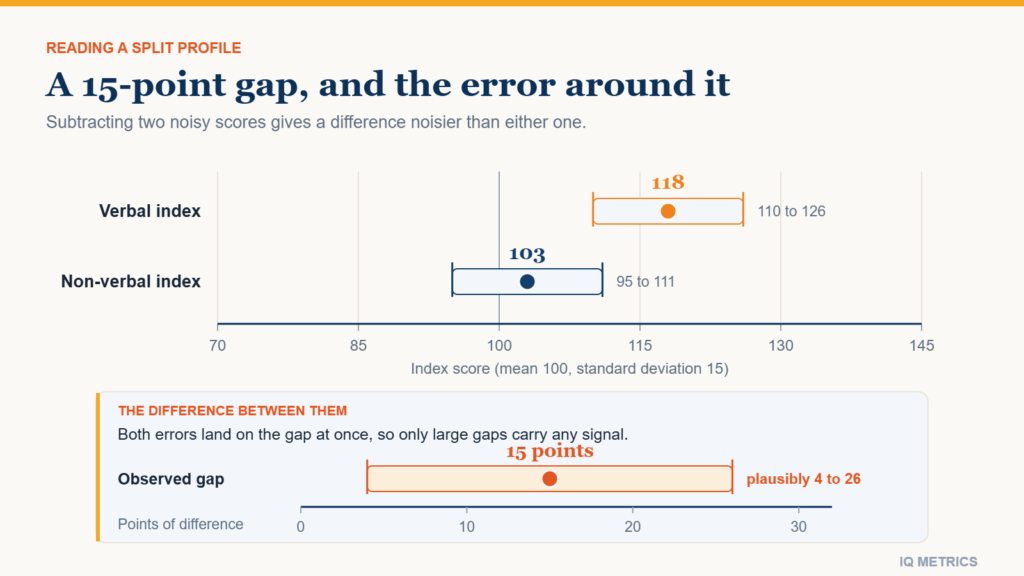
How large that gap gets varies from person to person, and a gap is not automatically meaningful on its own. The companion piece on verbal and non-verbal score splits covers when a difference between two indexes is big enough to interpret at all.

ADHD and IQ Test Scores: Inconsistency, Not a Lower Ceiling

The characteristic pattern for ADHD on a test is not uniformly weaker performance. It is variability. The same person can solve a hard matrix item in seconds and then miss three easy ones in the block that follows, and where in the session an item fell can matter more than how hard it was.

Three separate things cost points here, and they are worth keeping apart because they respond to different fixes.

  • Time pressure. A per-item or whole-test clock converts a slow start into lost items, even when the reasoning would have arrived a few seconds later.
  • Sustained-attention drift. Dozens of near-identical matrix puzzles in a row is close to a worst case: low novelty, no feedback, and wrong answers that feel exactly like right ones.
  • Working-memory load. Items that require holding several constraints at once are harder to finish when the holding itself takes effort.

That last one is worth holding apart from reasoning itself: the two are related but not interchangeable, and someone can have a genuinely low working-memory index and strong fluid reasoning at the same time. An item that loads both is limited by the weaker of the two.

Sleep and time of day move ADHD test performance, and so can where someone is in their usual routine on the day. That is another reason to treat one sitting as a single sample rather than a verdict, and to be sceptical of any score taken at the end of a long day.

Your own number

Where would your own score land?

Take the IIF-certified assessment and get your score with the scale it was measured on, the percentile it corresponds to and the confidence range around it — the three figures most online tests leave out.

Find your IQ score now!

Secure & encryptedInstant results10–20 minutes

Autism: Uneven Profiles and Confounded Instructions

There is no autistic IQ profile. Autistic people cover the entire measured range, and the variation inside the group is far larger than any average difference between it and everyone else. Anything that describes one shape of profile as typical is describing a subset and calling it a population.

One pattern does show up often enough to be worth naming: a split between verbal and perceptual performance, running in either direction. Some autistic people score markedly higher on matrix reasoning than on verbal subtests, particularly where verbal items reward conventional usage; others show the reverse.

The larger measurement problem is often the wrapper rather than the item. Instructions written loosely can be read literally and answered correctly by their own logic. Asking which one does not belong has several defensible answers, and an item lost that way costs the same as an item nobody could solve. The score cannot tell the two apart.

Conditions matter too. An unfamiliar room, harsh lighting, the social weight of being watched while you think: none of that is reasoning, and all of it can move a number.

What an Online Screener Does to These Profiles

An unproctored online test has no way to accommodate anyone. It cannot verify a diagnosis, grant extra time, offer a quiet room, read an item aloud, or notice that you stopped concentrating twenty minutes ago. It records what happened and scores it.

Format still changes the size of the problem. A timed IQ test stacks the effects above into their worst configuration: a speed penalty, no way back from a slow opening, and a hard stop that arrives whether or not you were nearly there.

If the clock is your main obstacle, the untimed classical format is a fairer instrument for you. If reading load is the obstacle, a culture-fair test built from figures rather than sentences takes most of the language out from between you and the item. Neither is a formal accommodation; each just removes one confound.

Accommodations, and Who Can Authorise Them

Formal assessment does have answers to all of this, and they are unglamorous rather than clever.

  • Extended time, commonly one and a half times the standard limit, sometimes double.
  • Scheduled breaks between subtests, or the session split across more than one day.
  • A separate quiet room, with the examiner present and nobody else.
  • Untimed administration of subtests where speed is not the ability being measured, reported alongside the standard scoring rather than in place of it.
  • Items read aloud, or answers given orally rather than written.

None of that is self-service, which is the practical point most articles skip. Accommodations are authorised by whoever owns the assessment: a qualified psychologist for a clinical evaluation, a school’s special educational needs process for a child being tested, a university disability service, or an employer’s occupational-health route at work. Each normally wants documentation first, which is one more reason a screener result cannot start the process.

If You Think Your Score Is an Underestimate

Start by treating the number as information about a sitting rather than about you. Which sections felt bad, and why? Running out of clock, losing the thread halfway through a block, and reading the same sentence four times are three different failures, each pointing at a different index dragging the composite down.

Then take the test again in a format that removes the thing you identified, and compare. Two scores with a known difference between the conditions that produced them tell you more than one score of any size, and that comparison is the closest thing to self-accommodation a free screener can offer.

If a defensible number actually matters — for a school placement, an accommodation request, an assessment — an online result will not do that job. What a free online IQ test gives you is a rough bearing and, taken twice under deliberately different conditions, a sense of how much of your score is about the format rather than your reasoning.

Share this article

Know someone who keeps seeing these numbers quoted without the scale they were measured on? Send it to them.

Test Anxiety and IQ Scores

Mind & Everyday Life

How Many IQ Points Does Test Anxiety Actually Cost?

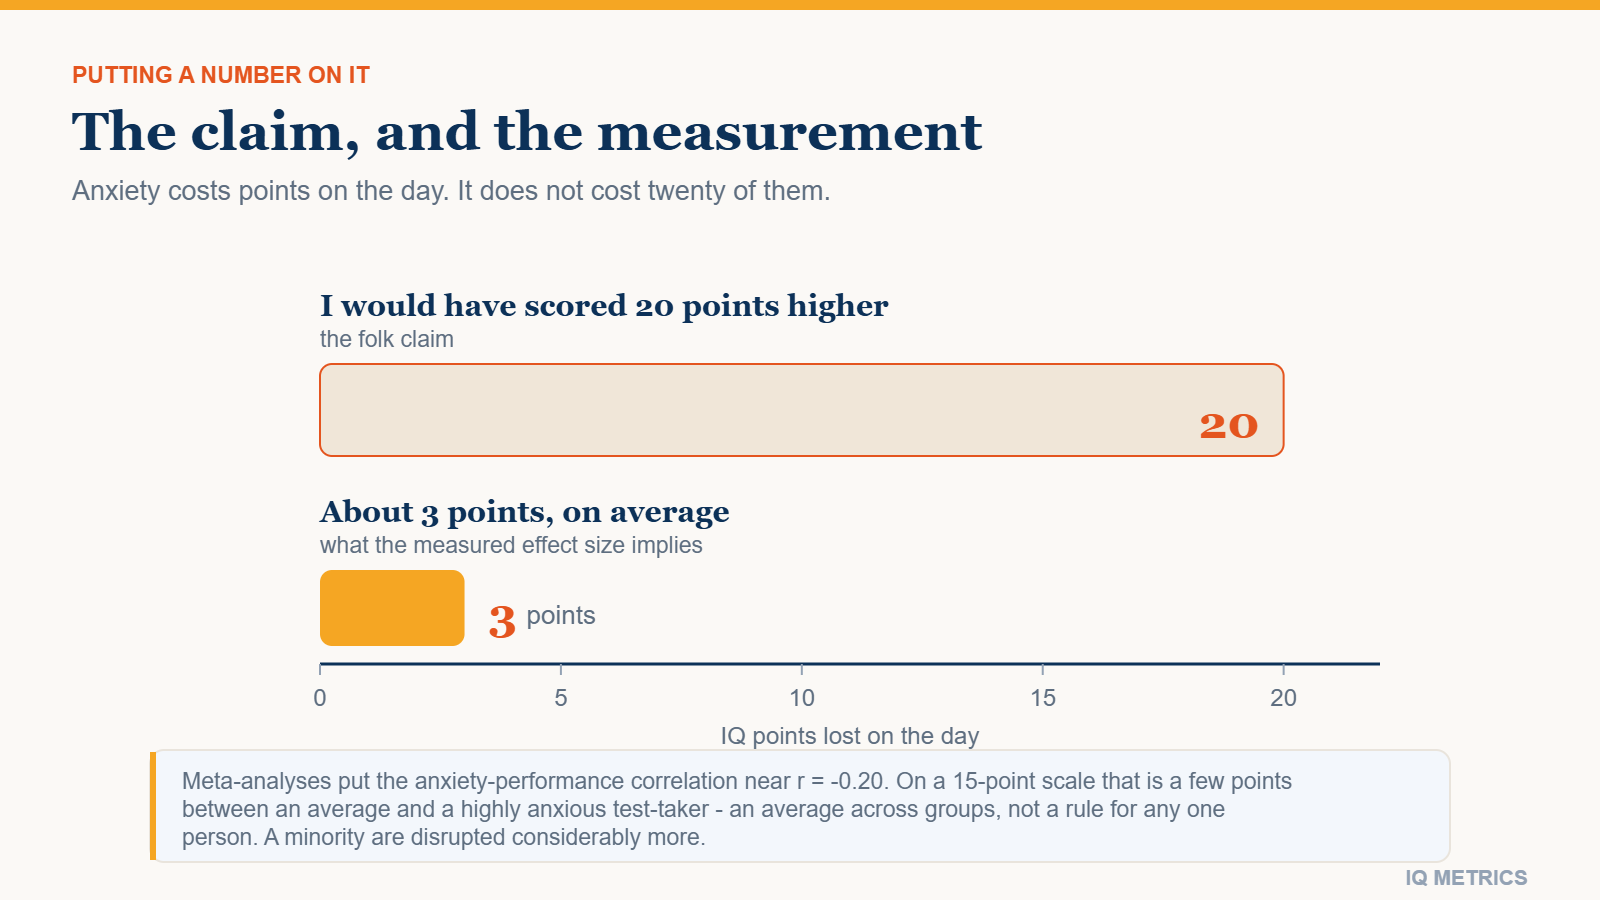
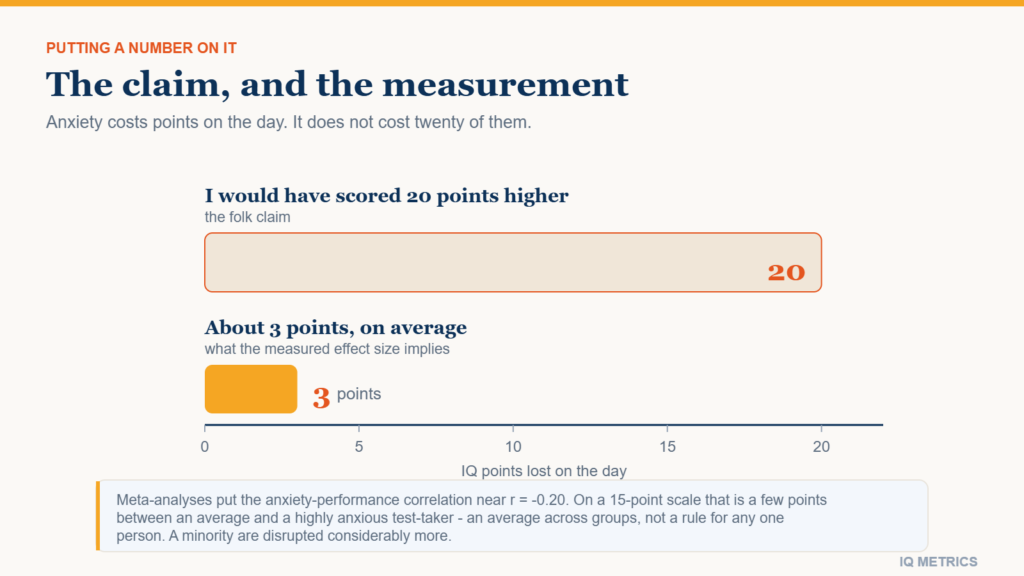
Almost everyone who has had a disappointing result has wondered whether nerves cost them fifteen or twenty points. The evidence says no. Test anxiety and cognitive performance correlate at roughly r = -0.20, which works out to a few points on a 15-point scale. Here is the number, and what it changes.

Bar chart comparing the twenty-point loss people claim test anxiety costs with the roughly three points the measured effect size implies

Can anxiety lower your IQ score? Yes — but not by anything close to the margin most people assume. Studies that measure test anxiety alongside cognitive test performance find a relationship of roughly r = -0.20, which translates to something on the order of three points on the familiar 15-point scale. That is a few points between an average test-taker and a highly anxious one, not fifteen and not twenty. The rest of this article shows where that figure comes from, why the effect is small but genuinely real, and what it should change about how you read your own result.

Where the fifteen-point claim comes from

Nearly everyone who has sat a supervised test has said some version of it: I would have scored fifteen or twenty points higher if I had not been so nervous. The thought is appealing because it explains away a disappointing number without asking anything of the person who got it.

The problem is scale. Fifteen points is a full standard deviation — the distance between the middle of the distribution and the edge of roughly the top sixteen percent of test-takers. Ordinary pre-test nerves do not move a person that far. Nothing in the measured relationship between test anxiety and test performance is anywhere near large enough to produce a shift of that size.

What the evidence does support is a smaller, stubborn, fairly consistent drag. Small effects are still real effects. They are just not the ones that rewrite a life story.

What the research actually finds

Meta-analyses pooling many studies of test anxiety and performance on cognitive and academic tests tend to land on a correlation in the region of r = -0.20. Much of that literature is built on school and university assessments rather than on standardised intelligence tests, so carrying the figure across to IQ points is a reasonable estimate rather than a direct measurement. Estimates range roughly from -0.15 to -0.25, and much of that spread is not noise: it moves with who was sampled, how anxiety was measured, and how much the test genuinely mattered to the person sitting it.

Bar chart comparing the twenty-point loss people claim test anxiety costs with the roughly three points the measured effect size implies

Three things push the estimate around, and they are worth knowing before you take any single figure too seriously:

  • How anxiety was measured. Questionnaires filled in after the test pick up disappointment as well as anxiety. Physiological measures of arousal track performance more weakly than self-reported worry does, so the method chosen moves the estimate before any real difference does.
  • How high the stakes were. A university entrance exam tends to generate more anxiety, and a larger measured effect, than a practice test taken at home out of curiosity.
  • Who was in the sample. Student samples dominate this literature, and students are not a random slice of the population, which limits how far any one estimate travels.

A correlation of -0.20 means anxiety is associated with something like four percent of the variation in scores across a group. The other ninety-six percent of the differences between people sits somewhere else entirely. That is the frame to hold before anyone converts anything into points.

Turning that correlation into IQ points

Correlations are hard to feel; points are easy. So here is the translation, with the reasoning shown, precisely so you can see how approximate it is.

Most IQ scales are built with a standard deviation of 15 points. If anxiety and score are related at about -0.20, a person one standard deviation above average in test anxiety is expected to score roughly 0.20 × 15, or about 3 points, below a person of average anxiety. Nothing in that figure is held constant: it is a raw association, not an isolated effect of anxiety. Push it to two standard deviations above the mean in test anxiety, which is uncommon, and the expected gap is around six points — though the linear assumption behind that extrapolation is doing a lot of work out at the tail.

So the honest headline is a few points, not twenty. Every word there is doing work. It is an average across groups, not a prediction about any one person, and it applies to people whose anxiety slows them down rather than stopping them. For the minority who freeze or leave a test unfinished, the loss can be far larger, because what they end up with is not a measure of their ability at all.

Your own number

Where would your own score land?

Take the IIF-certified assessment and get your score with the scale it was measured on, the percentile it corresponds to and the confidence range around it — the three figures most online tests leave out.

Find your IQ score now!

Secure & encryptedInstant results10–20 minutes

Why the cost is real but small

The best-supported explanation is crowding. Working memory — the small, temporary workspace where you hold a matrix pattern, a half-finished sequence, or the three candidate answers you are weighing against each other — has a hard capacity limit. Worry is not silent: it occupies that same workspace with self-monitoring, clock-watching and a running commentary on how badly things are going.

That account makes a prediction that can be checked, and it broadly holds up. The cost concentrates on items that load working memory heavily and on tests run against a clock, which is one reason a timed IQ test is likelier to expose anxiety than an untimed one. On easy items, or when you can take as long as you like, there is spare capacity to absorb the interference.

This is the same mechanism driven by a different stressor as the one behind sleep loss and test performance. Fatigue and worry both draw down the same limited resource, and both produce modest average losses concentrated in the same kinds of items. Read that piece as the companion to this one.

There is a trait side to all of this too — some people are dispositionally more anxious, and that disposition travels with a cluster of habits around testing. Rather than re-derive it here, see how personality relates to measured ability.

Anxious test-takers also behave differently

The raw observed gap between anxious and non-anxious test-takers is not purely anxiety pressing on cognition in the moment. Anxious people also do different things, and those things land in the score just as surely.

  • They prepare differently. Avoidance is a normal anxiety response, so some anxious test-takers do less familiarisation rather than more, and arrive facing a format they have never seen.
  • They start slower. Time spent re-reading the instructions and second-guessing item one is time not spent on items twelve through twenty.
  • They abandon hard items sooner. Giving up early is a behaviour, not a capacity limit — but on a scored test it looks identical to being unable to solve the item.
  • They are likelier to quit part-way. A test abandoned halfway does not measure ability. It measures how long the person stayed.

Each of those routes lowers a score without anxiety having interfered with reasoning directly. Which means some share of that already-modest -0.20 is behaviour rather than anxiety acting on reasoning in the moment, so the direct cognitive cost is probably smaller still. How much smaller is not something a correlation on its own can tell you.

That is better news than it sounds. Behaviour is a great deal easier to change than temperament, and the routes above are the ones a second, better-organised sitting can actually close.

What a few points should and should not change

An expected loss of around three points is a reason to consider retesting. It is not a reason to discard the result you have. If your score landed near a boundary you care about and the sitting was a genuinely rattled one, that is a legitimate argument for a second attempt.

It is worth being specific about what near a boundary means. A three-point expectation matters if your result sits a handful of points from a threshold you are using for something; it matters very little if you are twenty points away, because a calmer sitting is not going to carry you across a gap that size.

Go in knowing what a retest actually buys. Scores tend to rise on repeat testing for reasons that have nothing to do with your nerves improving: the practice effect on cognitive ability tests is well documented, so a higher second score is partly familiarity with the format and, if the first sitting was unusually low for you, partly ordinary regression toward your own average — and only partly a calmer state of mind.

It also helps to know how much any single sitting can move for perfectly mundane reasons. The guide to IQ test accuracy covers the measurement error surrounding one score. Anxiety is one contributor sitting inside a band that is wider than most people expect, and this article is only quantifying that one contributor.

What actually helps before a test

The interventions with the strongest support are unglamorous: familiarise yourself with the format, and practise under conditions that are genuinely timed. Both work for the same reason — they strip out the novelty and the surprise of time pressure that generate the anxiety in the first place, rather than trying to manage the feeling once it has already arrived.

In practice that means a full-length run with the clock genuinely running rather than a relaxed browse through sample items. The preparation guide and the walkthrough of how a test is structured cover those mechanics, so this piece will not repeat them.

None of this makes anxiety trivial. It makes it tractable. If you suspect nerves cost you something last time, the useful next step is a second run under conditions you control, with the clock running honestly. Take the IQ test that way and compare the two results, holding in mind that a few points of movement in either direction is exactly what the evidence predicts.

Share this article

Know someone who keeps seeing these numbers quoted without the scale they were measured on? Send it to them.