





What Does an IQ of 85 Mean? The Low Average Band
A score of 85 sits exactly one standard deviation below the population mean, at roughly the 16th percentile. It is the bottom edge of what test manuals call low average, it is well clear of any clinical threshold, and on its own it says considerably less about a person than the number appears to.

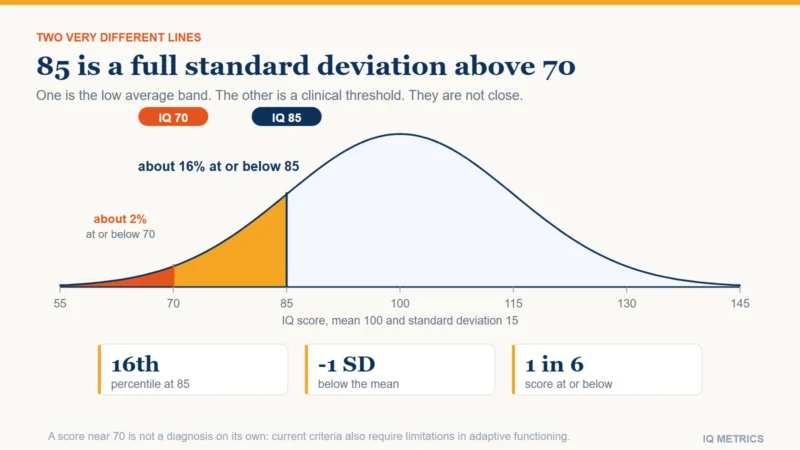
A score of 85 is one standard deviation below the population mean. On a test scaled to a mean of 100 and a standard deviation of 15, that places it at roughly the 16th percentile: about 16 people in every hundred score at or below it, and about 84 score above.
Test manuals call that band low average or below average, depending on the publisher. It is not a clinical category, it is not close to the threshold used for intellectual disability, and the distance between those two facts is the thing most people arrive here needing.
Where 85 sits, and how many people are there
IQ scores describe position, not quantity. A test is normed on a large representative sample; the middle of that sample is called 100 and one standard deviation is called 15 points. Everything after that is arithmetic on a normal curve.
- About 16 percent of the reference population scores at or below 85.
- That is roughly one person in six — four or five children in an average class of thirty.
- The band from 80 to 89 is one of the most populated stretches of the whole scale.
The scale is symmetric, so 85 is exactly as far below the mean as 115 is above it, and about as common. The IQ percentile calculator will place any score against the same curve, and the IQ level chart shows the bands side by side.
85 is not the disability threshold, and the gap is large
This is the most common and most consequential confusion about a score in this range.
The diagnostic threshold associated with intellectual disability is approximately 70, two standard deviations below the mean, at about the 2nd percentile. Eighty-five is a full standard deviation clear of it. In percentile terms the difference is between roughly 16 percent of the population and roughly 2 percent — the two describe entirely different groups.
And the score alone does not carry the diagnosis in any case. Current criteria require significant limitations in adaptive functioning — conceptual, social and practical skills in daily life — alongside the cognitive finding, with onset in the developmental period. A number on its own is not sufficient, by design, precisely because a number on its own has been misused historically.
The label depends on the manual, and none of them is a verdict
There is no shared official vocabulary for score bands, and the names have changed as publishers have moved away from language that read as a judgment about people.
- Current Wechsler editions print this range as Low Average, and the most recent revisions have moved further towards purely descriptive labels.
- Stanford-Binet uses Low Average as well.
- Older manuals from the early twentieth century used clinical terms that are now considered slurs, which is exactly why the vocabulary was replaced.
If a chart you have found online attaches an adjective harsher than "low average" to 85, it is not reporting a test manual. IQ classifications compares what the actual publishers print.
A full-scale 85 can hide a very uneven profile
The headline number is a composite. Underneath it sit index scores — typically verbal comprehension, perceptual or fluid reasoning, working memory and processing speed — and they do not have to agree with each other.
A full-scale 85 can be four flat indices near 85. It can equally be a verbal comprehension of 100 dragged down by a processing speed of 70. Those two profiles describe different people, suggest different support, and produce the same headline. Where the spread between indices is large, many clinicians treat the full-scale score as uninterpretable and read the indices instead.
This matters especially where a specific learning difficulty or an attention condition is in the picture, because those tend to depress particular indices rather than the whole profile. ADHD, autism, dyslexia and IQ test scores covers the characteristic patterns, and how to read an IQ test report shows where the scatter is printed.
Where would your own score land?
Take the IIF-certified assessment and get your score with the scale it was measured on, the percentile it corresponds to and the confidence range around it — the three figures most online tests leave out.
Find your IQ score now! →The error bar, and what it does and does not overlap
A professional full-scale score carries a 95 percent confidence interval of roughly plus or minus 4 to 5 points, so a measured 85 means "the true score is very probably between 80 and 90". Online tests are wider, sometimes much wider.
Two things follow. First, 85 and 97 really are different results: their intervals do not overlap, so the test has genuinely distinguished them. Second, 85 and 88 have not been distinguished, and neither have 82 and 85. Small differences within the band are noise. The margin of error explained has the arithmetic.
What moves a score in this range, and what does not
Scores at the lower end are more sensitive to test conditions than scores in the middle, because unfamiliarity with testing costs more when the material is already hard.
- Conditions on the day. Anxiety, poor sleep, an unfamiliar interface and time pressure all pull results down. See test anxiety and IQ scores.
- Language and cultural distance from the norm sample. A verbal test administered in a second language measures the language as much as the reasoning. Cultural bias in IQ tests is about what that does to items, and stereotype threat about what the situation itself does.
- Genuine environmental exposures. Childhood lead exposure is the best-established of these, with the steepest losses at the lowest doses. See lead exposure and IQ and nutrition and IQ, which is careful about the difference between correcting a deficiency and supplementing an adequate diet.
- Format familiarity. A second sitting reliably scores higher, mostly through the practice effect, which is about knowing the format rather than about ability.
What does not move it: brain-training apps, which improve performance on the trained task and transfer poorly to anything else. Can you improve your IQ separates the claims that survive scrutiny from the ones that do not.
When a low score is a measurement problem, not a finding
Before a score in this band is taken at face value, it is worth asking whether the test measured what it was supposed to. A depressed result can be a property of the administration rather than of the person, and there are recognisable signs.
- The test was in a second language. Verbal subtests then measure vocabulary in that language, and the full-scale score drops accordingly. Non-verbal and culture-fair instruments exist for exactly this case; the IQ tests hub sets out which measures which.
- An untreated sensory or attention difficulty. Uncorrected hearing or vision, or an unmanaged attention condition, depresses timed subtests first and the composite after.
- The sitting itself went badly. Illness, exhaustion, or a rushed unsupervised online attempt produce scores that are not reproducible on a better day.
- The test had no published norms. A number with no norm table behind it is not a percentile, whatever the results page called it.
A professional assessment reports on validity explicitly and will say when a score should not be interpreted. A short online test cannot, which is the main reason the two are not interchangeable. IQ test accuracy sets out what separates them.
What an 85 is actually useful for
Very little as a headline, quite a lot as a starting point. The legitimate uses of a score in this band are practical and specific: establishing eligibility for accommodations, identifying which index is out of line with the others, and giving a baseline that a later assessment can be compared against.
What it is not useful for is prediction about one person. Ability scores correlate with school attainment at around 0.5, which leaves about three quarters of the variation to everything else, and at the level of an individual that residual is the whole story. There is no occupation or qualification that an 85 rules out, and the range of adult outcomes within any narrow band of scores is wide and heavily overlapping.
If the number came from a short online test, treat it as a rough estimate with a wide interval and check it against what to look for before trusting an online score. If it came from a full professional assessment, the report contains far more usable information than its first page, and the indices are where to look.
Keep reading
All articles →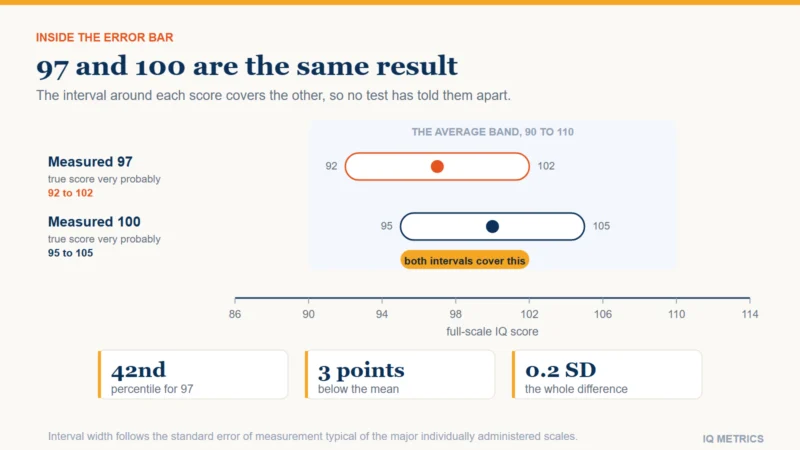 Scores & Scales
Is 97 IQ Dumb?
A score of 97 is average. It sits three points below the population mean, which is well inside the margin of error of any test that produced it, so 97 and 100 are the same result in every way that can be measured. The interesting question is not what 97 says about you, but how little any single number can say.
 Scores & Scales
IQ Level Chart
A systematic way to measure intelligence is the IQ level chart, which uses a scale that goes from below average to above average. Assessments of cognitive capacity and academic accomplishment often employ this visual aid.
 Scores & Scales
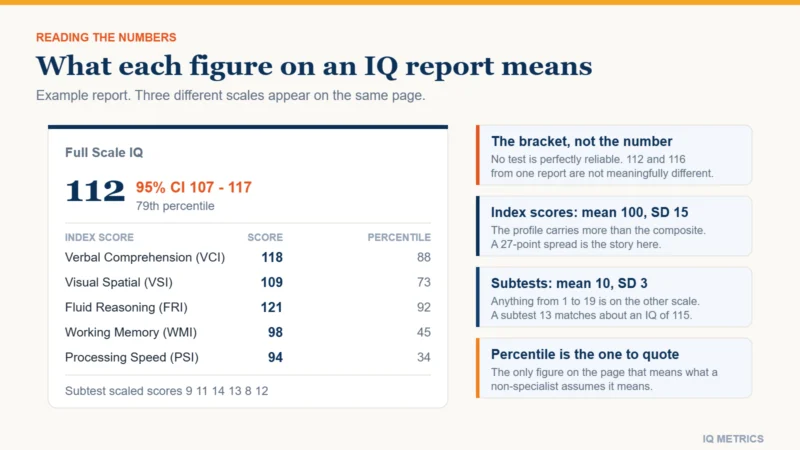
How to Read an IQ Test Report
An IQ report puts numbers on at least three different scales and almost never explains which of them matters. Here is what FSIQ, the index scores, the subtest scaled scores, the percentile rank and that bracketed range each mean, and when the headline number should not be read at all.