
How much of the brain have we mapped? 21 connectomes, 1986 to 2026
We read every published wiring diagram of a nervous system we could find, 21 of them, and counted the neurons, the synapses and the teams, to see how far the fruit fly, mouse and human have come.

By Leon Falkner, Data & Research Analyst · Reviewed by Aarav Vardhan, Editor-in-Chief · Published 5 November 2026 · 14 min read
About this study
- Report type
- Data study from papers and open data releases
- Data
- 21 connectome reconstructions from 20 papers; brain sizes from published counts
- Compared with
- The neurons in a mouse brain (67.9 million) and a human brain (86.1 billion), and the Wellcome Trust's 2023 estimates for a mouse connectome
- Years
- Papers 1986 to 2026; as of 5 November 2026
- Licence
- CC BY 4.0 (our dataset and charts)
- Version
- 2026.11
- Sources
- 27
We have mapped every neuron of animals up to the fruit fly (166,700 neurons), but only about 0.12% of a mouse brain and 0.00002% of a human brain. Our ledger holds 21 reconstructions from 20 papers, 1986-2026; the largest mouse block has 82,247 neurons, the largest human block about 16,000. IQ Metrics Research, as of 5 November 2026.
01 Key findings
- Whole nervous systems are mapped only for small animals. The roundworm (302 neurons), sea squirt larva (177), fruit fly larva (3,013) and adult fruit fly (166,700 in the male CNS) are complete.White 1986; Ryan 2016; Winding 2023; Berg 2026
- Mammals are mapped in blocks of one cubic millimetre. The mouse block holds 82,247 detected neurons (0.12% of a mouse brain), the human block about 16,000 (0.00002% of a human brain).MICrONS 2025; Shapson-Coe 2024; IQ Metrics calculation
- The record has grown about 4.8-fold per decade since 1986, and about 63-fold since 2013. Continuing that line would reach a mouse brain around 2040 to 2070; it is arithmetic, not a forecast.IQ Metrics calculation
- The Wellcome Trust puts a whole mouse connectome at $7.5-21 billion and a decade off, with about 100,000 person-years of proofreading at today’s tools, against 33 for the fly brain.Wellcome Trust 2023; Dorkenwald 2024
- Data, not microscopes, is the wall. The 1 mm3 human block is 1.4 petabytes; a whole human brain imaged the same way would be about 2.1 zettabytes.Shapson-Coe 2024; IQ Metrics calculation
- Teams grew with the maps. The 1986 roundworm paper had 4 authors; FlyWire has 293 and the mouse block 96. Neurons, synapses and authors correlate at r = 0.84 to 0.96.OpenAlex; IQ Metrics calculation
02 Statistics to quote
neurons in the largest peer-reviewed connectome: the whole central nervous system of a male fruit fly (Berg et al., Cell, 2026).
Berg 2026of a mouse brain’s neurons sit in the largest mouse map (82,247 detected in a 1 mm3 block against 67.9 million).
MICrONS 2025; IQ Metrics calculationneurons of a human brain are in the largest human map (about 16,000 of 86.1 billion, a 1 mm3 block).
Shapson-Coe 2024; Azevedo 2009; IQ Metrics calculationsynapse-level reconstructions in our ledger, from 20 papers, 1986 to 2026; 20 of them from 2013 or later.
IQ Metrics ledgergrowth in the record neuron count per decade, a log-linear fit through the 5 record-setting maps 1986-2026 (R-squared 0.77).
IQ Metrics calculationFlyWire-sized maps (139,255 neurons) would make one mouse brain by neuron count; 618,000 would make a human brain.
Dorkenwald 2024; IQ Metrics calculationperson-years of manual proofreading for the FlyWire whole-brain connectome; the hemibrain needed 50 for part of a brain and the male CNS 44.
Dorkenwald 2024; Berg 2026Wellcome Trust’s 2023 estimate for one whole mouse connectome; timeline “probably still a decade off”, 10 to 15 years.
Wellcome Trust 2023raw data for a whole human brain imaged like H01 (1.4 petabytes per mm3 x 1.5 million mm3): our arithmetic, not a plan.
Shapson-Coe 2024; Wellcome Trust 2023; IQ Metrics calculationauthors on the roundworm paper of 1986 against the fruit fly male CNS paper of 2026; the median across the ledger is 21.
OpenAlex; IQ Metrics calculationsynaptic clefts detected in the MICrONS mouse block, the most synapses in any map; the human block H01 has 133.7 million.
MICrONS 2025; Shapson-Coe 2024neurons and 544,000 synapses in the fruit fly larva brain, the first whole insect brain connectome (Winding et al., Science, 2023).
Winding 202303 How much of the brain have we mapped?
Scientists have mapped the whole nervous system of animals up to the fruit fly, 166,700 neurons, but only about 0.12% of a mouse brain and 0.00002% of a human brain [12] [21] [20]. A connectome is a wiring diagram: every neuron and every synapse between neurons, read from slices of tissue imaged with an electron microscope. We collected every published reconstruction of that kind we could read, 21 of them from 20 papers between 1986 and 2026, and wrote down for each one the number of neurons, the number of synapses, the tissue it covers, the microscope, the team and the data size.
The picture has two halves. Small animals are finished: the roundworm Caenorhabditis elegans has 302 neurons in the hermaphrodite and 385 in the male [2], a sea squirt larva 177 neurons in its central nervous system [4], and the fruit fly Drosophila melanogaster, with 139,255 neurons in the female brain [9] and 166,700 in the male brain and nerve cord together [12]. Mammals are not: the largest mouse and human maps each cover one cubic millimetre of cortex, about 1 in 1,500,000 of a human brain by volume [24].
From 302 neurons in 1986 to 166,700 in 2026: every connectome with a neuron count
Each dot is one reconstruction in our ledger that states how many neurons (or cells) it holds, by publication year; neuron counts on a log scale, each step ten times more. The highest dot is the male fruit fly central nervous system (166,700 neurons, 2026). The zebrafish whole-brain dot (176,810 cells) is a preprint and counts cells, not proofread neurons. As of 5 november 2026.
Neurons (or cells) in the reconstruction (log scale)
Publication year
Source: Our ledger of 21 reconstructions, each number read in its paper [13] [12] [2] [9] [14] [15] [21] [16] [11] [4] [7] [20] [17] [8] [5] [18] [1] [6] [3] [19]; plotted by IQ Metrics
Data table
| reconstruction | publication_year | neurons | group |
|---|---|---|---|
| C. elegans 1986 | 1986 | 302 | worm |
| Mouse retina | 2013 | 950 | mouse |
| Sea squirt larva | 2016 | 177 | other |
| C. elegans hermaphrodite 2019 | 2019 | 302 | worm |
| C. elegans male 2019 | 2019 | 385 | worm |
| Fly hemibrain | 2020 | 25000 | fly |
| C. elegans, 8 animals | 2021 | 204 | worm |
| Zebrafish 2022 | 2022 | 208 | zebrafish |
| Fly larva brain | 2023 | 3013 | fly |
| Fly brain (FlyWire) | 2024 | 139255 | fly |
| Human cortex (H01) | 2024 | 16000 | human |
| Fly nerve cord | 2024 | 23000 | fly |
| Zebrafish brainstem | 2024 | 3000 | zebrafish |
| Mouse cortex (MICrONS) | 2025 | 82247 | mouse |
| Fly optic lobe | 2025 | 53000 | fly |
| Marine worm larva | 2025 | 2675 | other |
| Zebrafish whole brain | 2025 | 176810 | zebrafish |
| Fly male CNS | 2026 | 166700 | fly |
Embed this chart
Paste this HTML into your page: it carries the numbers and the credit link to this figure.
The shape of the chart is a staircase with long flat treads. The roundworm map of 1986 [1] held the record for 27 years; the next record-setter in our ledger is a piece of mouse retina with 950 neurons in 2013 [14], then the fly hemibrain with about 25,000 in 2020 [7], FlyWire with 139,255 in 2024 and the male fly with 166,700 in 2026. Each step needed a new way of working, not just more of the old one: automated segmentation of the images, then crowds and professional teams to proofread it [9].
Forty years of wiring diagrams: the fruit fly took the lead in 2020
Every reconstruction in the ledger by publication year and animal. The roundworm map of 1986 stood alone for 27 years until the mouse retina (2013); two thirds of the entries (14 of 21) have appeared since 2020. As of 5 november 2026.
Source: Our ledger [13] [12] [2] [9] [14] [15] [21] [16] [11] [4] [7] [20] [17] [8] [5] [18] [1] [6] [3] [19]
Data table
| animal | type | from | to | label | detail |
|---|---|---|---|---|---|
| Roundworm | event | 1986 | C. elegans 1986: 302 neurons | C. elegans hermaphrodite (White et al.) (1986) | |
| Roundworm | event | 2019 | C. elegans hermaphrodite 2019: 302 neurons | C. elegans hermaphrodite (Cook et al.) (2019) | |
| Roundworm | event | 2019 | C. elegans male 2019: 385 neurons | C. elegans male (Cook et al.) (2019) | |
| Roundworm | event | 2021 | C. elegans, 8 animals: 204 cells | C. elegans, 8 animals birth to adult (Witvliet et al.) (2021) | |
| Larvae of other animals | event | 2016 | Sea squirt larva: 177 neurons | Ciona larva CNS (Ryan et al.) (2016) | |
| Larvae of other animals | event | 2025 | Marine worm larva: 2,675 cells | Platynereis larva, whole body (Veraszto et al.) (2025) | |
| Fruit fly | event | 2020 | Fly hemibrain: 25,000 neurons | Fruit fly hemibrain (Scheffer et al.) (2020) | |
| Fruit fly | event | 2023 | Fly larva brain: 3,013 neurons | Drosophila larva brain (Winding et al.) (2023) | |
| Fruit fly | event | 2024 | Fly brain (FlyWire): 139,255 neurons | Fruit fly whole brain, FlyWire (Dorkenwald et al.) (2024) | |
| Fruit fly | event | 2024 | Fly nerve cord: 23,000 neurons | Fruit fly male nerve cord (Takemura et al.) (2024) | |
| Fruit fly | event | 2025 | Fly brain + cord (BANC): no neuron count | Fruit fly brain + nerve cord, BANC (Bates et al.) (2025) | |
| Fruit fly | event | 2025 | Fly optic lobe: 53,000 neurons | Fruit fly optic lobe (Nern et al.) (2025) | |
| Fruit fly | event | 2026 | Fly male CNS: 166,700 neurons | Fruit fly male CNS (Berg et al.) (2026) | |
| Zebrafish larva | event | 2022 | Zebrafish 2022: 208 neurons | Larval zebrafish brain, 208 neurons (Svara et al.) (2022) | |
| Zebrafish larva | event | 2024 | Zebrafish brainstem: 3,000 neurons | Larval zebrafish brainstem (Vishwanathan et al.) (2024) | |
| Zebrafish larva | event | 2025 | Zebrafish whole brain: 176,810 cells | Larval zebrafish whole brain, Fish-X (Xie et al.) (2025) | |
| Mouse | event | 2013 | Mouse retina: 950 neurons | Mouse retina, inner plexiform layer (Helmstaedter et al.) (2013) | |
| Mouse | event | 2015 | Mouse cortex 2015: no neuron count | Mouse neocortex fragment (Kasthuri et al.) (2015) | |
| Mouse | event | 2019 | Mouse layer 4: no neuron count | Mouse barrel cortex, layer 4 (Motta et al.) (2019) | |
| Mouse | event | 2025 | Mouse cortex (MICrONS): 82,247 neurons | Mouse visual cortex, MICrONS (MICrONS Consortium) (2025) | |
| Human | event | 2024 | Human cortex (H01): 16,000 neurons | Human cortex fragment, H01 (Shapson-Coe et al.) (2024) |
Embed this chart
Paste this HTML into your page: it carries the numbers and the credit link to this figure.
- Connectome
- The complete map of connections in a nervous system or a piece of one: which neuron talks to which, and through how many synapses. The term was proposed in analogy with the genome; the first, for a roundworm, appeared in 1986 [1].
- Neuron
- A nerve cell. Counts in this study are neurons that the authors reconstructed, or “cells” where the paper counts non-neuronal cells and graph nodes as well (marked in the table).
- Synapse
- A junction where one neuron signals to another. Chemical synapses release a transmitter; gap junctions pass current directly. Papers count them differently (see Limits), so only the order of magnitude compares.
- Electron microscopy (EM)
- Imaging with electrons, fine enough to see single synapses (voxels of 4 to 8 nm in the large maps). The tissue is cut into slices or milled away layer by layer and every layer is imaged.
- FIB-SEM
- Focused-ion-beam scanning electron microscopy: an ion beam shaves off a thin layer, an electron beam images the new surface, and the cycle repeats. Used for the hemibrain, the nerve cord, the optic lobe and the male fly [7] [12].
- Proofreading
- Human correction of the computer’s tracing of neurons, where branches were wrongly split or joined. It is the costliest step: 33 person-years for the FlyWire brain [9].
- Voxel and teravoxel
- A voxel is a three-dimensional pixel; a teravoxel is a trillion of them. The male fly dataset has 160 teravoxels at 8 nm [12].
- Petabyte and exabyte
- One petabyte is 1,000 terabytes; one exabyte is 1,000 petabytes. A 1 mm3 block of human cortex is 1.4 petabytes [20].
04 Which animals have a complete connectome?
Five kinds of animal have a connectome of the whole nervous system or whole brain: the roundworm (302 and 385 neurons), a sea squirt larva (177), the fruit fly larva (3,013), the adult fruit fly (166,700 in the male) and, as a body-wide graph, a marine worm larva (2,675 cells in the graph) [2] [4] [6] [12] [5]. The roundworm map took, in the Wellcome Trust’s words, “a decade” of work by John White and colleagues at the Medical Research Council in Cambridge [24] [1]. Automation changed the effort: the hemibrain of 2020 needed 50 person-years of proofreading for about 25,000 neurons [9].
Seven of the 21 entries are insects. The fly larva of Winding and colleagues has 3,013 neurons and 544,000 synapses in a brain small enough to be read as a whole [6]; the adult male central nervous system has 55 times as many neurons. Between them sit the partial adult maps: the hemibrain (about 25,000 neurons, about 20 million chemical synapses [7]), the male nerve cord (about 23,000 neurons [8]) and the right optic lobe (about 53,000 [11]). The FlyWire brain (139,255 neurons, 54.5 million synapses) was proofread by a community of more than 50 laboratories [9].
The newest entry is the largest. The male fruit fly connectome, published in Cell in September 2026 by a team of 111 authors led from the Janelia Research Campus, holds 166,700 neurons of the brain and the nerve cord together, grouped into 11,710 types; compared with the female brain it finds 8,069 types shared by both sexes, 138 that differ, 289 found only in males and 71 only in females [27]. It took 13 months of imaging on seven FIB-SEM machines to produce 160 teravoxels and 44 person-years of proofreading [12]. The female FlyWire brain was proofread on an older volume, the 2018 FAFB images of 7,062 slices of about 40 nanometres [10].
What each map holds: neurons, synapses, authors, tissue volume and proofreading effort
Powers of ten (log10) of five facts per reconstruction, oldest first; a blank means the paper does not state it. Reading a cell: 5.2 under Neurons is 166,700 neurons; 0.0 under Volume is 1 mm3. Only 3 of 21 entries state a proofreading effort. Synapse counts follow each paper's own definition, so they are not strictly comparable.
Source: Our ledger [13] [12] [2] [9] [14] [15] [21] [16] [11] [4] [7] [20] [17] [8] [5] [18] [1] [6] [3] [19]; log10 by IQ Metrics
Data table
| reconstruction | Neurons | Synapses | Authors | Volume, mm3 | Proofreading, person-years |
|---|---|---|---|---|---|
| C. elegans 1986 | 2.5 | 3.7 | 0.6 | ||
| Mouse retina | 3 | 0.8 | |||
| Mouse cortex 2015 | 1.3 | -2.8 | |||
| Sea squirt larva | 2.2 | 3.8 | 0.5 | ||
| C. elegans hermaphrodite 2019 | 2.5 | 1.1 | |||
| C. elegans male 2019 | 2.6 | 1.1 | |||
| Mouse layer 4 | 1 | -3.3 | |||
| Fly hemibrain | 4.4 | 7.3 | 2 | 1.7 | |
| C. elegans, 8 animals | 2.3 | 3.9 | 1.2 | ||
| Zebrafish 2022 | 2.3 | 3 | 1 | ||
| Fly larva brain | 3.5 | 5.7 | 1.3 | ||
| Fly brain (FlyWire) | 5.1 | 7.7 | 2.5 | 1.5 | |
| Human cortex (H01) | 4.2 | 8.1 | 1.5 | 0 | |
| Fly nerve cord | 4.4 | 1.9 | |||
| Zebrafish brainstem | 3.5 | 1.5 | -2.6 | ||
| Fly brain + cord (BANC) | 2.1 | ||||
| Mouse cortex (MICrONS) | 4.9 | 8.7 | 2 | 0 | |
| Fly optic lobe | 4.7 | 1.9 | |||
| Marine worm larva | 3.4 | 4.4 | 0.8 | ||
| Zebrafish whole brain | 5.2 | 7.4 | 1.6 | ||
| Fly male CNS | 5.2 | 2 | 1.6 |
Embed this chart
Paste this HTML into your page: it carries the numbers and the credit link to this figure.
The heatmap shows where the information is thin. Of the 21 entries, 15 state a count of neurons, 3 more a count of cells, 11 a synapse count and 3 the proofreading effort. The human and mouse blocks are the only entries that cover a full cubic millimetre [20] [21]; the cortex pieces of 2015 and 2019 cover 0.0015 and 0.0005 mm3 and state no neuron count [15] [16].
More neurons, more synapses, more authors: three things that grow together
11 reconstructions that state both counts, by neurons (across) and synapses (up), both on log scales; bubble area = number of authors on the paper. The two cortex blocks (human H01 and mouse MICrONS) sit above the line of whole animals because their synapses belong to thousands of neurons cut by the edge of the block.
Synapses as the paper counts them (log scale)
Neurons or cells (log scale)
Source: Our ledger [13] [12] [2] [9] [14] [15] [21] [16] [11] [4] [7] [20] [17] [8] [5] [18] [1] [6] [3] [19]; author counts from OpenAlex [25]
Data table
| reconstruction | neurons | synapses | group | authors |
|---|---|---|---|---|
| C. elegans 1986 | 302 | 5000 | worm | 4 |
| Sea squirt larva | 177 | 6618 | other | 3 |
| Fly hemibrain | 25000 | 20000000 | fly | 108 |
| C. elegans, 8 animals | 204 | 8000 | worm | 16 |
| Zebrafish 2022 | 208 | 1079 | zebrafish | 11 |
| Fly larva brain | 3013 | 544000 | fly | 20 |
| Fly brain (FlyWire) | 139255 | 54500000 | fly | 293 |
| Human cortex (H01) | 16000 | 133700000 | human | 31 |
| Mouse cortex (MICrONS) | 82247 | 524000000 | mouse | 96 |
| Marine worm larva | 2675 | 26881 | other | 7 |
| Zebrafish whole brain | 176810 | 25250000 | zebrafish | 39 |
Embed this chart
Paste this HTML into your page: it carries the numbers and the credit link to this figure.
Synapse counts rise with neuron counts, but not at a constant rate. A roundworm neuron has about 17 chemical synapses on our arithmetic (5,000 over 302), a sea squirt larva neuron 37, a fly larva neuron 181, an adult fly neuron about 390 (FlyWire) to 800 (hemibrain). More neurons also means more connections per neuron. The two cortex blocks have far more synapses than neurons (6,400 per detected neuron in the mouse block, 8,400 in the human block) because the block cuts thousands of neurons at its edge; their ratios are not comparable to those of whole animals.
Most connectomes hold hundreds or thousands of neurons; only 8 of 18 reach 10,000
18 reconstructions with a neuron or cell count, in half-order-of-magnitude bins of log10(neurons): 2.5 is 316 neurons, 4.0 is 10,000, 5.0 is 100,000. The roundworm, sea squirt, larval fly and zebrafish maps fill the left; the adult fly and the two cortex blocks fill the right.
log10 of neurons (or cells) in the reconstruction
Source: Our ledger [13] [12] [2] [9] [14] [15] [21] [16] [11] [4] [7] [20] [17] [8] [5] [18] [1] [6] [3] [19]; bins by IQ Metrics
Data table
| from | to | reconstructions |
|---|---|---|
| 2 | 2.5 | 5 |
| 2.5 | 3 | 2 |
| 3 | 3.5 | 3 |
| 3.5 | 4 | 0 |
| 4 | 4.5 | 3 |
| 4.5 | 5 | 2 |
| 5 | 5.5 | 3 |
Embed this chart
Paste this HTML into your page: it carries the numbers and the credit link to this figure.
05 Has the human brain been mapped?
No: the largest human map covers about 16,000 of the 86.1 billion neurons of a human brain, one in 5,380,000, in a single cubic millimetre of cortex [20] [22]. The block, called H01, came from a piece of temporal lobe surgically removed and was cut into more than 5,000 slices of about 34 nanometres; it holds 57,216 cells, of which glia outnumber neurons two to one, 133.7 million synaptic connections, and 1.4 petabytes of images. Only 104 cells were proofread by hand [20].
Counting by volume gives the same answer. A human brain is, by the Wellcome Trust’s arithmetic, 3,000 times a mouse brain, which is 500 times the 1 mm3 volumes imaged today: 1.5 million blocks like H01 [24]. The adult human brain contains 86.1 +/- 8.1 billion neurons in the count of Azevedo and colleagues, and the mouse brain 67.9 million [22] [23]. Our own count of how many fruit fly connectomes make a human brain, by neurons alone, is 618,000 FlyWire brains.
A human brain is 5.4 million times the neurons of the biggest human map; a mouse brain 825 times
For each brain, the amount mapped (left) and the whole brain (right) as powers of ten: neurons (16,000 in the human block H01 against 86.1 billion; 82,247 detected in the mouse MICrONS block against 67.9 million) and tissue volume (1 mm3 against 1,500,000 mm3 for a human and 500 for a mouse, the ratios Wellcome Trust prints). Each unit on the axis is a factor of ten; the gap is 6.7 orders of magnitude for human neurons.
log10 of the count (neurons) or of the volume (mm3)
Source: Mapped: [20] [21]; whole brains: [22] [23] [24]; logs by IQ Metrics
Data table
| measure | Mapped in the largest block | Whole brain |
|---|---|---|
| Human: neurons | 4.2 | 10.9 |
| Mouse: neurons | 4.9 | 7.8 |
| Human: tissue volume, mm3 | 0 | 6.2 |
| Mouse: tissue volume, mm3 | 0 | 2.7 |
Embed this chart
Paste this HTML into your page: it carries the numbers and the credit link to this figure.
The gap between 1 mm3 and a whole brain is wider than the gap in neurons because a neuron’s wiring is spread through the brain. The authors of H01 and MICrONS both reconstruct neurons that leave the block, so a block-level connectome is a sample of local circuits, not a whole. For other counts of the brain that people quote, see our brain statistics fact check, how much data the human brain can store and the weights of famous brains.
06 Has a mouse brain been mapped?
No: the largest mouse connectome, MICrONS, covers a block of about one cubic millimetre of visual cortex, with 82,247 neurons detected in its larger sub-volume (0.12% of the mouse brain’s 67.9 million) and 524 million synaptic clefts [21] [23]. The MICrONS Consortium imaged 2 petabytes of raw data over about 6 months and co-registered it with calcium imaging of around 75,000 neurons in the living animal [21]. Only a subset of the cells is proofread.
Earlier mouse maps were far smaller. Helmstaedter and colleagues reconstructed 950 neurons of the retina in 2013 [14]; Kasthuri and colleagues a cortical fragment of about 1,500 cubic micrometres in 2015 [15]; Motta and colleagues a block of about 500,000 cubic micrometres in 2019 [16]. MICrONS is about 2,000 times the volume of Motta’s block (our arithmetic). For a different view of the mouse as an animal, see our comparison of animal brains.
07 Which other animals have been mapped, and how much?
The larval zebrafish is the vertebrate closest to a whole-brain map, with about 176,810 cells and 25.25 million synapses found algorithmically in a 6-day-old larva in a 2025 preprint that has not been peer reviewed [19]. The peer-reviewed zebrafish maps are partial: 208 reconstructed neurons with 1,079 synaptic contacts from a whole imaged brain [17], and about 3,000 neurons of a brainstem block of 250 x 120 x 80 micrometres [18]. We found no synapse-level connectome of a bird, a reptile, a monkey or any other mammal beyond mouse and human; absence in our search is a lower bound, not proof.
From 29 papers screened to 17 with a neuron count
How the ledger was built: leads from our plan and from searches, the papers whose primary text or abstract we could read, those that report a synapse-level wiring reconstruction with its own dataset, and those that state how many neurons or cells it holds. The 21 rows come from 20 papers (the 2019 roundworm paper gives two).
Source: IQ Metrics screening of the leads in data/rows.py; dropped papers and reasons in the table below [25] [26]
Data table
| stage | count | pct_of_first | pct_of_previous |
|---|---|---|---|
| Papers screened (leads from our plan and searches) | 29 | 100 | 100 |
| Text or abstract read in the primary source | 28 | 96.5 | 96.5 |
| A synapse-level wiring reconstruction with its own dataset | 20 | 69 | 71.4 |
| … that states a neuron or cell count | 17 | 58.6 | 85 |
Embed this chart
Paste this HTML into your page: it carries the numbers and the credit link to this figure.
08 How fast is connectome mapping growing?
The largest connectome has grown about 4.8-fold per decade over 1986-2026 and about 63-fold per decade since 2013 (a log-linear fit through the record-setting maps, IQ Metrics calculation). The first figure uses all 5 record-setters (302 in 1986 to 166,700 in 2026; R-squared 0.77); the second only the 4 since 2013 (950 to 166,700), a sharper but shorter line. Neither is a law: a record set by one laboratory depends on a decision to spend years on a single animal.
20 of 21 reconstructions are from 2013 or later, and the fruit fly leads since 2020
Reconstructions in the ledger per publication year, by animal. Years between 1986 and 2013 are not drawn: the ledger holds none. 2025 is the busiest year (5), with the first whole-brain zebrafish preprint, the fly brain-and-cord preprint and the mouse cortex block. As of 5 november 2026.
Source: Our ledger [13] [12] [2] [9] [14] [15] [21] [16] [11] [4] [7] [20] [17] [8] [5] [18] [1] [6] [3] [19]
Data table
| year | Roundworm (C. elegans) | Sea squirt and marine worm larvae | Fruit fly | Zebrafish larva | Mouse | Human | total |
|---|---|---|---|---|---|---|---|
| 1986 | 1 | 1 | |||||
| 2013 | 1 | 1 | |||||
| 2014 | 0 | ||||||
| 2015 | 1 | 1 | |||||
| 2016 | 1 | 1 | |||||
| 2017 | 0 | ||||||
| 2018 | 0 | ||||||
| 2019 | 2 | 1 | 3 | ||||
| 2020 | 1 | 1 | |||||
| 2021 | 1 | 1 | |||||
| 2022 | 1 | 1 | |||||
| 2023 | 1 | 1 | |||||
| 2024 | 2 | 1 | 1 | 4 | |||
| 2025 | 1 | 2 | 1 | 1 | 5 | ||
| 2026 | 1 | 1 |
Embed this chart
Paste this HTML into your page: it carries the numbers and the credit link to this figure.
Counting every entry rather than records tells the same story. Only 1 of the 21 entries appeared before 2013, 6 between 2013 and 2019 and 14 from 2020 on. Teams grew too: the median entry had 4 authors before 2013, 14 in 2013-2019 and 71 from 2020 [25]. Neurons, synapses and authors are strongly correlated across the maps that report all three (r = 0.84 to 0.96), because the big maps are team projects.
Neurons and synapses move together (r = 0.96); time alone explains less (r = 0.52)
Pearson correlations across the 8 reconstructions that state neurons, synapses and authors, using log10 of each count. Linked, not cause: bigger maps have more of everything, and newer maps are bigger. Eight points are a small sample.
Source: Our ledger [13] [12] [2] [9] [14] [15] [21] [16] [11] [4] [7] [20] [17] [8] [5] [18] [1] [6] [3] [19]; correlations by IQ Metrics
Data table
| measure | Publication year | Neurons (log10) | Synapses (log10) | Authors (log10) |
|---|---|---|---|---|
| Publication year | 1 | 0.5 | 0.5 | 0.6 |
| Neurons (log10) | 0.5 | 1 | 1 | 0.9 |
| Synapses (log10) | 0.5 | 1 | 1 | 0.8 |
| Authors (log10) | 0.6 | 0.9 | 0.8 | 1 |
Embed this chart
Paste this HTML into your page: it carries the numbers and the credit link to this figure.
Speed of proofreading matters as much as speed of imaging. The male fly CNS was imaged in 13 months on seven FIB-SEM machines (160 teravoxels) and then proofread over 3 years by 29 expert proofreaders, 44 person-years [12]; the hemibrain needed 50 person-years for about 25,000 neurons, FlyWire 33 for 139,255 [9]. In neurons per person-year, that is 500 for the hemibrain, 4,220 for FlyWire and 3,789 for the male CNS (IQ Metrics calculation).
09 When will a whole mouse brain or the human brain be mapped?
The Wellcome Trust’s 2023 report calls a whole mouse connectome “probably still a decade off”, plausible within 10 to 15 years, and expects human brains to “remain off limits to connectomics for several decades” [24]. If the record-setting line since 2013 simply continued, the neuron count would reach a mouse brain around 2040; the line since 1986 puts it around 2070, and a human brain around 2057 to 2116 (IQ Metrics arithmetic, not a forecast).
A mouse connectome: 2033 by the Wellcome Trust, 2040 or 2070 if past growth simply continued
Years in which the neuron count of the largest connectome would reach a mouse brain (67.9 million) or a human brain (86.1 billion). Wellcome Trust (2023): "probably still a decade off", in the next 10 to 15 years. Ours is arithmetic, not a forecast: a straight line through the 5 record-setting maps since 1986 (x4.8 a decade) and through the 4 since 2013 (x63 a decade). Wellcome expects human brains to "remain off limits to connectomics for several decades".
Source: Wellcome Trust report [24]; neuron counts [22] [23]; fits and arithmetic by IQ Metrics
Data table
| label | low | estimate | high |
|---|---|---|---|
| Mouse brain: Wellcome Trust, 10-15 years from 2023 | 2033 | 2033 | 2038 |
| Mouse brain: our trend, record-setters since 2013 | 2040 | 2040 | 2040 |
| Mouse brain: our trend, record-setters since 1986 | 2070 | 2070 | 2070 |
| Human brain: our trend, record-setters since 2013 | 2057 | 2057 | 2057 |
| Human brain: our trend, record-setters since 1986 | 2116 | 2116 | 2116 |
Embed this chart
Paste this HTML into your page: it carries the numbers and the credit link to this figure.
The cost is the reason for the spread. The Wellcome report estimates $7.5 to $21 billion for one mouse brain, calls manual proofreading the most resource-intensive step and puts it at about 100,000 person-years with today’s tools; it also notes that automation cut the whole fly brain from about 2,000 person-years to about 40 [24]. At FlyWire’s rate of 4,220 neurons per person-year a mouse brain would take 16,084 person-years, one sixth of the Wellcome figure (IQ Metrics arithmetic).
Proofreading a mouse brain: 100,000 person-years by Wellcome, 16,000 at the rate FlyWire reached
Proofreading effort (across, log scale) against neurons (up, log scale). Blue: three fly maps, whose papers state the effort (33, 44 and 50 person-years). Grey: the Wellcome Trust estimate for a whole mouse brain. Orange: our arithmetic, a mouse brain at FlyWire's 4,220 neurons per person-year. The fly rate has risen 8-fold from the hemibrain (500) to FlyWire.
Neurons (log scale)
Proofreading effort, person-years (log scale)
Source: [7] [9] [12] [24] [23]; arithmetic by IQ Metrics
Data table
| case | person_years | neurons | group |
|---|---|---|---|
| Fly hemibrain | 50 | 25000 | measured |
| Fly brain (FlyWire) | 33 | 139255 | measured |
| Fly male CNS | 44 | 166700 | measured |
| Mouse brain: Wellcome | 100000 | 67870000 | published |
| Mouse brain at FlyWire rate | 16084 | 67870000 | ours |
Embed this chart
Paste this HTML into your page: it carries the numbers and the credit link to this figure.
Storage is the second wall. The Wellcome report puts raw images of a whole mouse brain at 0.5 exabytes at one byte per voxel [24]. Scaling the two block datasets by volume gives 700 to 1,000 petabytes for a mouse (H01 at 1,400 TB and MICrONS at 2,000 TB per mm3) and 2.1 to 3.0 zettabytes for a human brain, (our arithmetic, labelled; compression would reduce it). Compare estimates of what a brain stores.
10 Who builds connectomes, and with which microscopes?
Most connectomes come from teams in the United States, Germany, the United Kingdom and Canada, and four of the seven fly papers come from one campus, the Howard Hughes Medical Institute’s Janelia Research Campus [7] [8] [11] [12]. The ledger classifies each paper by the country of its last author’s first-listed institution in OpenAlex [25]; 11 of 20 papers have a United States senior author. China appears once, with a zebrafish preprint [19].
11 of 20 connectome papers have a United States senior author; two imaging families carry the fly maps
Papers in the ledger by country of the last author's first listed institution (OpenAlex), by animal and by imaging method. Width = number of papers (20). The fruit fly papers split between serial-section transmission EM (FlyWire) and focused-ion-beam scanning EM (hemibrain, nerve cord, optic lobe, male CNS); one fly preprint does not state its method in the text we read.
Source: Our ledger [13] [12] [2] [9] [14] [15] [21] [16] [11] [4] [7] [20] [17] [8] [5] [18] [1] [6] [3] [19]; countries from OpenAlex [25]
Data table
| from | to | stage |
|---|---|---|
| United Kingdom | Roundworm | 1 |
| Germany | Mouse | 2 |
| United States | Mouse | 2 |
| Canada | Sea squirt and marine worm larvae | 1 |
| United States | Roundworm | 1 |
| United States | Fruit fly | 6 |
| Canada | Roundworm | 1 |
| Germany | Zebrafish larva | 1 |
| Germany | Fruit fly | 1 |
| United States | Human | 1 |
| United States | Zebrafish larva | 1 |
| Germany | Sea squirt and marine worm larvae | 1 |
| China | Zebrafish larva | 1 |
| Roundworm | Serial-section EM | 3 |
| Mouse | Serial block-face SEM | 2 |
| Mouse | Serial-section EM | 1 |
| Sea squirt and marine worm larvae | Serial-section EM | 1 |
| Fruit fly | FIB-SEM | 4 |
| Zebrafish larva | Serial block-face SEM | 1 |
| Fruit fly | Serial-section EM | 1 |
| Fruit fly | Serial-section TEM | 1 |
| Human | Multibeam SEM | 1 |
| Zebrafish larva | Serial-section EM | 2 |
| Fruit fly | Not stated | 1 |
| Mouse | Serial-section TEM | 1 |
| Sea squirt and marine worm larvae | Serial-section TEM | 1 |
Embed this chart
Paste this HTML into your page: it carries the numbers and the credit link to this figure.
Two imaging families dominate. Serial-section electron microscopy cuts tissue into thousands of slices first: the roundworm, sea squirt, marine worm and FlyWire maps [4] [5] [9]. FIB-SEM mills the sample away layer by layer, giving cubes of 8 nanometres on every side: the hemibrain, nerve cord, optic lobe and male fly [7] [12]. Serial block-face SEM, used for the mouse retina and cortex, and multibeam SEM for H01, are the other two [14] [20].
Mouse maps grew from 6 authors in 2013 to 96 in 2025; the roundworm map from 4 to 16
Authors on the first and the latest paper in the ledger for each animal (OpenAlex author counts). Roundworm: White 1986 and Witvliet 2021; mouse: Helmstaedter 2013 and MICrONS 2025; zebrafish: Svara 2022 and the 2025 Fish-X preprint; sea squirt / marine worm: Ryan 2016 and Verasztó 2025; fruit fly: hemibrain 2020 (108) and the male CNS 2026 (111). Human has one paper (31).
Source: Author counts from OpenAlex [25] for the papers of our ledger [13] [12] [2] [9] [14] [15] [21] [16] [11] [4] [7] [20] [17] [8] [5] [18] [1] [6] [3] [19]
Data table
| animal | First map | Latest map |
|---|---|---|
| Roundworm | 4 | 16 |
| Sea squirt / marine worm | 3 | 7 |
| Fruit fly | 108 | 111 |
| Zebrafish | 11 | 39 |
| Mouse | 6 | 96 |
Embed this chart
Paste this HTML into your page: it carries the numbers and the credit link to this figure.
FlyWire leads on neurons and authors, the mouse block on synapses
Rank (1 = most) of the 8 reconstructions that state neurons, synapses and authors, on each of the three counts. FlyWire ranks 1, 3 and 1; the mouse cortex block (MICrONS) 2, 1 and 3. Ranks of counts, not of quality.
Source: Our ledger [13] [12] [2] [9] [14] [15] [21] [16] [11] [4] [7] [20] [17] [8] [5] [18] [1] [6] [3] [19]; ranks by IQ Metrics
Data table
| reconstruction | Neurons | Synapses | Authors |
|---|---|---|---|
| Fly brain (FlyWire) | 1 | 3 | 1 |
| Mouse cortex (MICrONS) | 2 | 1 | 3 |
| Fly hemibrain | 3 | 4 | 2 |
| Human cortex (H01) | 4 | 2 | 4 |
| Fly larva brain | 5 | 5 | 5 |
| C. elegans 1986 | 6 | 7 | 7 |
| Zebrafish 2022 | 7 | 8 | 6 |
| Sea squirt larva | 8 | 6 | 8 |
Embed this chart
Paste this HTML into your page: it carries the numbers and the credit link to this figure.
Fly teams are the largest: a median of 108 authors against 14 for roundworm papers
Authors per paper by animal, one dot per paper (the 2019 roundworm paper counts once). Box = middle half, line = median, whiskers = fewest and most authors. Worm: 4 to 16; fly: 20 to 293 (FlyWire, 293 authors including its consortium). Groups with fewer than 3 papers show the range only.
Authors per paper (OpenAlex).
Source: Author counts from OpenAlex [25]; quartiles by IQ Metrics
Data table
| animal | n | low | q1 | median | q3 | high |
|---|---|---|---|---|---|---|
| Roundworm | 3 | 4 | 9 | 14 | 15 | 16 |
| Larvae | 2 | 3 | 3 | 5 | 7 | 7 |
| Fruit fly | 7 | 20 | 77.5 | 108 | 113.5 | 293 |
| Zebrafish | 3 | 11 | 21 | 31 | 35 | 39 |
| Mouse | 4 | 6 | 9 | 15.5 | 39.8 | 96 |
| Human | 1 | 31 | 31 | 31 | 31 | 31 |
Embed this chart
Paste this HTML into your page: it carries the numbers and the credit link to this figure.
Authorship counts also reveal how maps are shared. FlyWire lists 293 authors because it was built by a consortium in which researchers from more than 50 laboratories took part [9]; the 1986 roundworm paper had 4. The maps are open: the fly, mouse and human datasets are public for anyone to download, and we link each paper. For the memory side of the brain see our memory and IQ guide and memory world records study.
11 Does a bigger connectome mean a smarter animal?
No: a connectome counts neurons and synapses, which are not intelligence, and nothing on this page measures the intelligence of any species. The fruit fly has the largest complete connectome of any animal and no animal is smarter for it. Brain size has a weak link with IQ within people (see brain size and IQ) and no use as a ranking between species. What a connectome gives is a parts list and a wiring diagram, a base for models of how circuits compute, which scientists then test with recordings [6] [21]. To see which part of the brain intelligence tests tap, read which part of the brain IQ tests measure; for a famous brain that was weighed and cut, Einstein’s brain.
Test the brain you have, not the one in the lab
Our IQ test measures how you reason with patterns and compares your result with adults, with a percentile. Neuron counts do not predict it.
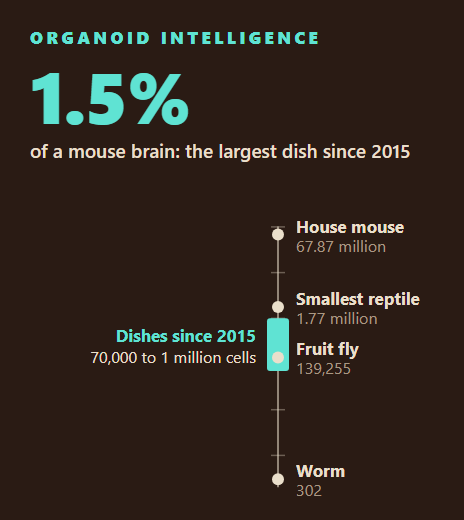
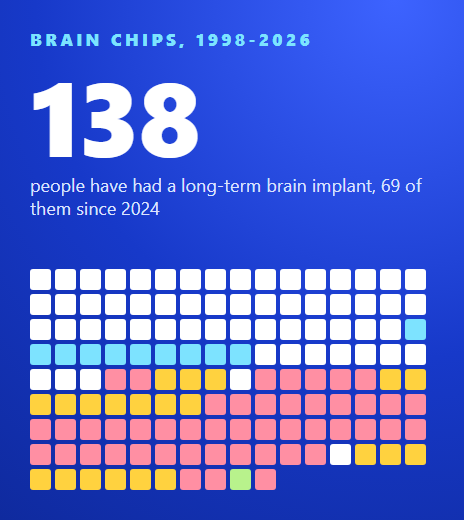
Take the IQ testConnectome science also feeds other questions we cover. Neurons grown in a dish, organoids, are now wired to computers; our organoid intelligence study counts the experiments. For brain implants, see how many people have a brain implant. And for how fast a brain handles information, how fast do humans think.
12 Every connectome in our dataset
Every reconstruction in our ledger (21 rows)
Oldest first. Neurons are reconstructed neurons unless the cell says "cells". Synapses follow each paper's own definition (see the CSV column synapse_basis); blank = not stated in the text we read.
| C. elegans hermaphrodite (White et al.) | 1986 | whole nervous system | 302 | 5,000 | Serial-section EM | 4 | White 1986 |
| Mouse retina, inner plexiform layer (Helmstaedter et al.) | 2013 | part of the retina | 950 | – | Serial block-face SEM | 6 | Helmstaedter 2013 |
| Mouse neocortex fragment (Kasthuri et al.) | 2015 | sub-volume of neocortex | – | – | Serial-section EM | 21 | Kasthuri 2015 |
| Ciona larva CNS (Ryan et al.) | 2016 | whole central nervous system | 177 | 6,618 | Serial-section EM | 3 | Ryan 2016 |
| C. elegans hermaphrodite (Cook et al.) | 2019 | whole animal, incl. muscles | 302 | – | Serial-section EM | 14 | Cook 2019 |
| C. elegans male (Cook et al.) | 2019 | whole animal, incl. muscles | 385 | – | Serial-section EM | 14 | Cook 2019 |
| Mouse barrel cortex, layer 4 (Motta et al.) | 2019 | block of layer 4, somatosensory cortex | – | – | Serial block-face SEM | 10 | Motta 2019 |
| Fruit fly hemibrain (Scheffer et al.) | 2020 | about half of the central brain | 25,000 | 20,000,000 | FIB-SEM | 108 | Scheffer 2020 |
| C. elegans, 8 animals birth to adult (Witvliet et al.) | 2021 | brain (nerve ring and ventral ganglion) | 204 cells | 8,000 | Serial-section EM | 16 | Witvliet 2021 |
| Larval zebrafish brain, 208 neurons (Svara et al.) | 2022 | whole brain imaged; 208 neurons reconstructed | 208 | 1,079 | Serial block-face SEM | 11 | Svara 2022 |
| Drosophila larva brain (Winding et al.) | 2023 | whole brain | 3,013 | 544,000 | Serial-section EM | 20 | Winding 2023 |
| Fruit fly whole brain, FlyWire (Dorkenwald et al.) | 2024 | whole brain | 139,255 | 54,500,000 | Serial-section TEM | 293 | Dorkenwald 2024 |
| Human cortex fragment, H01 (Shapson-Coe et al.) | 2024 | 1 mm3 of temporal-lobe cortex | 16,000 | 133,700,000 | Multibeam SEM | 31 | Shapson-Coe 2024 |
| Fruit fly male nerve cord (Takemura et al.) | 2024 | ventral nerve cord | 23,000 | – | FIB-SEM | 84 | Takemura 2024 |
| Larval zebrafish brainstem (Vishwanathan et al.) | 2024 | brainstem block (250 x 120 x 80 micrometres) | 3,000 | – | Serial-section EM | 31 | Vishwanathan 2024 |
| Fruit fly brain + nerve cord, BANC (Bates et al.) | 2025 | brain and ventral nerve cord | – | – | – | 116 | Bates 2025 (preprint) |
| Mouse visual cortex, MICrONS (MICrONS Consortium) | 2025 | about 1 mm3 of visual cortex | 82,247 | 524,000,000 | Serial-section TEM | 96 | MICrONS 2025 |
| Fruit fly optic lobe (Nern et al.) | 2025 | right optic lobe | 53,000 | – | FIB-SEM | 71 | Nern 2025 |
| Platynereis larva, whole body (Veraszto et al.) | 2025 | whole body | 2,675 cells | 26,881 | Serial-section TEM | 7 | Verasztó 2025 |
| Larval zebrafish whole brain, Fish-X (Xie et al.) | 2025 | whole brain, retina and anterior spinal cord | 176,810 cells | 25,250,000 | Serial-section EM | 39 | Li 2025 (preprint) |
| Fruit fly male CNS (Berg et al.) | 2026 | whole central nervous system (brain + nerve cord) | 166,700 | – | FIB-SEM | 111 | Berg 2026 |
Source: Our ledger [13] [12] [2] [9] [14] [15] [21] [16] [11] [4] [7] [20] [17] [8] [5] [18] [1] [6] [3] [19]
Papers we read and left out (9) and why
A paper is in the ledger only if it reports a synapse-level wiring reconstruction with its own dataset and counts we could read. Leaving a paper out is not a judgement of its value.
| Paper | Reason |
|---|---|
| Zheng et al. 2018, FAFB electron microscopy volume of a whole fly brain | imaging volume only; reconstruction came later (FlyWire) |
| Hildebrand et al. 2017, whole larval zebrafish brain | imaging volume and myelinated-axon survey, no synapse-level connectome |
| Eichler et al. 2017, larval mushroom body | one circuit; the text gives no total neuron count |
| Phelps et al. 2021, FANC nerve cord | full text not available to us |
| Marin et al. 2024, MANC annotation | analysis of the same dataset as Takemura et al. |
| Cheong et al. 2024, MANC premotor circuits | analysis of the same dataset as Takemura et al. |
| Emmons 2024, C. elegans connectome analysis | new analysis of existing connectomes, no new reconstruction |
| Loomba et al. 2022, mouse, macaque and human cortex | abstract gives no counts; paper is paywalled |
| Jarrell et al. 2012, male C. elegans tail | partial, folded into Cook et al. 2019 |
13 How we built the ledger
- 01
Start from the leads
We began with a list of known connectome papers, from the 1986 roundworm paper to the 2026 male fruit fly CNS, and added papers found through Crossref and in the reference lists of the papers we read. Blogs and news were leads only; every figure is from a paper, its preprint or an official release page.
- 02
Read the primary text by script
Each paper was saved (PubMed Central, eLife, bioRxiv, publisher PDFs where open, NLM abstracts where paywalled). Every number printed here was matched by a script against the saved text (86 checks); a number that is not found stops the build.
- 03
One row per reconstruction
A row is one dataset with its own counts: the roundworm hermaphrodite and male are two rows from one paper. Rows keep the paper’s own definition of a synapse, and blank means the text did not state it. We never filled a value.
- 04
Add what the papers do not say about themselves
Author counts and institutions from OpenAlex (CC0), dates and licences from Crossref, retraction flags from both (none found). Brain sizes are published counts: 86.1 billion neurons in a human brain, 67.87 million in a mouse brain.
- 05
Compute our own numbers
Growth fits, shares, ratios and data-scaling arithmetic are done in one script (analyse.py) and labelled IQ Metrics calculation. “If the trend held” dates are arithmetic, shown next to the published statements of the Wellcome Trust, never as a prediction.
Read every number with these in mind
- The ledger is the reconstructions we could read, not a census. A paper we could not find or read is missing; the table of dropped papers says why each excluded one is out.
- Synapse counts are not one measure. Roundworm and sea squirt counts are individual chemical synapses; hemibrain and FlyWire counts depend on how each team counts presynaptic and postsynaptic sites; MICrONS and H01 counts are automatic detections in an unproofread volume. Compare orders of magnitude only.
- Neurons are neurons only where the paper separates them from other cells. “Cells” rows (Witvliet, the marine worm and the zebrafish preprint) count non-neuronal cells or graph nodes as well.
- The mouse (82,247) and human (about 16,000) neuron counts are detections inside 1 mm3 blocks, mostly not proofread. The human count is as described in the MICrONS paper; the H01 paper counts 57,216 cells, with glia outnumbering neurons two to one.
- The Cell text of the male fly CNS, the eLife text of the nerve cord and the Cell text of the 2015 mouse cortex paper were not available to us; counts come from the abstract, the bioRxiv versions or papers that cite them. A press aggregator’s “125 million synapses” for the male CNS is not in anything we could read and is not used.
- Brain sizes are published estimates with their own error: 86.1 +/- 8.1 billion neurons in a human brain, 67.87 +/- 10.41 million in a mouse brain. Shares are rounded.
- Growth fits use 5 record-setting points (4 since 2013); they describe the past, and dates from them are arithmetic, not predictions. Wellcome Trust numbers are the report’s estimates, copied without change.
- Nothing here measures intelligence, and neuron counts do not rank species.
Sources
- Royal Society. White JG, Southgate E, Thomson JN, Brenner S: The structure of the nervous system of the nematode Caenorhabditis elegans. Philosophical Transactions of the Royal Society B 1986;314(1165):1-340 (abstract read). 1986. doi.org/10.1098/rstb.1986.0056Paywalled; abstract (OpenAlex, CC0) read, facts cited
- Nature. Cook SJ, Jarrell TA, Brittin CA, et al.: Whole-animal connectomes of both Caenorhabditis elegans sexes. Nature 2019;571:63-71 (read in the PMC author manuscript). 2019. doi.org/10.1038/s41586-019-1352-7Publisher licence; PMC author manuscript; facts cited, tables not copied
- Nature. Witvliet D, Mulcahy B, Mitchell JK, et al.: Connectomes across development reveal principles of brain maturation. Nature 2021;596:257-261 (read in the PMC author manuscript). 2021. doi.org/10.1038/s41586-021-03778-8Publisher licence; PMC author manuscript; facts cited
- eLife. Ryan K, Lu Z, Meinertzhagen IA: The CNS connectome of a tadpole larva of Ciona intestinalis (L.) highlights sidedness in the brain of a chordate sibling. eLife 2016;5:e16962. 2016. doi.org/10.7554/eLife.16962CC BY 4.0
- eLife. Verasztó C, Jasek S, Gühmann M, et al.: Whole-body connectome of a segmented annelid larva. eLife 2025;13:RP97964 (reviewed preprint 2024). 2025. doi.org/10.7554/eLife.97964CC BY 4.0
- Science. Winding M, Pedigo BD, Barnes CL, et al.: The connectome of an insect brain. Science 2023;379:eadd9330 (read in the PMC author manuscript). 2023. doi.org/10.1126/science.add9330CC BY 4.0 (author manuscript)
- eLife. Scheffer LK, Xu CS, Januszewski M, et al.: A connectome and analysis of the adult Drosophila central brain. eLife 2020;9:e57443. 2020. doi.org/10.7554/eLife.57443CC BY 4.0
- eLife / bioRxiv. Takemura S-y, Hayworth KJ, Huang GB, et al.: A connectome of the male Drosophila ventral nerve cord. eLife 2024;13:RP97769 (read in the 2023 bioRxiv version, doi 10.1101/2023.06.05.543757). 2024. doi.org/10.7554/eLife.97769bioRxiv version read (preprint licence not recorded by us); facts cited
- Nature. Dorkenwald S, Matsliah A, Sterling AR, et al.: Neuronal wiring diagram of an adult brain. Nature 2024;634:124-138. 2024. doi.org/10.1038/s41586-024-07558-yCC BY 4.0
- Cell. Zheng Z, Lauritzen JS, Perlman E, et al.: A complete electron microscopy volume of the brain of adult Drosophila melanogaster. Cell 2018;174:730-743. 2018. doi.org/10.1016/j.cell.2018.06.019CC BY 4.0
- Nature. Nern A, Loesche F, Takemura S-y, et al.: Connectome-driven neural inventory of a complete visual system. Nature 2025;641:1225-1237. 2025. doi.org/10.1038/s41586-025-08746-0CC BY 4.0
- Cell / HHMI Janelia Research Campus. Berg S, Nern A, Preibisch S, et al.: Sexual dimorphism in the complete Drosophila male central nervous system connectome. Cell 2026;189(18):5504-5526, doi 10.1016/j.cell.2026.08.015 (abstract on the HHMI Janelia publication page; counts in the bioRxiv preprint 10.1101/2025.10.09.680999). 2026. doi.org/10.1016/j.cell.2026.08.015CC BY 4.0 (Crossref licence record); preprint CC BY 4.0
- bioRxiv. Bates AS, Phelps JS, Kim M, et al.: Distributed control circuits across a brain-and-cord connectome of Drosophila. bioRxiv 2025, doi 10.1101/2025.07.31.667571 (preprint). 2025. doi.org/10.1101/2025.07.31.667571CC BY 4.0 (Crossref record); preprint, not peer reviewed
- Nature. Helmstaedter M, Briggman KL, Turaga SC, et al.: Connectomic reconstruction of the inner plexiform layer in the mouse retina. Nature 2013;500:168-174 (abstract read). 2013. doi.org/10.1038/nature12346Paywalled; PubMed abstract (NLM) read, facts cited
- Cell. Kasthuri N, Hayworth KJ, Berger DR, et al.: Saturated reconstruction of a volume of neocortex. Cell 2015;162:648-661 (abstract read; volume as cited by Motta et al.). 2015. doi.org/10.1016/j.cell.2015.06.054Abstract (NLM) read; the text was not available to us
- Science / bioRxiv. Motta A, Berning M, Boergens KM, et al.: Dense connectomic reconstruction in layer 4 of the somatosensory cortex. Science 2019;366:eaay3134 (abstract; counts in the bioRxiv version 10.1101/460618). 2019. doi.org/10.1126/science.aay3134Abstract (OpenAlex, CC0) and bioRxiv preprint read, facts cited
- Nature Methods. Svara F, Förster D, Kubo F, et al.: Automated synapse-level reconstruction of neural circuits in the larval zebrafish brain. Nature Methods 2022;19:1357-1366. 2022. doi.org/10.1038/s41592-022-01621-0CC BY 4.0
- Nature Neuroscience. Vishwanathan A, Sood A, Wu J, et al.: Predicting modular functions and neural coding of behavior from a synaptic wiring diagram. Nature Neuroscience 2024;27:2443-2454. 2024. doi.org/10.1038/s41593-024-01784-3CC BY-NC-ND 4.0: facts cited only
- bioRxiv. Li F, Liu J, Shi C, et al.: Multiplexed neuromodulatory-type-annotated whole-brain EM-reconstruction of larval zebrafish. bioRxiv 2025, doi 10.1101/2025.06.12.659365 (preprint). 2025. doi.org/10.1101/2025.06.12.659365CC BY-NC-ND 4.0 preprint: facts cited only; not peer reviewed
- Science. Shapson-Coe A, Januszewski M, Berger DR, et al.: A petavoxel fragment of human cerebral cortex reconstructed at nanoscale resolution. Science 2024;384:eadk4858. 2024. doi.org/10.1126/science.adk4858Abstract (OpenAlex, CC0) and PMC author manuscript read; facts cited
- Nature. MICrONS Consortium: Functional connectomics spanning multiple areas of mouse visual cortex. Nature 2025;640:435-447. 2025. doi.org/10.1038/s41586-025-08790-wCC BY 4.0
- Journal of Comparative Neurology (Wiley). Azevedo FAC, Carvalho LRB, Grinberg LT, et al.: Equal numbers of neuronal and nonneuronal cells make the human brain an isometrically scaled-up primate brain. Journal of Comparative Neurology 2009;513:532-541 (abstract read). 2009. doi.org/10.1002/cne.21974Abstract (OpenAlex, CC0) read, facts cited
- Karger. Herculano-Houzel S, Ribeiro P, Campos L, et al.: Updated neuronal scaling rules for the brains of Glires (rodents/lagomorphs). Brain Behavior and Evolution 2011;78:302-314, Table 1 (mouse: 67.87 million neurons; read for our smartest-animals study). 2011. doi.org/10.1159/000330825Karger (full text in PMC); facts cited
- Wellcome Trust. Wellcome Trust: Scaling up connectomics: the road to a whole mouse brain connectome (report, June 2023; Lichtman, Pfister and colleagues). 2023. wellcome.org/insights/reports/scaling-connectomicsReport PDF read in full; facts cited, no figures copied
- OurResearch. OpenAlex: author counts, institutions, open-access status and retraction flag of every paper. 2026. openalex.orgCC0
- Crossref. Crossref: dates, licences and retraction / update notices of every paper. 2026. www.crossref.orgMetadata reusable as facts (CC0)
- HHMI Janelia. HHMI Janelia Research Campus: publication page for Berg et al. 2026 (abstract, PMID 42691995). 2026. www.janelia.org/publication/sexual-dimorphism-in-the-complete-drosophila-male-central-nervous-system-connectomePage cited for the abstract (166,700 neurons)
Version history
- 2026.115 November 2026First release. Next update due May 2027, or sooner when a mouse or human block larger than MICrONS or H01 is published, the zebrafish whole-brain or the fly brain-and-cord preprints are peer reviewed, or the Wellcome Trust updates its mouse connectome estimates.
Leon Falkner, Data & Research Analyst. Leon owns the arithmetic on IQ Metrics: the percentile tables, the score converter and the figures in everyone else's drafts. On the research desk Leon pulls the data, builds each index and writes the method. More about Leon.
Questions
How much of the brain have we mapped?
Complete connectomes exist for animals up to the fruit fly (166,700 neurons in the male). Of a mouse brain about 0.12% of neurons are mapped, 82,247 of 67.9 million; of a human brain about 16,000 of 86.1 billion, roughly 1 in 5,380,000.
Has the human brain been mapped?
No. The largest human connectome, H01 (Science, 2024), covers 1 mm3 of cortex: 57,216 cells, about 16,000 neurons, 133.7 million synaptic connections and 1.4 petabytes. A human brain is about 1.5 million times that volume.
Has the fruit fly connectome been completed?
Yes. FlyWire mapped the female brain (139,255 neurons, 54.5 million synapses, 2024), and a Janelia-led team mapped the male brain and nerve cord together (166,700 neurons, Cell, September 2026). The fruit fly is the largest animal with a complete connectome.
How many neurons does a fruit fly have?
About 140,000 in the brain of an adult female (139,255 in FlyWire) and 166,700 in the male brain and nerve cord together. The fruit fly larva has 3,013 neurons in its brain.
How many neurons does a C. elegans have?
The roundworm Caenorhabditis elegans has 302 neurons in the hermaphrodite and 385 in the male. Its wiring diagram, first published in 1986, was the first complete connectome and now has 4,887 chemical edges.
When will the whole human brain be mapped?
Not soon. The Wellcome Trust (2023) expects human brains to remain off limits for several decades and a mouse brain in 10 to 15 years. A straight line through past records would reach a human brain about 2057 to 2116 (arithmetic).
How much would a whole mouse brain connectome cost?
The Wellcome Trust estimated $7.5 to $21 billion in 2023, mostly manual proofreading of about 100,000 person-years with today's tools. The FlyWire fly brain took 33 person-years; at that rate a mouse brain would need about 16,000.
How big is a human connectome in data?
A 1 mm3 human block is 1.4 petabytes. At that density a whole human brain would be about 2.1 zettabytes, 2,100 exabytes, and a mouse brain 0.7 to 1.0 exabytes (our arithmetic; Wellcome estimates 0.5 exabytes for a mouse).
What is the difference between a connectome and a brain map?
A connectome lists the synapses between individual neurons, seen with an electron microscope at nanometre resolution. Brain maps from MRI show regions and bundles of fibres of millions of neurons; they do not resolve single cells.
Does a bigger connectome mean a smarter animal?
No. A connectome counts neurons and synapses, not intelligence, and the animals with complete connectomes (roundworm, fruit fly) are not ranked by how smart they are. Nothing on this page measures the intelligence of a species.
Share it, cite it, download it
You may reuse everything on this page under CC BY 4.0: in articles, reports, lessons and posts. The one condition is credit to IQ Metrics with a link to this page.
Cite this study
Version 2026.11. Citing the version lets readers find the exact numbers.
Archived copy with a DOI: 10.5281/zenodo.23973005 (report PDF and data on Zenodo).
Falkner, L. (2026). How much of the brain have we mapped? 21 connectomes, 1986 to 2026 (Version 2026.11) [Data set]. IQ Metrics Research. https://iqmetrics.org/research/how-much-of-the-brain-have-we-mapped/ (DOI: 10.5281/zenodo.23973005)
Falkner, Leon. "How much of the brain have we mapped? 21 connectomes, 1986 to 2026." IQ Metrics Research, 5 Nov. 2026, iqmetrics.org/research/how-much-of-the-brain-have-we-mapped/. DOI: 10.5281/zenodo.23973005.
Falkner, Leon. "How much of the brain have we mapped? 21 connectomes, 1986 to 2026." IQ Metrics Research. November 5, 2026. https://iqmetrics.org/research/how-much-of-the-brain-have-we-mapped/. DOI: 10.5281/zenodo.23973005.
@misc{iqmetrics2026howmuchofthebrainhavewemapped, author = {Falkner, Leon}, title = {How much of the brain have we mapped? 21 connectomes, 1986 to 2026}, institution = {IQ Metrics}, year = {2026}, version = {2026.11}, doi = {10.5281/zenodo.23973005}, url = {https://iqmetrics.org/research/how-much-of-the-brain-have-we-mapped/} }
Source: Leon Falkner, "How much of the brain have we mapped? 21 connectomes, 1986 to 2026." IQ Metrics Research, version 2026.11, https://iqmetrics.org/research/how-much-of-the-brain-have-we-mapped/ (DOI 10.5281/zenodo.23973005)
Embed the key numbers
Paste this into an article or post. It lists the main numbers and credits the source.
Get the data
One row per published synapse-level reconstruction (21 rows): the animal, stage and scope, publication year, neurons (or cells) and synapses as the paper counts them, tissue volume, imaging method, raw data size and proofreading effort where stated, authors and institutions from OpenAlex, DOI, open-access status and notes.
| Column | What it holds |
|---|---|
id, reconstruction, group, organism, stage, scope | Row key, short description, animal group (worm, other, fly, zebrafish, mouse, human), species, developmental stage and what part of the nervous system is covered |
publication_year | Year of the paper (or preprint) |
neurons, count_type | Neurons (or cells or graph nodes) the paper states; count_type is neurons or cells. Blank = not stated |
synapses, synapse_basis, neuron_to_neuron_edges | The paper's headline synapse count and what it counts; edges are neuron-to-neuron connections where the text gives those instead |
volume_mm3, method, teravoxels, raw_data_tb | Tissue volume in cubic millimetres, imaging method, size in teravoxels and raw data in terabytes where stated |
proofreading_person_years | Human proofreading effort stated by the authors |
authors, first_author_institution, last_author_institution, last_author_country | From OpenAlex |
open_access, doi, status, note | OpenAlex open-access status, DOI, peer-reviewed or preprint, and what to know about the row |
For journalists, researchers and teachers
Everything on this page may be quoted, charted and republished with credit. No embargo, no permission needed, no sign-up. If you need a number that is not here, ask.
Summary you can paste
Plain news style. Edit freely; keep the credit.
IQ Metrics Research built a ledger of 21 published synapse-level reconstructions (connectomes) from 20 papers, 1986-2026, reading every number in the primary paper. The whole nervous system is mapped for the roundworm (302 neurons), the sea squirt larva (177), the fruit fly larva (3,013) and the adult fruit fly (166,700 in the male); the largest mouse block holds 82,247 detected neurons (about 0.12% of a mouse brain) and the largest human block about 16,000 (about 0.00002%). Growth is about 63-fold a decade since 2013; the Wellcome Trust puts one mouse connectome at $7.5-21 billion. Source: IQ Metrics Research, https://iqmetrics.org/research/how-much-of-the-brain-have-we-mapped/
Angles for a story
- Fly: done. Mouse: 0.12%. Human: 0.00002% (Figure 6)
- Forty years from 302 neurons to 166,700 (Figure 1, Figure 2)
- 33 person-years for a fly brain, 100,000 for a mouse brain (Figure 11)
- A mouse connectome by 2033, 2040 or 2070? Three answers (Figure 10)
- A human brain imaged like H01 would be about 2.1 zettabytes (arithmetic in the section on timing)
- Papers grew from 4 authors to nearly 300 (Figure 13, Figure 15)
Quotes you can use
Attributable as written, with the name and title. For a different angle or a quote on a specific figure, ask through the contact page.
We have the complete wiring of a fly and a worm, and one cubic millimetre of a mouse and of a human. A mouse brain is about 500 of those blocks and a human brain 1.5 million.
Leon Falkner, Data & Research Analyst, IQ Metrics ResearchProofreading, not the microscope, sets the pace: 33 person-years for a fly brain, 100,000 estimated for a mouse. Those two numbers are the whole debate.
Leon Falkner, Data & Research Analyst, IQ Metrics ResearchThe record connectome has grown about 60-fold per decade since 2013. Straight-line arithmetic reaches a mouse brain around 2040, but the Wellcome Trust says a decade, and we only report both.
Leon Falkner, Data & Research Analyst, IQ Metrics Research
Files
- CSV of every connectome, with neurons, synapses and how the paper counts them, volume, method, data size, effort, authors, institutions and DOI (CC BY 4.0)
- Every figure as a print-ready PNG: use the Image button under each figure
- Embed code and data table under every figure
- Share images for social media in three sizes, with the credit line built in
- Citations in APA, MLA, Chicago, BibTeX and plain text
Terms, contact and corrections
Credit: “IQ Metrics Research, How much of the brain have we mapped? (2026)” with a link to this page. On air or in print, “IQ Metrics” and the page address are enough.
What it covers: 21 reconstructions in 20 papers, 1986 to 2026, as of 5 November 2026; counts are the papers’ own, brain sizes are published estimates.
Contact: the research team, through the contact page. Corrections are made on this page with a dated note in the version history.
Related research