
Can you raise your IQ? 18 factors ranked in IQ points
We put 29 estimates for 18 things that research links to IQ on one scale, in IQ points, each with its study design, size and an evidence grade assigned by a rule written first: harms as well as gains, children and adults, 2005-2025.

By Leon Falkner, Data & Research Analyst · Reviewed by Aarav Vardhan, Editor-in-Chief · Published 12 November 2026 · 14 min read
About this study
- Report type
- Data study: our ledger of factors linked to IQ, every estimate in IQ points with an evidence grade
- Data
- 29 estimates for 18 factors (plus the Flynn effect as a ruler) from 22 primary sources
- Sources
- Meta-analyses, pooled analyses and large trials, read from abstracts and open full texts (Europe PMC, PubMed, OpenAlex)
- Years
- Sources published 2005 to 2025; look-ups as of 12 November 2026
- Licence
- CC BY 4.0 (our dataset and charts)
- Version
- 2026.11
- Sources
- 36
A little: the best-designed studies show gains of about 2 to 6 IQ points (a year of school +2.1, adoption +4.4, iron for anaemic children 8 and older +6.2), while brain training, music lessons and exercise shrink below 1 point. The largest differences are harms such as very preterm birth (-12.9). IQ Metrics ledger of 29 estimates, 18 factors, 2005-2025.
01 Key findings
- The best-designed gains are modest. One more year of school +2.1 IQ points (natural experiments), adoption +4.4 (sibling design), iron for children 8 and older +6.2 (randomised trials, clearest in anaemic children).Ritchie 2018, Kendler 2015, Sachdev 2005
- Popular boosts shrink. Working-memory training, music lessons and exercise each fall below 1 point in the stronger design.IQ Metrics calculation
- The weaker the design, the bigger the number. Median size 1.38 points at grade A, 5.25 at grade D, partly because the large harms can only be observed.IQ Metrics calculation
- The largest differences are harms: very preterm birth -12.9, severe brain injury -12.0, preterm birth -11.9; all from cohort studies, linked, not cause.Twilhaar 2018, Königs 2016, Kerr-Wilson 2012
- Exposure levels matter. Lead: the first 7.6 ug/dL cost 3.9 points. Fluoride: null below 1.5 mg/L in group comparisons; US community water is 0.7 mg/L.Lanphear 2005, Taylor 2025
02 Statistics to quote
harm estimates that come from a randomised, natural-experiment or within-family study: every measured harm rests on observational data.
IQ Metrics ledgermedian size in IQ points of grade A estimates against grade D estimates.
IQ Metrics calculationpopular gains (brain training, music lessons, exercise, plus breastfeeding) that fall below 1 IQ point in the stronger design.
IQ Metrics calculationIQ points for one more year of school (compulsory-schooling law changes, 42 data sets, 600,000+ people).
Ritchie and Tucker-Drob 2018IQ points for brothers adopted into another home vs those reared by their birth parents (436 sibships, Sweden).
Kendler et al. 2015IQ points: children born before 32 weeks vs full-term children (71 studies, 12,907 children).
Twilhaar et al. 2018IQ points as blood lead rises from 2.4 to 10 ug/dL (7 cohorts, 1,333 children).
Lanphear et al. 2005IQ points per 1 mg/L more fluoride in urine (13 studies, 4,475 children); group-level comparisons were null below 1.5 mg/L in water.
Taylor et al. 2025IQ points after frequent or dependent cannabis use in youth (7 cohorts, 6,116 young people, IQ before and after).
Power et al. 2021IQ points at age 5 after under an hour of general anaesthesia in infancy (randomised, 447 children).
McCann et al. 2019IQ-scale points on an online cognitive score after COVID-19 that resolved within 4 weeks (112,964 adults, England).
Hampshire et al. 2024IQ points per decade: the Flynn effect (271 samples, almost 4 million people, 1909-2013), our ruler.
Pietschnig and Voracek 201503 Can you raise your IQ?
You can raise an IQ score by about 2 to 6 points on average, according to the best-designed studies in our ledger: +2.1 points for one more year of school, +4.4 for adoption into another home and +6.2 for iron supplements in children aged 8 and older (clearest in children who were anaemic). These are average differences between groups in each study, not a promise for any one person.
IQ Metrics Research built the ledger on 12 November 2026 to put every factor on one scale. It has 29 estimates for 18 factors from 22 primary sources published 2005 to 2025: meta-analyses, pooled analyses and large trials. Each row gives the exposure exactly as printed (blood lead from 2.4 to 10 ug/dL, one extra year of school, fluoride per mg/L in urine), the effect in IQ points, the interval, the study design, the number of studies (k), the number of people (n) and the sentence from the source that holds the number. Standardised differences (d, g, SMD) are multiplied by 15, the standard deviation of the IQ scale, and labelled as our conversion.
Each row also carries an evidence grade, assigned by a rule we wrote before reading any number: A for randomised trials and natural experiments, B for within-family comparisons and for the looser estimate from a field that also has an A estimate, C for cohort studies with controls, D for cross-sectional or weak designs. Grade C and D rows are linked, not cause. 13 of the 29 estimates (45%) are graded A or B. The nearest earlier compilation, the Database of Raising Intelligence by Protzko, Aronson and Blair [29], pooled randomised trials in children from birth to kindergarten; our ledger adds harms, adults, meta-analyses to 2025, one grade per row and one open CSV.
- IQ point
- One point on a scale where the population average is 100 and the standard deviation (SD) is 15. A difference of 0.2 SD is 3 IQ points.
- Effect size (d, g, SMD)
- The difference between two group averages divided by the spread of scores. We multiply it by 15 to put it in IQ points (labelled IQ Metrics conversion).
- Randomised controlled trial (RCT)
- A study in which chance decides who gets the treatment, so the two groups differ, on average, only by the treatment.
- Natural experiment
- A rule outside the family decides who is exposed, such as a law that raises the school-leaving age for one birth year and not the one before.
- Within-family (sibling) design
- Brothers or sisters are compared with each other, so the parents, the home and much of the genes are held the same.
- Meta-analysis
- A study that pools the results of many studies on one question into one average estimate with an interval.
- 95% interval
- The range that the study’s data are compatible with. An interval that includes zero means the study cannot tell the effect apart from no effect.
- Flynn effect
- The rise in average IQ test scores across generations: about 0.28 full-scale points a year (1909-2013) in the largest meta-analysis [25].
04 Which factors raise or lower IQ the most?
Very preterm birth (-12.9 IQ points), severe traumatic brain injury (-12.0) and preterm birth in general (-11.9) are the largest differences in the ledger; the largest gain is iron supplements for children aged 8 and older (+6.2). Figure 1 puts all 29 estimates on one axis from -14 to +8 IQ points.
Every factor on one scale: 29 estimates in IQ points
Average difference between the exposed and unexposed groups in each source, in IQ points (SD 15); standardised differences x 15 (IQ Metrics conversion). Largest harm: very preterm birth, -12.9. Largest gain: iron in children 8 and older, +6.2. Orange: one decade of the Flynn effect, +2.8, as a ruler. As of 12 November 2026.
Source: IQ Metrics ledger of 22 sources; conversions by IQ Metrics
Data table
| label | value |
|---|---|
| Very preterm birth (before 32 weeks) (C) | -12.9 |
| Severe traumatic brain injury (C) | -12 |
| Preterm birth (before 37 weeks) (C) | -11.9 |
| Iodine deficiency in pregnancy (C) | -7.8 |
| Fluoride, higher vs lower exposure groups (D) | -6.8 |
| COVID-19, symptoms still present (long COVID) (D) | -6.3 |
| Mild traumatic brain injury (concussion) (C) | -5.5 |
| Being a twin (D) | -4.2 |
| Lead in the blood (childhood) (C) | -3.9 |
| COVID-19, symptoms gone within 4 weeks (D) | -3.5 |
| Frequent cannabis use in youth (C) | -2 |
| Binge drinking in pregnancy (C) | -1.9 |
| Fluoride, per 1 mg/L in urine (C) | -1.6 |
| Iodine tablets in mildly deficient pregnancy (A) | -0.7 |
| General anaesthesia in infancy (under 1 hour) (A) | -0.2 |
| Light-to-moderate drinking in pregnancy (C) | 0.6 |
| Working-memory training, vs active controls (A) | 0.8 |
| Exercise (RCTs, corrected for publication bias) (A) | 0.8 |
| Music lessons (randomised studies) (A) | 1 |
| Modafinil, one dose (healthy adults) (A) | 1.8 |
| One more year of school (A) | 2.1 |
| Working-memory training, vs no-contact controls (B) | 3 |
| Methylphenidate, one dose (healthy adults) (A) | 3.1 |
| Exercise (RCTs, uncorrected) (B) | 3.3 |
| Breastfeeding (observational studies) (C) | 3.4 |
| Music lessons (non-randomised studies) (C) | 3.7 |
| Adoption into a different home (B) | 4.4 |
| Breastfeeding promotion (randomised, PROBIT) (A) | 5.9 |
| Iron supplements (children 8 and older) (A) | 6.2 |
| Flynn effect, one decade (reference) | 2.8 |
Embed this chart
Paste this HTML into your page: it carries the numbers and the credit link to this figure.
The orange row is a ruler, not a factor. Average full-scale IQ scores rose by about 0.28 points a year, or +2.8 a decade, across 271 samples from 1909 to 2013 [25]. 18 of the 29 estimates are larger than one decade of that rise. The site’s explainer on why the Flynn effect has stalled tells the rest of that story.
Figure 2 shows the 23 estimates that come with a 95% interval. Pick harms, gains or no clear effect. An interval that crosses zero means the study cannot tell the effect apart from none: that is true of the randomised breastfeeding trial on full-scale IQ, of iodine tablets in mild deficiency and of anaesthesia in infancy. The squares are sized by the number of people in each source.
Every estimate with a 95% interval: 23 of 29
Square = estimate in IQ points (area = people in the source; smallest square = n not printed), line = 95% interval as printed, x 15 for standardised differences, or estimate +/- 1.96 SE where only an SE is printed (schooling, adoption: IQ Metrics calculation). No pooled estimate: the rows measure different things. As of 12 November 2026.
Difference in IQ points (exposed minus unexposed)
Source: IQ Metrics ledger; intervals as printed in each source
Data table
| factor | study | detail | n | estimate | ci_low | ci_high |
|---|---|---|---|---|---|---|
| Harms (9 with an interval) | Very preterm birth (before 32 weeks) | Grade C, meta-analysis of cohort studies | 12907 | -12.9 | -14.1 | -11.7 |
| Harms (9 with an interval) | Preterm birth (before 37 weeks) | Grade C, meta-analysis of cohort studies | 7044 | -11.9 | -13.4 | -10.5 |
| Harms (9 with an interval) | Fluoride, higher vs lower exposure groups | Grade D, meta-analysis, 64 of 74 studies cross-sectional | 20932 | -6.8 | -8.6 | -5 |
| Harms (9 with an interval) | COVID-19, symptoms still present (long COVID) | Grade D, cross-sectional (one online assessment) | 112964 | -6.3 | -8 | -4.7 |
| Harms (9 with an interval) | Lead in the blood (childhood) | Grade C, pooled analysis of 7 cohorts | 1333 | -3.9 | -5.3 | -2.4 |
| Harms (9 with an interval) | COVID-19, symptoms gone within 4 weeks | Grade D, cross-sectional (one online assessment) | 112964 | -3.5 | -5 | -1.9 |
| Harms (9 with an interval) | Frequent cannabis use in youth | Grade C, meta-analysis of cohort studies with IQ before and after | 6116 | -2 | -3 | -1 |
| Harms (9 with an interval) | Binge drinking in pregnancy | Grade C, meta-analysis of cohort studies | 10000 | -1.9 | -3.1 | -0.8 |
| Harms (9 with an interval) | Fluoride, per 1 mg/L in urine | Grade C, meta-analysis of individual-level studies (11 of 13 low risk of bias) | 4475 | -1.6 | -2.3 | -0.9 |
| Gains (7 with an interval) | One more year of school | Grade A, meta-analysis of natural experiments | 600000 | 2.1 | 0.9 | 3.2 |
| Gains (7 with an interval) | Working-memory training, vs no-contact controls | Grade B, meta-analysis of controlled trials, untreated controls | 300 | 3 | 1.6 | 4.2 |
| Gains (7 with an interval) | Exercise (RCTs, uncorrected) | Grade B, meta-analysis of RCTs, before correction | 300 | 3.3 | 2.4 | 4.2 |
| Gains (7 with an interval) | Breastfeeding (observational studies) | Grade C, meta-analysis of observational studies | 300 | 3.4 | 2.3 | 4.6 |
| Gains (7 with an interval) | Music lessons (non-randomised studies) | Grade C, meta-analysis of non-randomised trials | 6984 | 3.7 | 2.1 | 5.3 |
| Gains (7 with an interval) | Adoption into a different home | Grade B, within-family (sibling) design | 436 | 4.4 | 2.9 | 5.9 |
| Gains (7 with an interval) | Iron supplements (children 8 and older) | Grade A, meta-analysis of RCTs | 300 | 6.2 | 3 | 9.3 |
| No clear effect (7 with an interval) | Iodine tablets in mildly deficient pregnancy | Grade A, RCT | 313 | -0.7 | -2.9 | 1.5 |
| No clear effect (7 with an interval) | General anaesthesia in infancy (under 1 hour) | Grade A, RCT | 447 | -0.2 | -3.1 | 2.6 |
| No clear effect (7 with an interval) | Light-to-moderate drinking in pregnancy | Grade C, meta-analysis of cohort studies | 300 | 0.6 | 0 | 1.2 |
| No clear effect (7 with an interval) | Working-memory training, vs active controls | Grade A, meta-analysis of controlled trials, treated controls | 300 | 0.8 | -0.3 | 1.9 |
| No clear effect (7 with an interval) | Exercise (RCTs, corrected for publication bias) | Grade A, meta-analysis of RCTs (umbrella review of 24 meta-analyses) | 300 | 0.8 | -1.4 | 2.1 |
| No clear effect (7 with an interval) | Music lessons (randomised studies) | Grade A, meta-analysis of randomised studies | 6984 | 1 | -1.7 | 3.7 |
| No clear effect (7 with an interval) | Breastfeeding promotion (randomised, PROBIT) | Grade A, cluster RCT | 13889 | 5.9 | -1 | 12.8 |
Embed this chart
Paste this HTML into your page: it carries the numbers and the credit link to this figure.
05 What lowers IQ the most?
Being born very early lowers IQ scores the most in our ledger: children born before 32 weeks scored 0.86 SD, about -12.9 IQ points, below full-term children in 71 studies of 12,907 children [8]. A 2012 meta-analysis of all preterm births (before 37 weeks) found -11.9 points across 27 studies and 7,044 people [7]. Both are cohort comparisons: linked, not cause. Our premature birth explainer covers what gestational age predicts.
Head injuries come next. A 2016 meta-analysis of 81 studies and 3,890 patients put the full-scale IQ gap in the chronic phase at d = -0.80 (-12.0 points) after severe traumatic brain injury and d = -0.37 (-5.5) after mild injury, the kind most concussions are [13]. The same review put moderate injury at a smaller d = -0.19, so the mild figure is not a clean dose step, and these are patients seen in clinics. In the weeks after a mild injury the review found no full-scale IQ gap at all. Our concussion explainer reads those studies one by one.
Iodine deficiency in pregnancy is linked to 7.8 points lower scores (d = 0.52 across 9 cohort studies of children 5 and under) [5]; a 2005 meta-analysis of Chinese studies put the gap for severely deficient areas at 12.45 points [26]. Iodine tablets for mildly deficient pregnant women, tested in a randomised trial of 313 children in India and Thailand, changed verbal IQ by -0.7 points (95% interval -2.9 to 1.5) [6]: the harm of real deficiency does not mean extra iodine helps when deficiency is mild. More in our iodine explainer.
Lead is the classic dose question. In 1,333 children from seven cohorts, a rise in blood lead from 2.4 to 10 ug/dL was linked to 3.9 IQ points lower; the next 10 ug/dL cost 1.9 points and the 10 after that 1.1 [4]. Figure 3 draws the three steps: the first micrograms cost the most. Our lead explainer covers the other pollutants.
Lead: the first micrograms cost the most points
IQ points lost for each step up in blood lead, with 95% intervals, in the pooled analysis of 1,333 children from 7 cohorts (Lanphear 2005). Linked, not cause (cohort data).
Source: Lanphear et al. 2005 [4]
Data table
| label | low | estimate | high |
|---|---|---|---|
| 2.4 to 10 ug/dL | 2.4 | 3.9 | 5.3 |
| 10 to 20 ug/dL | 1.2 | 1.9 | 2.6 |
| 20 to 30 ug/dL | 0.7 | 1.1 | 1.5 |
Embed this chart
Paste this HTML into your page: it carries the numbers and the credit link to this figure.
Fluoride needs its exposure level named every time. In 59 studies with group-level measures (n = 20,932 children, 47 at high risk of bias), more-exposed groups scored SMD -0.45, about -6.8 points, lower; but the association was null when exposed groups were restricted to water below 1.5 mg/L [11]. In 13 studies that measured each child’s urine, each 1 mg/L more fluoride was linked to 1.63 points lower. The US Public Health Service level for community water is 0.7 mg/L, which none of these comparisons isolates. Our fluoride explainer sets out why the biggest studies disagree.
Smaller harms: frequent or dependent cannabis use in youth -2.0 points in 7 cohorts with IQ measured before and after [12] (see does weed lower IQ); binge drinking in pregnancy -1.9 points in 8 cohort studies of 10,000 children [10]; and being a twin -4.2 points in older birth cohorts, but 0.5 points in recent ones [9] (see twins and IQ). COVID-19 that cleared within 4 weeks was linked to 0.23 SD on an online cognitive score and long COVID to 0.42 SD [14]; the paper itself converts about 0.2 SD to 3 points on a 15-point IQ scale, but the tasks are not an IQ test and the design is cross-sectional (grade D). More in does COVID lower IQ.
06 How much can you increase your IQ?
The gains with the strongest designs are 2 to 6 IQ points. Ritchie and Tucker-Drob pooled 142 effect sizes from 42 data sets and over 600,000 people: one additional year of education raised scores by +2.06 points where a compulsory-schooling law changed, 1.197 points in studies that controlled for earlier IQ and 5.229 points at school-entry age cut-offs [16]. Our school explainer walks through those natural experiments.
Kendler and colleagues compared Swedish brothers in 436 families where one was adopted away and one was reared by a birth parent: the adopted brothers scored 4.41 points higher at conscription, and each step up in the adoptive parents’ education added 1.71 points [19]. Iron supplements raised IQ scores by SMD 0.41 (+6.2 points) in randomised trials of children aged 8 and older, most clearly in children who were anaemic or iron-deficient at the start, with no effect under 27 months [24].
In healthy adults, one dose of methylphenidate improved scores across cognitive tests by SMD 0.21 (+3.1 IQ-scale points) and modafinil by SMD 0.12 (+1.8) in placebo-controlled trials; d-amphetamine showed no effect [23]. Those are tests taken during one dose, not IQ tests, and the authors call the effects small. Our smart drugs explainer lists what each trial measured.
Early childhood programmes are the gap in the scale. The Database of Raising Intelligence pooled randomised trials from birth to kindergarten and reported that long-chain omega-3 supplements for infants, early educational programmes, interactive reading and preschool all raised the scores of young children [29]; its abstract prints no point values and the paper is paywalled, so those four are not rows here. The reading and IQ explainer covers what reading does later on.
The sibling design also removes a well-known harm. In 52,919 children of the US Collaborative Perinatal Project, the link between smoking in pregnancy and the intelligence of the child was entirely eliminated once siblings were compared within the same family [30]. The abstract prints no IQ number, so smoking is not a row; it is the clearest case in our reading of a cohort link that a within-family comparison does not confirm.
07 Do IQ boosts hold up in better studies?
Three of four popular gains fall below 1 IQ point when the stronger design is used. Working-memory training moved nonverbal ability by g = 0.20 (+3.0 points) against untreated controls but g = 0.05 (+0.8) against active controls, in 67 comparisons [20]. Music lessons: g = 0.246 (+3.7) in non-randomised studies, g = 0.064 (+1.0) in randomised ones [21]. Exercise: d = 0.22 (+3.3) in all randomised trials, d = 0.05 (+0.8) after correcting for publication bias [22].
Same factor, stronger study: three of four gains shrink below 1 point
Each row is one factor measured two ways in the same source or field: the weaker design and the stronger one (randomised or active controls). Working-memory training +3.0 -> +0.8, music lessons +3.7 -> +1.0, exercise +3.3 -> +0.8; breastfeeding moved the other way (+3.4 -> +5.9) but the randomised interval includes zero. As of 12 November 2026.
IQ points
Source: Melby-Lervåg 2016 [20]; Sala and Gobet 2020 [21]; Ciria 2023 [22]; Horta 2015 [17]; Kramer 2008 [18]; IQ Metrics conversion
Data table
| factor | Weaker design | Stronger design |
|---|---|---|
| Breastfeeding | 3.4 | 5.9 |
| Working-memory training | 3 | 0.8 |
| Music lessons | 3.7 | 1 |
| Exercise | 3.3 | 0.8 |
Embed this chart
Paste this HTML into your page: it carries the numbers and the credit link to this figure.
Breastfeeding moved the other way. Seventeen observational studies give +3.44 points [17] (2.62 in those that adjusted for the mother’s IQ), and an earlier US analysis found 0.52 points with an interval from -0.19 to 1.23 after the same adjustment [27]. The PROBIT cluster-randomised trial of 13,889 children in Belarus found +5.9 full-scale IQ points for breastfeeding promotion, but with an interval from -1.0 to +12.8, and +7.5 for verbal IQ [18]. Our breastfeeding explainer discusses that trial. The site’s explainers on dual n-back, music and the Mozart effect and exercise read the individual trials.
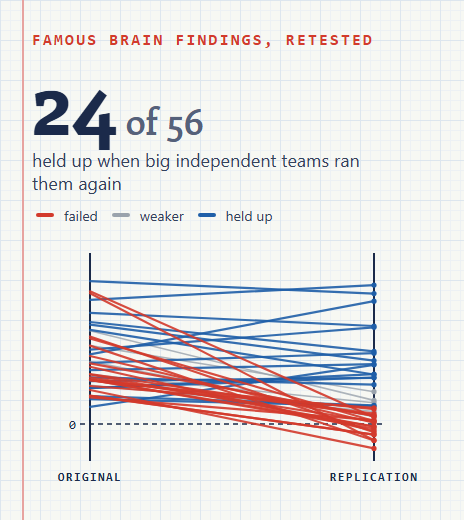
Across the whole ledger the pattern repeats: the median grade A estimate is 1.38 IQ points, grade B 3.30, grade C 3.79 and grade D 5.25 (Figure 5). Part of that gap is what each grade measures: the large harms can only be studied by observation, so they sit in grades C and D. The fairer test is the same factor measured both ways (Figure 4), where three of four gains shrink under the stronger design. Weaker designs let more of family background, publication habits and chance into the number. Our replication scorecard shows the same shrinkage in famous findings about the brain.
The weaker the design, the bigger the number
Size of each estimate (IQ points, ignoring direction) by evidence grade; each dot is one estimate, box = middle half, whiskers = smallest and largest. Median: A 1.38, B 3.30, C 3.79, D 5.25 points. As of 12 November 2026.
Size of the difference, IQ points.
Source: IQ Metrics ledger; quartiles by IQ Metrics
Data table
| grade | n | low | q1 | median | q3 | high |
|---|---|---|---|---|---|---|
| A: randomised or natural experiment | 10 | 0.2 | 0.8 | 1.4 | 2.9 | 6.2 |
| B: within-family or stricter-control | 3 | 3 | 3.1 | 3.3 | 3.9 | 4.4 |
| C: cohort with controls | 12 | 0.6 | 2 | 3.8 | 8.8 | 12.9 |
| D: cross-sectional or weak | 4 | 3.5 | 4 | 5.2 | 6.4 | 6.8 |
Embed this chart
Paste this HTML into your page: it carries the numbers and the credit link to this figure.
08 How strong is the evidence for each factor?
Fewer than half of the estimates (13 of 29, 45%) come from randomised trials, natural experiments or within-family designs: 10 grade A, 3 grade B, 12 grade C and 4 grade D. None of the 13 harms is graded A or B: lead, preterm birth or a head injury cannot ethically be assigned by chance.
13 of 29 estimates come from randomised, natural-experiment or within-family designs
One square per estimate, coloured by the evidence grade we assign by a rule written before collecting: A 10, B 3, C 12, D 4. Every square for a harm is grade C or D. As of 12 November 2026.
29 estimatesone square = one estimate
Source: IQ Metrics grading (data/GRADE-RULE.md)
Data table
| estimate | group | label | detail |
|---|---|---|---|
| iron | A: randomised or natural experiment | Iron supplements (children 8 and older) | Iron supplements (children 8 and older): +6.2 IQ points (95% interval +3.0 to +9.3), iron supplementation vs control, children aged 8 years or older; grade A; n not printed. Printed: SMD = 0.41 (95% CI 0.20 to 0.62) |
| breast-rct | A: randomised or natural experiment | Breastfeeding promotion (randomised, PROBIT) | Breastfeeding promotion (randomised, PROBIT): +5.9 IQ points (95% interval -1.0 to +12.8), breastfeeding promotion (Baby-Friendly model) vs usual care, 31 Belarusian maternity hospitals; grade A; k = 1, n = 13,889 children. Printed: +5.9 (95% CI -1.0 to +12.8) |
| mph | A: randomised or natural experiment | Methylphenidate, one dose (healthy adults) | Methylphenidate, one dose (healthy adults): +3.1 IQ points (no interval printed), methylphenidate vs placebo, healthy non-sleep-deprived adults; grade A; k = 24. Printed: SMD = 0.21 (p = .0004) |
| school | A: randomised or natural experiment | One more year of school | One more year of school: +2.1 IQ points (95% interval +0.9 to +3.2), one additional year of education (compulsory-schooling policy changes); grade A; k = 42, n = 600,000 over 600,000 participants, 42 data sets. Printed: 2.056 IQ points (SE 0.583) |
| modafinil | A: randomised or natural experiment | Modafinil, one dose (healthy adults) | Modafinil, one dose (healthy adults): +1.8 IQ points (no interval printed), modafinil vs placebo, healthy non-sleep-deprived adults; grade A; k = 14. Printed: SMD = 0.12 (p = .01) |
| music-rand | A: randomised or natural experiment | Music lessons (randomised studies) | Music lessons (randomised studies): +1.0 IQ points (95% interval -1.7 to +3.7), music training vs controls, randomised studies; grade A; k = 54, n = 6,984 children. Printed: g = 0.064 (95% CI -0.116 to 0.244) |
| wm-active | A: randomised or natural experiment | Working-memory training, vs active controls | Working-memory training, vs active controls: +0.8 IQ points (95% interval -0.3 to +1.9), working-memory training vs treated controls; grade A; k = 67. Printed: g = 0.05 (95% CI -0.02 to 0.13) |
| exercise-strict | A: randomised or natural experiment | Exercise (RCTs, corrected for publication bias) | Exercise (RCTs, corrected for publication bias): +0.8 IQ points (95% interval -1.4 to +2.1), exercise vs control, healthy people, after correcting for publication bias; grade A; k = 24. Printed: d = 0.05 (95% CI -0.09 to 0.14) |
| iodine-mild | A: randomised or natural experiment | Iodine tablets in mildly deficient pregnancy | Iodine tablets in mildly deficient pregnancy: -0.7 IQ points (95% interval -2.9 to +1.5), 200 ug iodine a day vs placebo, mildly iodine-deficient pregnant women; grade A; k = 1, n = 313 children. Printed: -0.7 points (95% CI -2.9 to 1.5) |
| anaesthesia | A: randomised or natural experiment | General anaesthesia in infancy (under 1 hour) | General anaesthesia in infancy (under 1 hour): -0.2 IQ points (95% interval -3.1 to +2.6), sevoflurane general anaesthesia vs awake-regional anaesthesia, infants under 60 weeks postmenstrual age; grade A; k = 1, n = 447 children. Printed: awake-regional minus general = 0.23 (95% CI -2.59 to 3.06) |
| adoption | B: within-family or stricter-control | Adoption into a different home | Adoption into a different home: +4.4 IQ points (95% interval +2.9 to +5.9), adopted-away vs home-reared full brothers; grade B; k = 1, n = 436 full-sibships. Printed: 4.41 points (SE 0.75) |
| exercise-raw | B: within-family or stricter-control | Exercise (RCTs, uncorrected) | Exercise (RCTs, uncorrected): +3.3 IQ points (95% interval +2.4 to +4.2), exercise vs control, healthy people, all primary RCTs; grade B; k = 24. Printed: d = 0.22 (95% CI 0.16 to 0.28) |
| wm-passive | B: within-family or stricter-control | Working-memory training, vs no-contact controls | Working-memory training, vs no-contact controls: +3.0 IQ points (95% interval +1.6 to +4.2), working-memory training vs untreated controls; grade B; k = 53. Printed: g = 0.20 (95% CI 0.11 to 0.28) |
| verypreterm | C: cohort with controls | Very preterm birth (before 32 weeks) | Very preterm birth (before 32 weeks): -12.9 IQ points (95% interval -14.1 to -11.7), born before 32 weeks vs full term; grade C; k = 71, n = 12,907 children. Printed: 0.86 SD lower (95% CI -0.94 to -0.78) |
| tbi-severe | C: cohort with controls | Severe traumatic brain injury | Severe traumatic brain injury: -12.0 IQ points (no interval printed), severe TBI, chronic phase of recovery; grade C; k = 81, n = 3,890 patients. Printed: d = -0.80 |
| preterm | C: cohort with controls | Preterm birth (before 37 weeks) | Preterm birth (before 37 weeks): -11.9 IQ points (95% interval -13.4 to -10.5), born preterm vs at term; grade C; k = 27, n = 7,044 people. Printed: 11.94 points lower (95% CI 10.47-13.42) |
| iodine | C: cohort with controls | Iodine deficiency in pregnancy | Iodine deficiency in pregnancy: -7.8 IQ points (no interval printed), iodine-deficient vs iodine-replete mothers (9 cohort studies); grade C; k = 9. Printed: d = 0.52 (9 cohort studies) |
| tbi-mild | C: cohort with controls | Mild traumatic brain injury (concussion) | Mild traumatic brain injury (concussion): -5.5 IQ points (no interval printed), mild TBI, chronic phase of recovery; grade C; k = 81, n = 3,890 patients. Printed: d = -0.37 |
| lead | C: cohort with controls | Lead in the blood (childhood) | Lead in the blood (childhood): -3.9 IQ points (95% interval -5.3 to -2.4), blood lead 2.4 -> 10 ug/dL; grade C; k = 7, n = 1,333 children. Printed: 3.9 IQ points lower (95% CI 2.4-5.3) |
| music-nonrand | C: cohort with controls | Music lessons (non-randomised studies) | Music lessons (non-randomised studies): +3.7 IQ points (95% interval +2.1 to +5.3), music training vs controls, non-randomised studies; grade C; k = 54, n = 6,984 children. Printed: g = 0.246 (95% CI 0.140 to 0.352) |
| breast-obs | C: cohort with controls | Breastfeeding (observational studies) | Breastfeeding (observational studies): +3.4 IQ points (95% interval +2.3 to +4.6), breastfed vs not breastfed; grade C; k = 17. Printed: 3.44 points (95% CI 2.30 to 4.58) |
| cannabis | C: cohort with controls | Frequent cannabis use in youth | Frequent cannabis use in youth: -2.0 IQ points (95% interval -3.0 to -1.0), frequent or dependent cannabis use in youth vs none, IQ before and after; grade C; k = 7, n = 6,116 young people. Printed: d = -0.132 (95% CI -0.198 to -0.066) |
| binge | C: cohort with controls | Binge drinking in pregnancy | Binge drinking in pregnancy: -1.9 IQ points (95% interval -3.1 to -0.8), any binge prenatal alcohol exposure vs none; grade C; k = 8, n = 10,000 children. Printed: d = -0.13 (95% CI -0.21 to -0.05) |
| fluoride-urine | C: cohort with controls | Fluoride, per 1 mg/L in urine | Fluoride, per 1 mg/L in urine: -1.6 IQ points (95% interval -2.3 to -0.9), each 1 mg/L more fluoride in urine; grade C; k = 13, n = 4,475 children. Printed: 1.63 points lower per 1 mg/L (95% CI -2.33 to -0.93) |
| milddrink | C: cohort with controls | Light-to-moderate drinking in pregnancy | Light-to-moderate drinking in pregnancy: +0.6 IQ points (95% interval 0.0 to +1.2), mild-to-moderate prenatal alcohol exposure vs none; grade C; n not printed. Printed: d = 0.04 (95% CI 0.00 to 0.08), not significant without one large study |
| fluoride-group | D: cross-sectional or weak | Fluoride, higher vs lower exposure groups | Fluoride, higher vs lower exposure groups: -6.8 IQ points (95% interval -8.6 to -5.0), higher vs lower fluoride exposure groups (drinking water, dental fluorosis or other group-level measures); grade D; k = 59, n = 20,932 children. Printed: SMD -0.45 (95% CI -0.57 to -0.33) |
| covid-long | D: cross-sectional or weak | COVID-19, symptoms still present (long COVID) | COVID-19, symptoms still present (long COVID): -6.3 IQ points (95% interval -8.0 to -4.7), unresolved persistent symptoms vs no COVID-19; grade D; k = 1, n = 112,964 adults. Printed: -0.42 SD (95% CI -0.53 to -0.31) |
| twins | D: cross-sectional or weak | Being a twin | Being a twin: -4.2 IQ points (no interval printed), twins vs singletons; grade D; n not printed. Printed: 4.2 IQ points lower |
| covid-short | D: cross-sectional or weak | COVID-19, symptoms gone within 4 weeks | COVID-19, symptoms gone within 4 weeks: -3.5 IQ points (95% interval -5.0 to -1.9), COVID-19 resolved in under 4 weeks vs no COVID-19; grade D; k = 1, n = 112,964 adults. Printed: -0.23 SD (95% CI -0.33 to -0.13) |
Embed this chart
Paste this HTML into your page: it carries the numbers and the credit link to this figure.
Grade A rows cluster in the “no clear effect” group: 6 of the 7 estimates with no clear effect are randomised or natural experiments, among them anaesthesia in infancy, where under an hour of general anaesthesia changed full-scale IQ at 5 by -0.23 points (95% interval -3.06 to 2.59) in 447 children [15].
Harms rest on observational studies; most "no clear effect" rows are randomised
Estimates per group, split by evidence grade. Harms: 13 (all C or D). Gains: 9. No clear effect: 7, of which 6 are grade A. As of 12 November 2026.
Source: IQ Metrics ledger and grading
Data table
| group | A: randomised or natural experiment | B: within-family or stricter-control | C: cohort with controls | D: cross-sectional or weak | total |
|---|---|---|---|---|---|
| Harms | 9 | 4 | 13 | ||
| Gains | 4 | 3 | 2 | 9 | |
| No clear effect | 6 | 1 | 7 |
Embed this chart
Paste this HTML into your page: it carries the numbers and the credit link to this figure.
09 At what age do factors affect IQ the most?
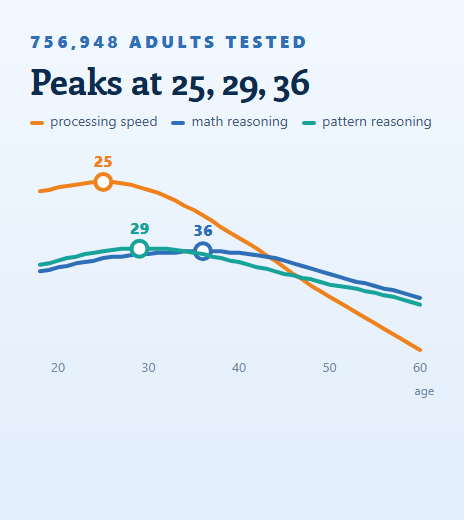
Before birth: 5 of the 13 harm estimates concern the prenatal period (preterm birth, iodine, alcohol, being a twin), and the largest harm in early childhood is lead. Gains spread across school age (schooling, iron, music) and all ages (training, exercise). The screen-time question, covered in our screen time explainer, has no IQ-scale estimate we could add. The age at which scores peak is in our peak brain age study.
Most measured harms happen before birth
Number of estimates by life stage of the exposure and by group. Prenatal: 5 harms (preterm birth, iodine, alcohol, being a twin). Adult rows are COVID-19 and one-dose drug trials. As of 12 November 2026.
Source: IQ Metrics ledger
Data table
| life stage | Harm | Gain | No clear effect |
|---|---|---|---|
| Prenatal | 5 | 2 | |
| Early childhood | 1 | 2 | 2 |
| School age | 2 | 3 | 1 |
| Adolescence | 1 | ||
| Adult | 2 | 2 | |
| All ages | 2 | 2 | 2 |
Embed this chart
Paste this HTML into your page: it carries the numbers and the credit link to this figure.
10 Does newer research find smaller effects on IQ?
Yes, modestly: the rank correlation between publication year and the size of an estimate is -0.25 across 29 estimates, and the median size falls from 5.05 points before 2015 (8 estimates) to 3.15 from 2015 on (21). Part of that is design: most of the randomised and bias-corrected rows are recent.
Newer evidence, smaller numbers
Each bubble is one estimate by publication year (across) and IQ points (up); area = people in the source (18 estimates that print n). Rank correlation between year and the size of the effect, all 29 estimates: -0.25; median size 5.05 points before 2015 (8 estimates) vs 3.15 from 2015 on (21). As of 12 November 2026.
Difference in IQ points
Publication year
Source: IQ Metrics ledger
Data table
| estimate | year | iq_points | group | n |
|---|---|---|---|---|
| Lead in the blood (childhood) | 2005 | -3.9 | C | 1333 |
| Iodine tablets in mildly deficient pregnancy | 2017 | -0.7 | A | 313 |
| Preterm birth (before 37 weeks) | 2012 | -11.9 | C | 7044 |
| Very preterm birth (before 32 weeks) | 2018 | -12.9 | C | 12907 |
| Binge drinking in pregnancy | 2014 | -1.9 | C | 10000 |
| Fluoride, higher vs lower exposure groups | 2025 | -6.8 | D | 20932 |
| Fluoride, per 1 mg/L in urine | 2025 | -1.6 | C | 4475 |
| Frequent cannabis use in youth | 2021 | -2 | C | 6116 |
| Mild traumatic brain injury (concussion) | 2016 | -5.5 | C | 3890 |
| Severe traumatic brain injury | 2016 | -12 | C | 3890 |
| COVID-19, symptoms gone within 4 weeks | 2024 | -3.5 | D | 112964 |
| COVID-19, symptoms still present (long COVID) | 2024 | -6.3 | D | 112964 |
| General anaesthesia in infancy (under 1 hour) | 2019 | -0.2 | A | 447 |
| One more year of school | 2018 | 2.1 | A | 600000 |
| Breastfeeding promotion (randomised, PROBIT) | 2008 | 5.9 | A | 13889 |
| Adoption into a different home | 2015 | 4.4 | B | 436 |
| Music lessons (randomised studies) | 2020 | 1 | A | 6984 |
| Music lessons (non-randomised studies) | 2020 | 3.7 | C | 6984 |
Embed this chart
Paste this HTML into your page: it carries the numbers and the credit link to this figure.
Most estimates are small. 18 of the 29 lie between -4 and +4 points (Figure 9); only preterm birth, severe brain injury, iodine deficiency and fluoride at group level pass 6 points in either direction, and all four are linked, not cause.
Most estimates sit within 4 points of zero
29 estimates in 2-point bins. 18 of 29 lie between -4 and +4 points; median size 3.4 points. As of 12 November 2026.
Difference in IQ points
Source: IQ Metrics ledger
Data table
| from | to | estimates |
|---|---|---|
| -14 | -12 | 1 |
| -12 | -10 | 2 |
| -10 | -8 | 0 |
| -8 | -6 | 3 |
| -6 | -4 | 2 |
| -4 | -2 | 2 |
| -2 | 0 | 5 |
| 0 | 2 | 5 |
| 2 | 4 | 6 |
| 4 | 6 | 2 |
| 6 | 8 | 1 |
Embed this chart
Paste this HTML into your page: it carries the numbers and the credit link to this figure.
11 Can IQ scores change?
Yes: every estimate in the ledger is a change or a difference in scores, from -12.9 to +6.2 points. An IQ score also moves for reasons that are not about ability, such as practice with the test, the language it is taken in and the age of a child within the school year. Our explainers on how IQ changes over time, the practice effect, testing in a second language and the relative age effect cover those, and the factors that affect IQ test results page lists the test-day ones.
12 What does this ledger mean, and what does it not?
The ledger says how large the average difference between groups was in each source, how strong the design was and how many people were studied. It does not say what will happen to one person, and it is not medical or parenting advice. A grade C harm such as lead is linked to lower scores in cohort data; a grade A row with no clear effect, such as anaesthesia in infancy, means the trial found no measurable difference at that dose and age.
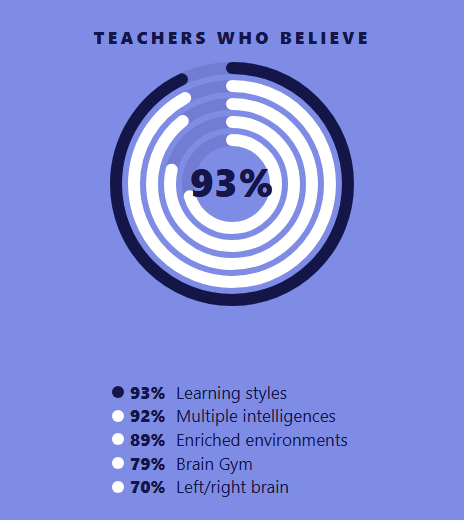
The popular routes to a higher score did not hold up in the strongest designs we found: brain training, music lessons and exercise each fall below 1 point. Chess, video games and creatine could not be scored at all: their sources print no usable IQ-scale number (see the list below and our explainers on chess, video games, reading and creatine). For myths about brain training and learning styles, see our neuromyths study and the brain statistics fact-check.
Where do you stand today?
None of these numbers can tell one person’s score. Our IQ test measures pattern reasoning and compares your result with adults, with a percentile.
Take the IQ test13 Every factor in our ledger
Every estimate in the ledger (30 rows)
Click a heading to sort. IQ points = printed points, or a standardised difference x 15 (IQ Metrics conversion). Grades by the rule in our method. As of 12 November 2026.
| Very preterm birth (before 32 weeks) | born before 32 weeks vs full term | harm | -12.9 | C | 71 | 12,907 | 2,018 | [8] | Our explainer |
| Severe traumatic brain injury | severe TBI, chronic phase of recovery | harm | -12.0 | C | 81 | 3,890 | 2,016 | [13] | Our explainer |
| Preterm birth (before 37 weeks) | born preterm vs at term | harm | -11.94 | C | 27 | 7,044 | 2,012 | [7] | Our explainer |
| Iodine deficiency in pregnancy | iodine-deficient vs iodine-replete mothers (9 cohort studies) | harm | -7.8 | C | 9 | 2,013 | [5] | Our explainer | |
| Fluoride, higher vs lower exposure groups | higher vs lower fluoride exposure groups (drinking water, dental fluorosis or other group-level measures) | harm | -6.75 | D | 59 | 20,932 | 2,025 | [11] | Our explainer |
| COVID-19, symptoms still present (long COVID) | unresolved persistent symptoms vs no COVID-19 | harm | -6.3 | D | 1 | 112,964 | 2,024 | [14] | Our explainer |
| Mild traumatic brain injury (concussion) | mild TBI, chronic phase of recovery | harm | -5.55 | C | 81 | 3,890 | 2,016 | [13] | Our explainer |
| Being a twin | twins vs singletons | harm | -4.2 | D | 2,008 | [9] | Our explainer | ||
| Lead in the blood (childhood) | blood lead 2.4 -> 10 ug/dL | harm | -3.9 | C | 7 | 1,333 | 2,005 | [4] | Our explainer |
| COVID-19, symptoms gone within 4 weeks | COVID-19 resolved in under 4 weeks vs no COVID-19 | harm | -3.45 | D | 1 | 112,964 | 2,024 | [14] | Our explainer |
| Frequent cannabis use in youth | frequent or dependent cannabis use in youth vs none, IQ before and after | harm | -1.98 | C | 7 | 6,116 | 2,021 | [12] | Our explainer |
| Binge drinking in pregnancy | any binge prenatal alcohol exposure vs none | harm | -1.95 | C | 8 | 10,000 | 2,014 | [10] | |
| Fluoride, per 1 mg/L in urine | each 1 mg/L more fluoride in urine | harm | -1.63 | C | 13 | 4,475 | 2,025 | [11] | Our explainer |
| Iodine tablets in mildly deficient pregnancy | 200 ug iodine a day vs placebo, mildly iodine-deficient pregnant women | no clear effect | -0.7 | A | 1 | 313 | 2,017 | [6] | Our explainer |
| General anaesthesia in infancy (under 1 hour) | sevoflurane general anaesthesia vs awake-regional anaesthesia, infants under 60 weeks postmenstrual age | no clear effect | -0.23 | A | 1 | 447 | 2,019 | [15] | |
| Light-to-moderate drinking in pregnancy | mild-to-moderate prenatal alcohol exposure vs none | no clear effect | 0.6 | C | 2,014 | [10] | |||
| Working-memory training, vs active controls | working-memory training vs treated controls | no clear effect | 0.75 | A | 67 | 2,016 | [20] | Our explainer | |
| Exercise (RCTs, corrected for publication bias) | exercise vs control, healthy people, after correcting for publication bias | no clear effect | 0.75 | A | 24 | 2,023 | [22] | Our explainer | |
| Music lessons (randomised studies) | music training vs controls, randomised studies | no clear effect | 0.96 | A | 54 | 6,984 | 2,020 | [21] | Our explainer |
| Modafinil, one dose (healthy adults) | modafinil vs placebo, healthy non-sleep-deprived adults | gain | 1.8 | A | 14 | 2,020 | [23] | Our explainer | |
| One more year of school | one additional year of education (compulsory-schooling policy changes) | gain | 2.06 | A | 42 | 600,000 | 2,018 | [16] | Our explainer |
| Flynn effect: one decade of rising scores (reference) | one decade later (1909-2013) | reference | 2.8 | ref | 271 | 4,000,000 | 2,015 | [25] | Our explainer |
| Working-memory training, vs no-contact controls | working-memory training vs untreated controls | gain | 3.0 | B | 53 | 2,016 | [20] | Our explainer | |
| Methylphenidate, one dose (healthy adults) | methylphenidate vs placebo, healthy non-sleep-deprived adults | gain | 3.15 | A | 24 | 2,020 | [23] | Our explainer | |
| Exercise (RCTs, uncorrected) | exercise vs control, healthy people, all primary RCTs | gain | 3.3 | B | 24 | 2,023 | [22] | Our explainer | |
| Breastfeeding (observational studies) | breastfed vs not breastfed | gain | 3.44 | C | 17 | 2,015 | [17] | Our explainer | |
| Music lessons (non-randomised studies) | music training vs controls, non-randomised studies | gain | 3.69 | C | 54 | 6,984 | 2,020 | [21] | Our explainer |
| Adoption into a different home | adopted-away vs home-reared full brothers | gain | 4.41 | B | 1 | 436 | 2,015 | [19] | |
| Breastfeeding promotion (randomised, PROBIT) | breastfeeding promotion (Baby-Friendly model) vs usual care, 31 Belarusian maternity hospitals | no clear effect | 5.9 | A | 1 | 13,889 | 2,008 | [18] | Our explainer |
| Iron supplements (children 8 and older) | iron supplementation vs control, children aged 8 years or older | gain | 6.15 | A | 2,005 | [24] |
Source: IQ Metrics ledger; quotes and DOIs in the CSV
Factors we looked up and could not put on the scale
A factor missing here or in the ledger is not proof of no effect: it means we could not verify a number. As of 12 November 2026.
| Factor (lead source) | Why it is not a row | Status |
|---|---|---|
| Mozart effect (Pietschnig 2010) | The publisher withholds the abstract from every index we read; no open text | Dropped |
| Dual n-back training (Au 2015) | The abstract prints no effect size; the open copy refused the download | Covered by the working-memory rows |
| Chess lessons (Sala and Gobet 2016) | The pooled outcome mixes maths and reading with cognitive skills (inclusion rule 2) | Dropped |
| Action video games (Sala 2018) | The abstract reports small or null effects without a number | Dropped |
| Creatine (Avgerinos 2018) | A systematic review of 6 trials (281 people) with no pooled effect | Dropped |
| Bilingualism (Lehtonen 2018) | Outcome is executive function, not an IQ-type score | Dropped |
| Birth order (Rohrer 2015; Kristensen and Bjerkedal 2007) | Neither abstract prints the IQ difference | Dropped |
| Maternal smoking (Gilman 2008) | The sibling analysis erases the IQ link, but the abstract prints no IQ number | In the text only |
| Early education, interactive reading, omega-3 (Protzko 2013) | The abstract names the gains without numbers; the paper is paywalled | In the text only |
| Cannabis, Dunedin (Meier 2012) | The abstract prints no IQ number; the 2021 meta-analysis is used instead | In the text only |
| Relative age in class | The sources measure school test scores, not IQ-type scores | Dropped |
Source: IQ Metrics screening notes (iq-ledger/HANDOFF.md)
14 How we built the dataset
- 01
Rules first
On 12 November 2026, before any number was read, we wrote the inclusion rule (an exposure or intervention, an IQ-type outcome, a printed effect in points or a standardised difference, a primary source) and the grade rule (A to D by design; looser estimates drop one grade).
- 02
Look-ups
We looked up 35 papers by DOI in Europe PMC and OpenAlex, then read complete abstracts from PubMed and open full texts or author manuscripts where the abstract stopped short.
- 03
Quotes
Every printed number in the ledger sits inside a sentence copied from the source; a script checks that each sentence appears word for word in the cached text before the ledger is written.
- 04
Conversion
Standardised differences x 15 = IQ points (IQ Metrics conversion); where only an SE is printed, the interval is the estimate +/- 1.96 SE (IQ Metrics calculation).
- 05
Checks
The analysis script runs over 400 checks: signs match groups, intervals hold estimates, conversions match the printed values, every page link is on iqmetrics.org.
From 35 papers looked up to 18 factors on the scale
Papers looked up by DOI (34 named leads plus one birth-order lead), those with an abstract or open text we could read by script, those that print an effect on an IQ-type outcome we could verify word for word, and the factors kept. As of 12 November 2026.
Source: IQ Metrics count; Europe PMC, PubMed and OpenAlex look-ups
Data table
| stage | count | pct_of_first | pct_of_previous |
|---|---|---|---|
| Papers looked up | 35 | 100 | 100 |
| Abstract or open text read | 34 | 97.1 | 97.1 |
| Print a usable effect on an IQ-type outcome | 22 | 62.9 | 64.7 |
| Factors on the scale | 18 | 51.4 | 81.8 |
Embed this chart
Paste this HTML into your page: it carries the numbers and the credit link to this figure.
Read every number with these in mind
- Rows measure different things: a full-scale IQ, a nonverbal score, a global cognitive score from online tasks. Converting them to one scale makes them comparable in size, not identical in meaning.
- The ledger is a lower bound. Factors whose sources print no usable number are listed as not scored, which is not proof of no effect.
- Grade C and D rows are linked, not cause: unmeasured differences between families can explain them.
- k and n are those printed by each source; for some rows they describe the whole review rather than the subset used.
- Effects are averages across groups in studies; they do not predict what will happen to one person.
Sources
- OurResearch. OpenAlex works API: DOI look-ups for metadata, retraction flags and abstracts. 2026. openalex.orgCC0: "Every record is released under a CC0 public-domain license" (help.openalex.org); used for metadata only
- EMBL-EBI. Europe PMC REST API: abstracts, article licences and open full texts. 2026. europepmc.org/RestfulWebServiceEach text keeps its article licence; facts cited only
- US National Library of Medicine. PubMed E-utilities: complete abstracts of seven papers (the Europe PMC search text cuts at a "<" sign). 2026. www.ncbi.nlm.nih.gov/books/NBK25501NLM data; abstracts keep the publisher's copyright: facts cited only
- Environmental health perspectives. Lanphear et al. (2005). Low-level environmental lead exposure and children's intellectual function: an international pooled analysis. Environmental health perspectives. 2005. doi.org/10.1289/ehp.7688Public domain / CC0 (as recorded by Europe PMC; Environmental Health Perspectives): facts and short quotes cited
- Nutrients. Bougma et al. (2013). Iodine and mental development of children 5 years old and under: a systematic review and meta-analysis. Nutrients. 2013. doi.org/10.3390/nu5041384CC BY (article licence as recorded by Europe PMC): facts and short quotes cited
- The lancet. Diabetes & endocrinology. Gowachirapant et al. (2017). Effect of iodine supplementation in pregnant women on child neurodevelopment: a randomised, double-blind, placebo-controlled trial. The lancet. Diabetes & endocrinology. 2017. doi.org/10.1016/S2213-8587(17)30332-7Publisher copyright: facts cited only (effect, interval, k, n, design)
- Journal of public health (Oxford, England). Kerr-Wilson et al. (2012). Meta-analysis of the association between preterm delivery and intelligence. Journal of public health (Oxford, England). 2012. doi.org/10.1093/pubmed/fdr024Publisher copyright: facts cited only (effect, interval, k, n, design)
- JAMA pediatrics. Twilhaar et al. (2018). Cognitive Outcomes of Children Born Extremely or Very Preterm Since the 1990s and Associated Risk Factors: A Meta-analysis and Meta-regression. JAMA pediatrics. 2018. doi.org/10.1001/jamapediatrics.2017.5323Publisher copyright: facts cited only (effect, interval, k, n, design)
- Psychological reports. Voracek and Haubner (2008). Twin-singleton differences in intelligence: a meta-analysis. Psychological reports. 2008. doi.org/10.2466/pr0.102.3.951-962Publisher copyright: facts cited only (effect, interval, k, n, design)
- Alcoholism, clinical and experimental research. Flak et al. (2014). The association of mild, moderate, and binge prenatal alcohol exposure and child neuropsychological outcomes: a meta-analysis. Alcoholism, clinical and experimental research. 2014. doi.org/10.1111/acer.12214Publisher copyright: facts cited only (effect, interval, k, n, design)
- JAMA pediatrics. Taylor et al. (2025). Fluoride Exposure and Children's IQ Scores: A Systematic Review and Meta-Analysis. JAMA pediatrics. 2025. doi.org/10.1001/jamapediatrics.2024.5542CC BY (article licence as recorded by Europe PMC): facts and short quotes cited
- Psychological medicine. Power et al. (2021). Intelligence quotient decline following frequent or dependent cannabis use in youth: a systematic review and meta-analysis of longitudinal studies. Psychological medicine. 2021. doi.org/10.1017/S0033291720005036CC BY (article licence as recorded by Europe PMC): facts and short quotes cited
- European journal of neurology. Königs et al. (2016). Intelligence after traumatic brain injury: meta-analysis of outcomes and prognosis. European journal of neurology. 2016. doi.org/10.1111/ene.12719Publisher copyright: facts cited only (effect, interval, k, n, design)
- The New England journal of medicine. Hampshire et al. (2024). Cognition and Memory after Covid-19 in a Large Community Sample. The New England journal of medicine. 2024. doi.org/10.1056/NEJMoa2311330CC BY (article licence as recorded by Europe PMC): facts and short quotes cited
- Lancet (London, England). McCann et al. (GAS Consortium) (2019). Neurodevelopmental outcome at 5 years of age after general anaesthesia or awake-regional anaesthesia in infancy (GAS): an international, multicentre, randomised, controlled equivalence trial. Lancet (London, England). 2019. doi.org/10.1016/S0140-6736(18)32485-1CC BY (article licence as recorded by Europe PMC): facts and short quotes cited
- Psychological science. Ritchie and Tucker-Drob (2018). How Much Does Education Improve Intelligence? A Meta-Analysis. Psychological science. 2018. doi.org/10.1177/0956797618774253Author accepted manuscript in the University of Edinburgh repository (pure.ed.ac.uk); publisher copyright: facts cited only
- Acta paediatrica (Oslo, Norway : 1992). Horta, Loret de Mola and Victora (2015). Breastfeeding and intelligence: a systematic review and meta-analysis. Acta paediatrica (Oslo, Norway : 1992). 2015. doi.org/10.1111/apa.13139CC BY (article licence as recorded by Europe PMC): facts and short quotes cited
- Archives of general psychiatry. Kramer et al. (PROBIT) (2008). Breastfeeding and child cognitive development: new evidence from a large randomized trial. Archives of general psychiatry. 2008. doi.org/10.1001/archpsyc.65.5.578Publisher copyright: facts cited only (effect, interval, k, n, design)
- Proceedings of the National Academy of Sciences of the United States of America. Kendler et al. (2015). Family environment and the malleability of cognitive ability: a Swedish national home-reared and adopted-away cosibling control study. Proceedings of the National Academy of Sciences of the United States of America. 2015. doi.org/10.1073/pnas.1417106112Publisher copyright: facts cited only (effect, interval, k, n, design)
- Perspectives on psychological science : a journal of the Association for Psychological Science. Melby-Lervåg, Redick and Hulme (2016). Working Memory Training Does Not Improve Performance on Measures of Intelligence or Other Measures of "Far Transfer": Evidence From a Meta-Analytic Review. Perspectives on psychological science : a journal of the Association for Psychological Science. 2016. doi.org/10.1177/1745691616635612Publisher copyright: facts cited only (effect, interval, k, n, design)
- Memory & cognition. Sala and Gobet (2020). Cognitive and academic benefits of music training with children: A multilevel meta-analysis. Memory & cognition. 2020. doi.org/10.3758/s13421-020-01060-2CC BY (article licence as recorded by Europe PMC): facts and short quotes cited
- Nature human behaviour. Ciria et al. (2023). An umbrella review of randomized control trials on the effects of physical exercise on cognition. Nature human behaviour. 2023. doi.org/10.1038/s41562-023-01554-4Publisher copyright: facts cited only (effect, interval, k, n, design)
- European neuropsychopharmacology : the journal of the European College of Neuropsychopharmacology. Roberts et al. (2020). How effective are pharmaceuticals for cognitive enhancement in healthy adults? A series of meta-analyses of cognitive performance during acute administration of modafinil, methylphenidate and D-amphetamine. European neuropsychopharmacology : the journal of the European College of Neuropsychopharmacology. 2020. doi.org/10.1016/j.euroneuro.2020.07.002Publisher copyright: facts cited only (effect, interval, k, n, design)
- Public health nutrition. Sachdev et al. (2005). Effect of iron supplementation on mental and motor development in children: systematic review of randomised controlled trials. Public health nutrition. 2005. doi.org/10.1079/PHN2004677Publisher copyright: facts cited only (effect, interval, k, n, design)
- Perspectives on psychological science : a journal of the Association for Psychological Science. Pietschnig and Voracek (2015). One Century of Global IQ Gains: A Formal Meta-Analysis of the Flynn Effect (1909-2013). Perspectives on psychological science : a journal of the Association for Psychological Science. 2015. doi.org/10.1177/1745691615577701Publisher copyright: facts cited only (effect, interval, k, n, design)
- Asia Pacific journal of clinical nutrition. Qian et al. (2005). The effects of iodine on intelligence in children: a meta-analysis of studies conducted in China. Asia Pacific journal of clinical nutrition. 2005. pubmed.ncbi.nlm.nih.gov/15734706Publisher copyright: facts cited only (effect, interval, k, n, design)
- BMJ (Clinical research ed.). Der, Batty and Deary (2006). Effect of breast feeding on intelligence in children: prospective study, sibling pairs analysis, and meta-analysis. BMJ (Clinical research ed.). 2006. doi.org/10.1136/bmj.38978.699583.55Publisher copyright: facts cited only (effect, interval, k, n, design)
- Proceedings of the National Academy of Sciences of the United States of America. Meier et al. (2012). Persistent cannabis users show neuropsychological decline from childhood to midlife. Proceedings of the National Academy of Sciences of the United States of America. 2012. doi.org/10.1073/pnas.1206820109Publisher copyright: facts cited only (effect, interval, k, n, design)
- Perspectives on psychological science : a journal of the Association for Psychological Science. Protzko, Aronson and Blair (2013). How to Make a Young Child Smarter: Evidence From the Database of Raising Intelligence. Perspectives on psychological science : a journal of the Association for Psychological Science. 2013. doi.org/10.1177/1745691612462585Publisher copyright: facts cited only (effect, interval, k, n, design)
- American journal of epidemiology. Gilman, Gardener and Buka (2008). Maternal smoking during pregnancy and children's cognitive and physical development: a causal risk factor?. American journal of epidemiology. 2008. doi.org/10.1093/aje/kwn175Publisher copyright: facts cited only (effect, interval, k, n, design)
- Educational Research Review. Sala and Gobet (2016). Do the benefits of chess instruction transfer to academic and cognitive skills? A meta-analysis. Educational Research Review. 2016. doi.org/10.1016/j.edurev.2016.02.002Publisher copyright: facts cited only (effect, interval, k, n, design)
- Psychological bulletin. Sala, Tatlidil and Gobet (2018). Video game training does not enhance cognitive ability: A comprehensive meta-analytic investigation. Psychological bulletin. 2018. doi.org/10.1037/bul0000139Publisher copyright: facts cited only (effect, interval, k, n, design)
- Experimental gerontology. Avgerinos et al. (2018). Effects of creatine supplementation on cognitive function of healthy individuals: A systematic review of randomized controlled trials. Experimental gerontology. 2018. doi.org/10.1016/j.exger.2018.04.013Publisher copyright: facts cited only (effect, interval, k, n, design)
- Psychological bulletin. Lehtonen et al. (2018). Is bilingualism associated with enhanced executive functioning in adults? A meta-analytic review. Psychological bulletin. 2018. doi.org/10.1037/bul0000142Publisher copyright: facts cited only (effect, interval, k, n, design)
- Psychonomic bulletin & review. Au et al. (2015). Improving fluid intelligence with training on working memory: a meta-analysis. Psychonomic bulletin & review. 2015. doi.org/10.3758/s13423-014-0699-xPublisher copyright: facts cited only (effect, interval, k, n, design)
- Proceedings of the National Academy of Sciences of the United States of America. Rohrer, Egloff and Schmukle (2015). Examining the effects of birth order on personality. Proceedings of the National Academy of Sciences of the United States of America. 2015. doi.org/10.1073/pnas.1506451112Publisher copyright: facts cited only (effect, interval, k, n, design)
Version history
- 2026.1112 November 2026First release. Next update due May 2027 (meta-analyses on fluoride, COVID-19, exercise and training appear every few months), sooner if a source is corrected or retracted.
Leon Falkner, Data & Research Analyst. Leon owns the arithmetic on IQ Metrics: the percentile tables, the score converter and the figures in everyone else's drafts. On the research desk Leon pulls the data, builds each index and writes the method. More about Leon.
Questions
Can you raise your IQ?
A little. The best-designed studies in our ledger show average gains of about 2 to 6 IQ points: one more year of school +2.1 (natural experiments), adoption into another home +4.4 (sibling design) and iron for children 8 and older +6.2 (randomised trials, clearest in anaemic children). These are group averages, not a promise for one person.
How to increase IQ: what works best?
Schooling has the most consistent evidence: about 2.1 IQ points per extra year where a school-leaving law changed, across 42 data sets and over 600,000 people. Iron helped children 8 and older in randomised trials, most clearly those who were anaemic. Brain training, music lessons and exercise fell below 1 point in stronger designs.
What lowers IQ the most?
In our ledger, very preterm birth (before 32 weeks) is linked to the largest gap, about 12.9 IQ points, followed by severe traumatic brain injury (about 12 points) and any preterm birth (11.9). All three come from cohort studies, so they are linked, not proven causes.
Does brain training increase IQ?
Not measurably in the strongest designs. Working-memory training moved nonverbal ability by about 3 IQ points against untreated controls but 0.75 points against active controls, in 67 comparisons (Melby-Lervåg, Redick and Hulme 2016). Gains on the trained tasks themselves are real.
Can IQ scores change over a lifetime?
Yes. Every row of the ledger is a change or a difference, from -12.9 to +6.2 IQ points, and average scores rose about 2.8 points a decade between 1909 and 2013 (Flynn effect, 271 samples). Scores also move with practice and with the test language.
Does lead exposure lower IQ?
Yes, in cohort data. In 1,333 children from 7 cohorts, blood lead rising from 2.4 to 10 micrograms per decilitre was linked to 3.9 IQ points lower; the next 10 cost 1.9 points and the 10 after that 1.1 (Lanphear 2005). The first micrograms cost the most.
Does fluoride lower IQ at the levels in US tap water?
The 2025 meta-analysis cannot say. Group comparisons were null when exposure was restricted to water below 1.5 mg/L, and the US community level is 0.7 mg/L. Each 1 mg/L more fluoride in urine was linked to 1.63 IQ points lower in 13 studies of 4,475 children (Taylor 2025).
Does weed lower IQ?
Frequent or dependent cannabis use in youth was linked to about 2 IQ points of decline (d = -0.132) in 7 cohort studies of 6,116 young people whose IQ was measured before and after (Power 2021). That is a link from cohort data, graded C in our ledger.
Does breastfeeding raise IQ?
Observational studies find 3.44 IQ points (17 studies), 2.62 after adjusting for the mother's IQ. The only large randomised trial, PROBIT in Belarus (13,889 children), found +5.9 full-scale points for breastfeeding promotion with an interval from -1.0 to +12.8, and +7.5 for verbal IQ.
How big is one IQ point?
One IQ point is one fifteenth of a standard deviation on a scale where the average is 100. For scale: average scores rose about 2.8 points per decade in the 20th century, and a year of school adds about 2.1 points in natural experiments.
Share it, cite it, download it
You may reuse everything on this page under CC BY 4.0: in articles, reports, lessons and posts. The one condition is credit to IQ Metrics with a link to this page.
Cite this study
Version 2026.11. Citing the version lets readers find the exact numbers.
Archived copy with a DOI: 10.5281/zenodo.24152343 (report PDF and data on Zenodo).
Falkner, L. (2026). Can you raise your IQ? 18 factors ranked in IQ points (Version 2026.11) [Data set]. IQ Metrics Research. https://iqmetrics.org/research/what-raises-or-lowers-iq/ (DOI: 10.5281/zenodo.24152343)
Falkner, Leon. "Can you raise your IQ? 18 factors ranked in IQ points." IQ Metrics Research, 12 Nov. 2026, iqmetrics.org/research/what-raises-or-lowers-iq/. DOI: 10.5281/zenodo.24152343.
Falkner, Leon. "Can you raise your IQ? 18 factors ranked in IQ points." IQ Metrics Research. November 12, 2026. https://iqmetrics.org/research/what-raises-or-lowers-iq/. DOI: 10.5281/zenodo.24152343.
@misc{iqmetrics2026whatraisesorlowersiq, author = {Falkner, Leon}, title = {Can you raise your IQ? 18 factors ranked in IQ points}, institution = {IQ Metrics}, year = {2026}, version = {2026.11}, doi = {10.5281/zenodo.24152343}, url = {https://iqmetrics.org/research/what-raises-or-lowers-iq/} }
Source: Leon Falkner, "Can you raise your IQ? 18 factors ranked in IQ points." IQ Metrics Research, version 2026.11, https://iqmetrics.org/research/what-raises-or-lowers-iq/ (DOI 10.5281/zenodo.24152343)
Embed the key numbers
Paste this into an article or post. It lists the main numbers and credits the source.
Get the data
One row per factor-estimate (30 rows: 29 estimates plus the Flynn-effect reference row): the exposure as printed, the outcome, the effect as printed and in IQ points (SD 15), the interval, design, evidence grade (rule written before collecting), k studies, n people, year, DOI and the sentence from the source that holds the number. Empty = not printed in the text we could read.
| Column | What it holds |
|---|---|
row_id, factor, group | Our id; the factor; harm, gain, no clear effect or reference |
life_stage | Prenatal, early childhood, school age, adolescence, adult or all ages |
exposure_contrast, outcome | Exposure contrast and outcome measure as printed in the source |
effect_as_printed | The effect exactly as printed (points, SD, d, g or SMD, with interval) |
effect_iq_points, ci_low, ci_high | Effect and 95% interval in IQ points |
interval_note, converted | Where the interval comes from; "IQ Metrics conversion (x 15)" for standardised differences |
design, grade | Study design; evidence grade A-D (ref = the Flynn reference row) |
k, n, n_note | Studies pooled, people, and what n counts |
year, source_id, doi | Publication year, our source id, DOI |
source_quote | Sentence(s) from the source holding every printed number, separated by || |
our_page, note, pair | Our explainer on iqmetrics.org; extra printed figures; design-contrast pair key |
For journalists, researchers and teachers
Everything on this page may be quoted, charted and republished with credit. No embargo, no permission needed, no sign-up. If you need a number that is not here, ask.
Summary you can paste
Plain news style. Edit freely; keep the credit.
IQ Metrics Research built a ledger of 29 estimates for 18 factors linked to IQ scores (22 primary sources, 2005-2025), each converted to IQ points with its design, k, n, a quote from the source and an evidence grade assigned by a rule written first. Best-designed gains are about 2 to 6 points; three of four popular boosts fall below 1 point in stronger designs; none of the 13 harms comes from a randomised or within-family study.
Angles for a story
- Brain training, music lessons and exercise each fall below 1 IQ point in the stronger design (Figure 4)
- One more year of school: about 2.1 IQ points in natural experiments, the most consistent gain (Figure 1)
- The weaker the study, the bigger the effect: median 1.38 points at grade A, 5.25 at grade D, partly because harms can only be observed (Figure 5)
- Every measured harm rests on observational data: 0 of 13 harms from a randomised or sibling design (Figure 7)
- Fluoride: linked to lower scores at group level, null below 1.5 mg/L in water; US community water is 0.7 mg/L
- Lead: the first micrograms cost the most points (Figure 3)
Quotes you can use
Attributable as written, with the name and title. For a different angle or a quote on a specific figure, ask through the contact page.
The honest answer to “can you raise your IQ?” is yes, by a few points, and school has the most consistent evidence. The quick fixes people ask about shrink to almost nothing once the study has a proper control group.
Leon Falkner, Data & Research Analyst, IQ Metrics ResearchThe biggest numbers in this table are harms, and every one of them comes from observational data. That is not a flaw anyone can fix: you cannot randomise a child to lead or to being born early.
Leon Falkner, Data & Research Analyst, IQ Metrics ResearchMeasure the same thing two ways and the gain usually shrinks: brain training, music lessons and exercise each fall below one IQ point once the study design gets stronger.
Leon Falkner, Data & Research Analyst, IQ Metrics Research
Files
- CSV of every estimate: factor, group, life stage, exposure as printed, outcome, effect as printed, IQ points, interval, design, grade, k, n, year, DOI, source quote, our page (CC BY 4.0)
- Every figure as a print-ready PNG: use the Image button under each figure
- Embed code and data table under every figure
- Share images for social media in three sizes, with the credit line built in
- Citations in APA, MLA, Chicago, BibTeX and plain text
Terms, contact and corrections
Credit: “IQ Metrics Research, What raises or lowers IQ? (2026)” with a link to this page. On air or in print, “IQ Metrics” and the page address are enough.
What it covers: exposures and interventions with a printed effect on an IQ-type score in a meta-analysis, pooled analysis or large trial; no rows for sex, race, nationality, class or genes.
Contact: the research team, through the contact page. Corrections are made on this page with a dated note in the version history.