





Do Siblings Have Similar IQs? The Typical Gap, in Numbers
Do siblings have similar IQs? Somewhat. Across 69 correlations the average is .47, so two full siblings typically differ by about 12 IQ points, and about one pair in five differs by 20 or more. See the odds of every gap, what to expect from the sibling of a high scorer, and what pushes siblings apart.

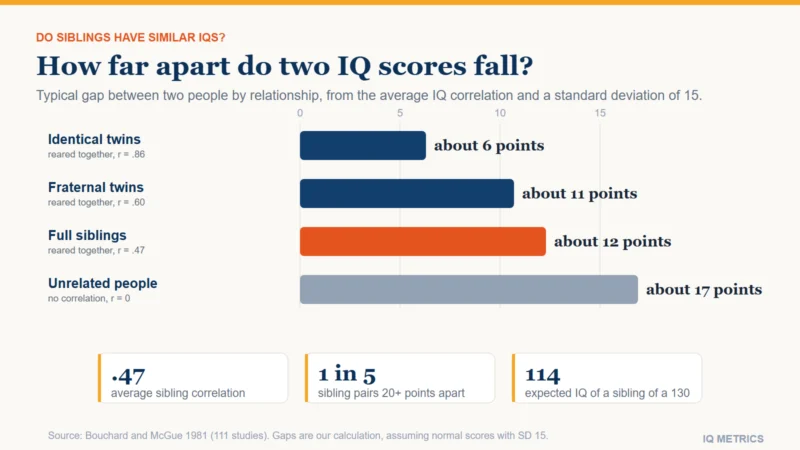
Do siblings have similar IQs? Somewhat, but far from identical. Across 69 correlations from 26,473 sibling pairs, the average correlation between the IQ scores of full siblings raised together is .47. That is moderate: siblings tend to land on the same side of average more often than not, yet two of them typically differ by about 12 IQ points, and roughly one pair in five differs by 20 points or more. That is not a sign that one was tested badly or raised differently; it is what a correlation of that size produces on its own. This guide turns the correlation into numbers you can use: the odds of each size of gap, what to expect from the brother or sister of a high or low scorer, and what actually pushes siblings apart.
- The number: the weighted average correlation for siblings reared together is .47 (Bouchard and McGue, 1981, a review of 111 studies). Individual correlations ranged from .13 to .90.
- The typical gap (our calculation): about 12 points on a scale with a standard deviation of 15. Half of all sibling pairs differ by 10 points or more, about one pair in five by 20 or more, and about one in 19 by 30 or more.
- Twins for comparison: identical twins reared together correlate .86 (typical gap about 6 points) and fraternal twins .60 (about 11).
- Regression to the mean: if one child scores 130, a sibling is expected to score about 114, with an 11% chance of 130 or more and a 14% chance of below 100.
- Why not closer: siblings share about half of their genetic variants, not all of them; they have different experiences; and every score carries a margin of error of 2 to 3 points.
The question sits next to topics we cover elsewhere: whether IQ is genetic, whether intelligence comes from the mother or the father, what twin studies show, and whether birth order matters. Here we focus on the practical side: how far apart two siblings usually land.
How similar are siblings on IQ tests?
The standard reference is a 1981 review in Science by Bouchard and McGue, which gathered 526 familial correlations from 111 studies covering 113,942 pairings. For siblings reared together the weighted average correlation was .47, based on 69 values from 26,473 pairs. The authors noted that this is close to the .50 a simple polygenic model predicts, and that same-sex and opposite-sex siblings gave almost identical averages (.48 and .49). But the individual studies were far from uniform, ranging from .13 to .90, so .47 is a center of gravity rather than a law.
The table below puts siblings next to other pairs from the same review. The “typical gap” column is our calculation from each correlation, assuming scores that follow a normal curve with a standard deviation of 15: the standard deviation of the difference between two people is 15 times the square root of 2 times (1 minus the correlation), and the average gap is about 0.8 times that.
| Pair | Correlation | Typical gap (points) | Pairs 20+ points apart |
|---|---|---|---|
| Identical twins reared together | .86 | about 6 | 1% |
| Fraternal twins reared together | .60 | about 11 | 14% |
| Full siblings reared together | .47 | about 12 | 20% |
| Siblings reared apart (two correlations only) | .24 | about 15 | 28% |
| Unrelated people | 0 | about 17 | 35% |
Read across the table and the point is clear: full siblings are much closer to strangers than to identical twins. A sibling pair is about 12 points apart on average; two people picked at random from the same population average about 17.
How big is the typical IQ gap between siblings?
Because a correlation of .47 leaves most of the variation unexplained, the gaps are wide. The next table shows the share of full-sibling pairs that differ by at least a given number of points, under the same assumptions as above.
| Gap of at least | Share of sibling pairs | Roughly |
|---|---|---|
| 5 points | 75% | 3 pairs in 4 |
| 10 points | 52% | 1 pair in 2 |
| 15 points | 33% | 1 pair in 3 |
| 20 points | 20% | 1 pair in 5 |
| 30 points | 5% | 1 pair in 19 |
Part of every gap is measurement noise, but only a small part. On a well-built test the standard error is 2 to 3 points (see the margin of error explained), which adds roughly 3.5 points of spread to the difference between two single scores, against about 15 for the gap itself. Most of the distance between siblings is real difference in what they scored.
Larger families widen the spread. Using the within-family standard deviation implied by a .47 correlation (about 11 points), the expected distance between the highest and lowest scorer is about 12 points in a family of two, 18 in a family of three, 22 in a family of four and 25 in a family of five. In a family with several children, a 20-point range is typical rather than remarkable.
What IQ should you expect a brother or sister to have?
If one child’s score is known, a sibling’s expected score sits part of the way back toward 100, in proportion to the correlation. This is regression to the mean, which our page on regression to the mean explains in general. With a correlation of .47, the expected sibling score is 100 plus .47 times the first child’s distance from 100, and the sibling’s own spread around that expectation is about 13 points.
| First child scores | Sibling expected to score | Sibling 100 or more | Sibling 115 or more | Sibling 130 or more |
|---|---|---|---|---|
| 70 | 86 | 14% | 1% | under 0.1% |
| 85 | 93 | 30% | 5% | 0.3% |
| 100 | 100 | 50% | 13% | 1% |
| 115 | 107 | 70% | 27% | 4% |
| 130 | 114 | 86% | 47% | 11% |
| 145 | 121 | 94% | 68% | 25% |
A child who scores 130 will, on average, have a sibling around 114: probably above average (an 86% chance of 100 or more), about even odds of 115 or more, and roughly one chance in nine of reaching 130 as well. That is why a gifted child often has an above-average sibling and sometimes an average one. See signs of a gifted child and gifted cutoff scores for what the label requires, and how rare a high score is for the rarity of each level. In the other direction, a child scoring 85 has a sibling expected around 93, with about a 30% chance of 100 or more.
These are illustrations from one average correlation. Real families vary, the relationship may not be perfectly linear at the extremes, and a model cannot tell you anything about a particular child. To know a child’s score, test the child; see IQ testing for children.
Where would your own score land?
Take the IIF-certified assessment and get your score with the scale it was measured on, the percentile it corresponds to and the confidence range around it — the three figures most online tests leave out.
Find your IQ score now! →Why are siblings not more alike?
Genes are one reason. Full siblings share about half of their genetic variants on average, the same as fraternal twins, and each child receives a different shuffle. The balance between genes and shared home environment also shifts with age: in a sample of 11,000 twin pairs, the heritability of general cognitive ability rose from 41% at age 9 to 55% at 12 and 66% at 17 (Haworth and colleagues, 2010), and Plomin and Deary (2015) put the range from about 20% in infancy to perhaps 80% in later adulthood. Our guide to whether IQ is genetic explains what a heritability figure does and does not mean.
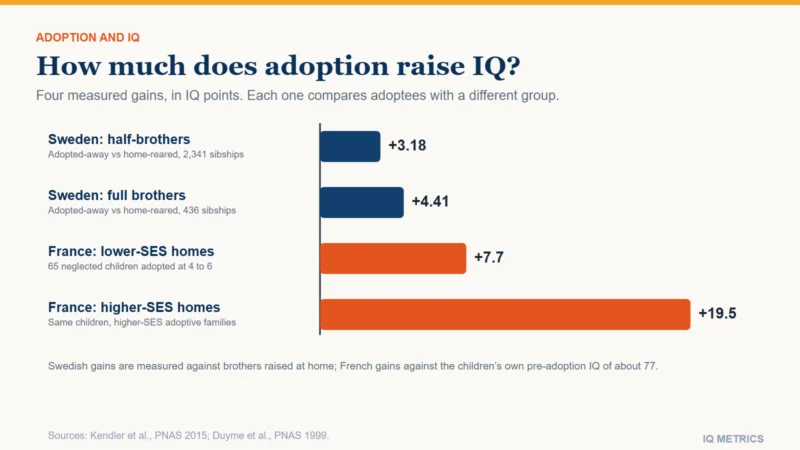
The shared home matters too, so siblings are not simply a genetic lottery. In a Norwegian study of more than 334,000 pairs of brothers tested at military conscription, the correlation between brothers decreased as the age difference between them increased (Sundet and colleagues, 2008), a pattern that points to family environment effects in young adults. A Swedish study compared full brothers reared in different homes: those raised by adoptive parents scored 4.4 IQ points higher than their brothers raised by a biological parent (Kendler and colleagues, 2015), and each extra unit of the rearing parents’ education went with 1.7 IQ units. The same design with half-brothers gave 3.2 points and 1.9 units. Our guide to adoption and IQ covers what that does and does not imply.
Then there are the things that happen to one child and not the other. Different friends and teachers, a head injury or a long illness (concussion and IQ), a premature birth (premature birth and IQ), or simply a bad stretch: depression and IQ shows how low mood can pull down the speed- and attention-heavy parts of a score for a while. Finally, the yardstick can differ. If siblings sat different tests, or the same test with different norms, part of the gap belongs to the instrument rather than the child.
Is the firstborn smarter?
On average, slightly, but nowhere near enough to explain a typical gap. Within-family analyses find a firstborn advantage of roughly one to two points, and the exact size is disputed; our piece does birth order affect IQ sets out the evidence. Against a typical sibling gap of 12 points, birth order is a small effect, and it is no larger than the error on a single test.
Quick answers
- Do siblings have the same IQ? No. Their scores correlate about .47 on average, which leaves a typical gap of about 12 points.
- Can siblings have very different IQs? Yes, and often. About one pair in five differs by 20 points or more, and about one in 19 by 30 or more.
- Is it normal for one sibling to score much higher? Yes. A gap of 15 points happens in about one pair in three, and in a family of four the highest and lowest scorers are about 22 points apart on average.
- Do identical twins have the same IQ? Not exactly. Their correlation is about .86, which gives a typical gap of about 6 points.
- If one child scores 130, will a sibling? The chance is about 11%; the expected sibling score is about 114.
- Does birth order matter? Within families, roughly one to two points for firstborns, much smaller than the typical gap.
Sources
- Bouchard, T.J. and McGue, M. (1981): Familial studies of intelligence: a review, Science, 212(4498), 1055-1059.
- Sundet, J.M., Eriksen, W. and Tambs, K. (2008): Intelligence correlations between brothers decrease with increasing age difference: evidence for shared environmental effects in young adults, Psychological Science, 19(9), 843-847.
- Kendler, K.S. et al. (2015): Family environment and the malleability of cognitive ability: a Swedish national home-reared and adopted-away cosibling control study, Proceedings of the National Academy of Sciences, 112(15), 4612-4617.
- Haworth, C.M.A. et al. (2010): The heritability of general cognitive ability increases linearly from childhood to young adulthood, Molecular Psychiatry, 15(11), 1112-1120.
- Plomin, R. and Deary, I.J. (2015): Genetics and intelligence differences: five special findings, Molecular Psychiatry, 20(1), 98-108.
- Our calculations: every gap, odds and expected-score figure above is derived here from the .47 correlation, assuming normally distributed scores with a standard deviation of 15. None of them is reported in the sources.
Keep reading
All articles →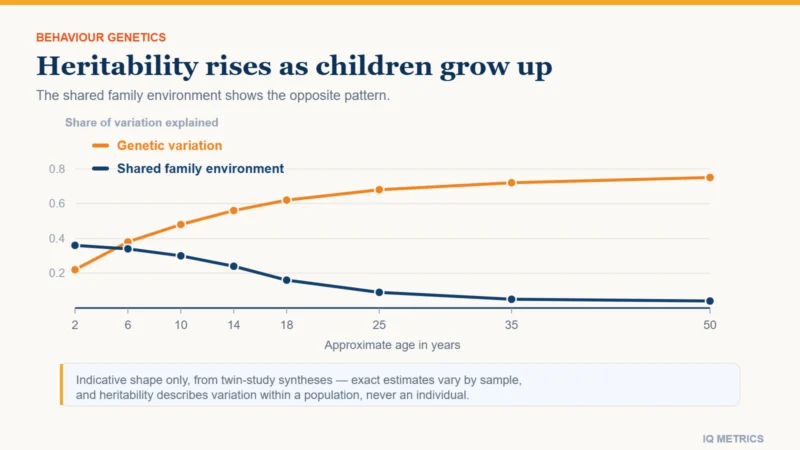 Research & Evidence
Is IQ Genetic?
Heritability estimates for IQ rise from roughly 0.4 in childhood to 0.7 or higher in adulthood, which sounds decisive until you know what heritability measures. Here is what twin and adoption studies actually show, and the four conclusions people draw from them that the statistic does not support.
 Research & Evidence
Is Intelligence Inherited From Mother or Father?
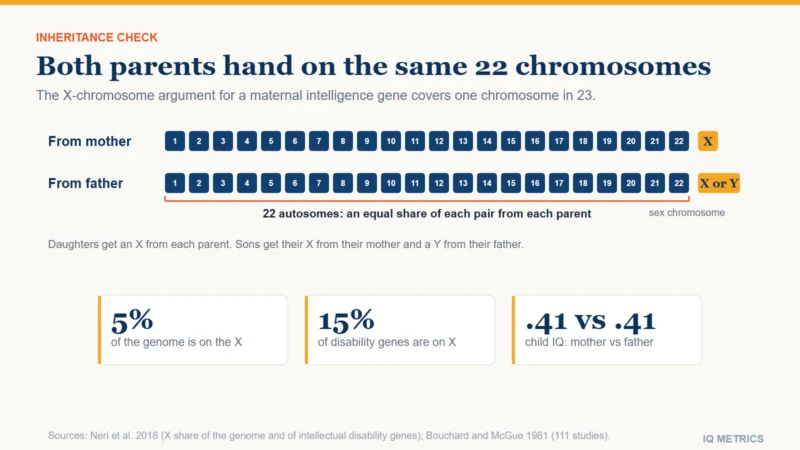
Is intelligence inherited from mother or father? From both. A review of 111 family studies found mothers and fathers resemble their children in IQ equally (.41 each). See where the X-chromosome claim came from, why it fails, and how much IQ parents pass on.
 Research & Evidence
Adoption and IQ
Adoption can raise average IQ by about 3 to 4 points in a large Swedish sibling study and by 8 to 20 in a French study of neglected children, yet adoptees come to resemble their birth parents. See what adoption and twin studies show, and what they cannot.