





Do Smart People Live Longer? What IQ and Mortality Studies Show
Do smart people live longer? On average, modestly: 16 studies of 1,107,022 people found a 24% lower risk of death per standard deviation of early-life intelligence. In 65,765 Scots the link was strongest for respiratory disease, heart disease and stroke. Here are the numbers.

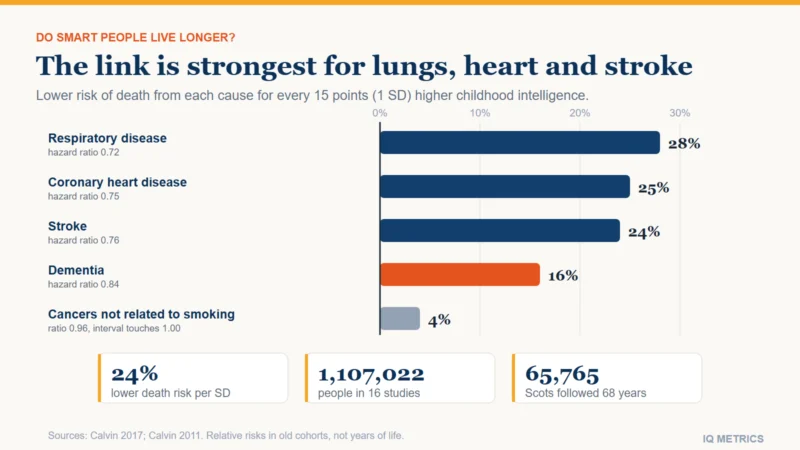
Do smart people live longer? On average, yes, but modestly. A meta-analysis of 16 studies covering 1,107,022 people and 22,453 deaths found that each 1 standard deviation (about 15 points) of higher intelligence in childhood or youth went with a 24% lower risk of death over 17 to 69 years of follow-up. The link is strongest for respiratory disease, heart disease and stroke, and weak for cancers unrelated to smoking. It is a population average built on early-life scores, and education, adult social class and smoking explain part of it. This guide sets out the three landmark studies, the numbers by cause of death, what a risk ratio does and does not tell one person, and what the explanations are. It is general information, not medical advice.
- All causes: 24% lower risk of death per 1 SD higher score (95% CI 23% to 25%), pooled from 16 cohorts.
- A whole country: in 65,765 Scots tested at age 11 and followed for 68 years, the hazard ratio per SD was 0.72 for respiratory disease, 0.75 for coronary heart disease and 0.76 for stroke.
- Weakest links: cancers not related to smoking (0.96) and suicide (0.87, interval including 1.00).
- What explains it: adjusting for education cut the link by 54% and for adult social class by 34% in the meta-analysis; childhood social class made almost no difference.
- The catch: the scores were measured in childhood or youth, not as adults, and the studies report relative risks, not years of life.
Our news desk has covered the Scottish survey cohorts as a measurement story (childhood IQ scores and later-life health). This guide adds the numbers behind the headline. For related questions, see can an IQ test detect dementia, PTSD and IQ (another condition studied in the same kind of cohorts), and does IQ predict school success.
What the big studies measured
These studies share a design that matters for the answer: a cognitive test taken early in life, then records of who died and when. Testing early avoids a trap. Serious illness lowers test performance in later life, so an adult score could reflect a person who was already ill rather than one who was brighter (our reading). Population surveys such as the Scottish Mental Surveys of 1932 and 1947, which tested almost every 11-year-old in Scotland on a single day, provide the scores, and decades later they were linked to death records.
Whalley and Deary (2001) studied all 2,792 children in Aberdeen born in 1921 who sat the 1932 survey. They traced 79.9% (2,230) and checked survival to 1 January 1997. A 15-point disadvantage in mental ability at age 11 conferred a relative risk of 0.79 of being alive 65 years later (95% CI 0.75 to 0.84), and a 30-point disadvantage a relative risk of 0.63 (0.56 to 0.71). Men who died on active service in the Second World War had a relatively high IQ, an exception that suggests the pattern concerns ordinary causes of death (our reading). Overcrowding in the school catchment area was weakly related to death, and controlling for it did not alter the result.
Calvin and colleagues (2011) pooled 16 unrelated studies: 22,453 deaths among 1,107,022 participants. A 1 SD advantage in cognitive test scores went with a 24% (23% to 25%) lower risk of death over follow-up of 17 to 69 years. They found little sign of publication bias, and the association was similar for men and women.
Calvin and colleagues (2017) followed 33,536 men and 32,229 women born in Scotland in 1936 who took the 1947 survey, linking them to cause-of-death records through December 2015. This is the study that lets us split “risk of death” into causes.
| Study | Who | Result |
|---|---|---|
| Whalley and Deary, 2001 | 2,230 traced from 2,792 Aberdeen children tested in 1932 | Relative risk of survival to 76: 0.79 per 15-point disadvantage |
| Calvin et al., 2011 | 16 studies, 1,107,022 people, 22,453 deaths | 24% lower risk of death per 1 SD advantage |
| Calvin et al., 2017 | 65,765 Scots tested in 1947, followed 68 years | Inverse link with every major cause of death, strongest for respiratory disease |
Which causes of death? The numbers per standard deviation
Childhood intelligence was inversely associated with all major causes of death in the 2017 study. The table gives the age- and sex-adjusted hazard ratio per 1 SD (about 15 points) advantage; a ratio of 0.72 means 28% lower risk at a given age.
| Cause of death | Hazard ratio | 95% interval |
|---|---|---|
| Respiratory disease | 0.72 | 0.70 to 0.74 |
| Coronary heart disease | 0.75 | 0.73 to 0.77 |
| Stroke | 0.76 | 0.73 to 0.79 |
| Injury | 0.81 | 0.75 to 0.86 |
| Smoking-related cancers | 0.82 | 0.80 to 0.84 |
| Digestive disease | 0.82 | 0.79 to 0.86 |
| Dementia | 0.84 | 0.78 to 0.90 |
| Suicide | 0.87 | 0.74 to 1.02 |
| Cancers not related to smoking | 0.96 | 0.93 to 1.00 |
Two patterns stand out. The links were strongest for causes tied to smoking, lungs and the heart, and weak for suicide and for cancers not related to smoking, where the intervals include 1.00 (no difference). Among individual cancers the ratios ranged from 0.75 for lung cancer to 0.91 for hematopoietic cancers. The authors also report that the associations with coronary heart disease, smoking-related cancers, respiratory disease and dementia were somewhat stronger in women than in men.
What a hazard ratio means for one person
A hazard ratio of 0.76 per standard deviation does not mean a person lives 24% longer. It compares the chance of dying between groups: on average, a group 15 points higher has a 24% lower risk of death over the follow-up period (the 2011 pooled figure). If the ratio is the same at each step (an assumption), a 30-point advantage would give about 0.58 (0.76 x 0.76, our arithmetic). The Aberdeen study reports a different measure, the relative chance of being alive at 76 (0.63 for a 30-point disadvantage), so the two are not interchangeable. Converting these ratios into years of life needs life tables and an assumed baseline, and the studies above do not report it, so we do not put a number on it.
Individual scatter is large: these are averages across tens of thousands of people, and a ratio of 0.76 still leaves heavy overlap between groups (our reading). Use the IQ percentile calculator or the IQ bell curve to see how far 1 SD is, and note that scales differ: see standard deviation 15 versus 16.
Where would your own score land?
Take the IIF-certified assessment and get your score with the scale it was measured on, the percentile it corresponds to and the confidence range around it — the three figures most online tests leave out.
Find your IQ score now! →Why would intelligence relate to how long people live?
The studies show an association, and the more interesting question is why. The numbers that can be checked:
- Education. In six studies that adjusted for it, education attenuated the hazard ratios by 54%.
- Adult social class. In five studies, adjusting for adult socio-economic position attenuated them by 34%.
- Childhood social class. In nine studies with the data, adjustment had almost no effect, so it does not look like a simple confounder.
- Smoking and adult class in the 2017 replication sample. Together they partially attenuated the link, by 16% to 58%.
- Other childhood confounders. In a representative subsample, adjusting for confounders including three childhood socio-economic indicators reduced the effect by only 10% to 26%.
Calvin and colleagues caution that attenuation can mean mediation (education is a step on the path), over-adjustment or confounding, and the data cannot tell these apart. Our news report sets out four candidate explanations: education and income, health behavior and health literacy (smoking is the clearest mediator), “system integrity” (the score as a marker of bodily robustness) and shared genetics, and concludes that none is sufficient alone. Related lifestyle questions appear in sleep and IQ, exercise and IQ, nutrition and IQ and IQ and alcohol; and for the education pathway, does school raise IQ.
What these studies cannot tell you
- They are not about a score you take as an adult. The scores came from childhood or youth group tests, so an adult online result is not a forecast of lifespan (our reading).
- They describe particular generations. The Scottish cohorts were born in 1921 and 1936, when smoking was more widespread than it is now; because smoking is a major pathway, the strength of the link today may differ (our reading).
- They show association, not cause. Raising a score would not necessarily change longevity; education and health behavior are the stronger candidates for levers (our reading).
- They report averages. Nothing here predicts a given person’s lifespan, and a lower score is not a medical risk factor on its own.
Quick answers
- Do smart people live longer? On average, modestly: 24% lower risk of death per 1 SD higher early-life intelligence in 16 studies.
- Which causes of death does it affect most? Respiratory disease (hazard ratio 0.72), coronary heart disease (0.75) and stroke (0.76).
- Is it because smart people are richer? Partly: adjusting for adult social class and education shrinks the link by about a third to a half, and some remains.
- Does a higher adult IQ add years? These studies did not test that; they used childhood scores.
- Does a higher IQ protect against dementia? The hazard ratio for dementia death was 0.84 per SD, a modest link.
Sources
- Whalley, L.J. and Deary, I.J. (2001): Longitudinal cohort study of childhood IQ and survival up to age 76, BMJ, 322(7290), 819.
- Calvin, C.M. et al. (2011): Intelligence in youth and all-cause-mortality: systematic review with meta-analysis, International Journal of Epidemiology, 40(3), 626-644.
- Calvin, C.M. et al. (2017): Childhood intelligence in relation to major causes of death in 68 year follow-up: prospective population study, BMJ, 357, j2708.
Keep reading
All articles →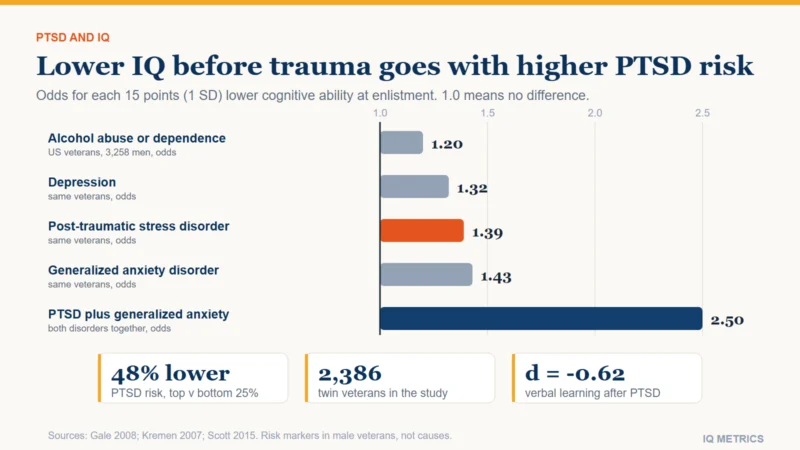 Understanding IQ
PTSD and IQ
PTSD and IQ: does PTSD lower intelligence? The best evidence says lower ability before a trauma raises the risk, with the top quarter at 48% lower risk in a 2,386-twin study. After PTSD, gaps appear in verbal learning and speed. Here is what the studies show.
 Research & Evidence
Does IQ Predict School Success?
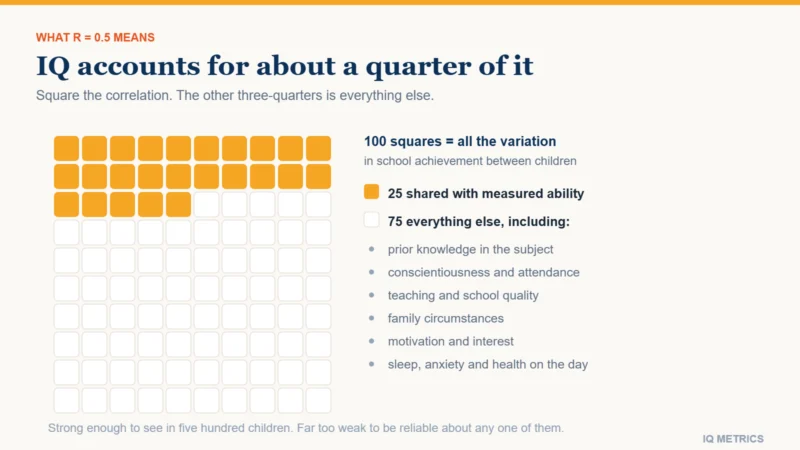
IQ predicts school achievement better than any other single measure psychologists have found, and still leaves roughly three-quarters of the variation unexplained. Both halves of that sentence get ignored by somebody. Here are the actual correlations, what they mean for one child, and what accounts for the rest.
 Research & Evidence
Socioeconomic Status and IQ
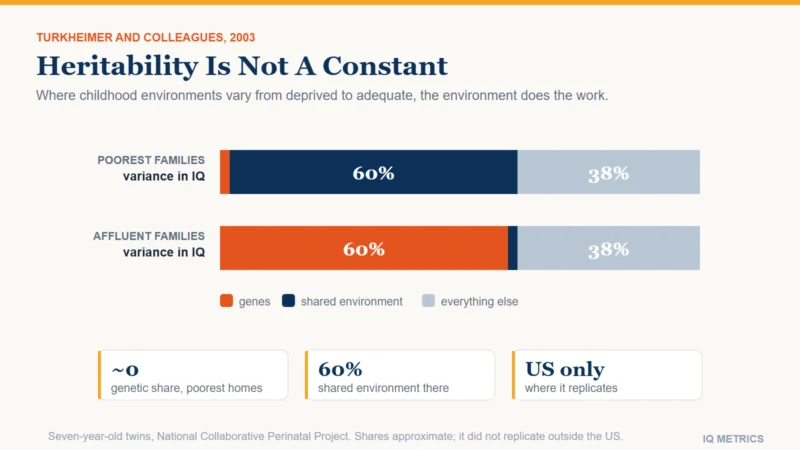
Family circumstances track IQ scores, and the relationship is stranger than a simple gap. In the poorest families studied, genes explained almost none of the variation in childhood scores and shared environment explained most of it. In affluent families the pattern reversed. Here is what that finding does and does not support.