




What Is the Average IQ in Nigeria? Where the Figures Come From and What Education Surveys Show
The average IQ in Nigeria is an estimate, not a test result: 67.80 in a 2019 compiled table of 10 studies and 92.76 in a 2026 online table of 639 takers, 25.0 points apart. The older figure of 67 rests on two samples. See where each number comes from and what school data show.

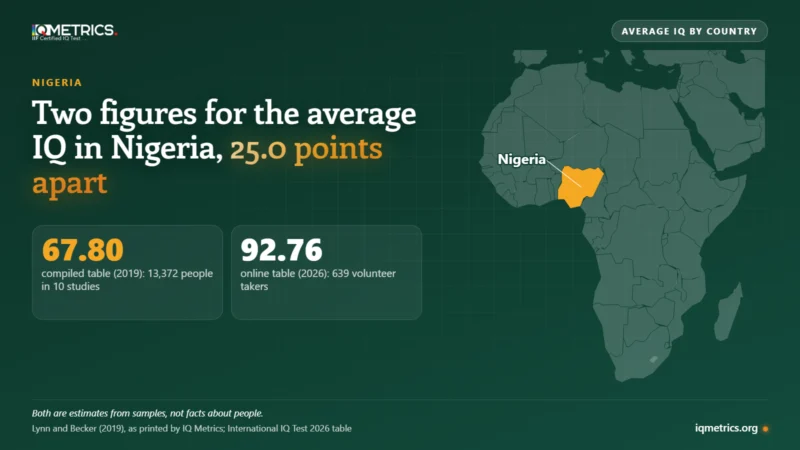
The average IQ in Nigeria is an estimate, not a test result. Two figures circulate: 67.80 from a 2019 compiled table (13,372 people in 10 studies) and 92.76 from a 2026 online table (639 takers). They sit 25.0 points apart, and we found no nationally representative IQ sample of Nigeria behind either. Both describe samples and sources, not the people of a country.
New here: the older 2002 table built its figure of 67 from two samples, 86 adult men tested in 1965 and 375 children tested around 1973, 461 people in all. The 2019 table prints 29 times as many people, and the figure moved by under one point. Below: where each number comes from, what school data show, and what the numbers cannot tell you.
Key takeaways
- An IQ test normed in Nigeria averages 100 by design. Comparing countries needs other data, and none of it is an IQ test of everyone in the country.
- Two numbers circulate: 67.80 (compiled, 10 studies, 13,372 people) and 92.76 (online, 639 volunteers). They differ by 25.0 points.
- The 2002 figure of 67 rests on two samples: 86 men in 1965 (IQ 64) and 375 children around 1973 (IQ 69). It then set the estimates for five neighbours.
- Reviews of African data found about 82 on non-Raven tests against UK norms and about 80 on Raven’s against US norms, and call for studies of test bias (Wicherts and others, 2010).
- Nigeria is not in the OECD’s PISA 2025 tables or on the TIMSS 2023 participant list. UNICEF reports about 10.5 million children aged 5 to 14 out of school.
What is the average IQ in Nigeria?
On a test normed in Nigeria, the average is 100 by construction. A norm group is a large sample of people who took the test, and its mean is set to 100, with a standard deviation (SD) of 15 points. A person in Nigeria who scores 100 is average among that group. It says nothing about Nigeria against another country.
Several kinds of number get called the Nigeria average IQ. They answer different questions. Searches for the average Nigerian IQ, or for the IQ of Nigerians, all lead to the same figures, so the table lists what stands behind each.
| Source | Figure | Sample | What it is |
|---|---|---|---|
| Lynn and Vanhanen (2002), IQ and the Wealth of Nations | 67 | 2 samples, 461 people | Mean of two adjusted results, rounded |
| Lynn and Becker (2019), as printed on our average IQ by country page | 67.80 | 13,372 people in 10 studies | Published studies on different tests, compiled |
| International IQ Test, 2026 table | 92.76 | 639 online takers | People who chose to take one website’s test |
| OECD PISA 2025 and IEA TIMSS 2023 | None | Nigeria is not in either | No international school result was found for this article |
Read these as three kinds of number: an average of two old samples, a compilation of ten studies we did not open, and the mean of volunteers on a website. They cannot be set side by side on one scale. Our guide to average IQ by country shows every country’s figure and its sample column, and the Somalia and India pages apply the same questions to two other countries.
Where does the national IQ figure for Nigeria come from?
From a sum of two old samples. Lynn and Vanhanen’s 2002 book assigns Nigeria an IQ of 67, the mean of a 64 and a 69. Neither sample was national.
| Step | Number | What it rests on |
|---|---|---|
| Wober (1969), tested in 1965 | 64 | 86 adult men on the Standard Progressive Matrices; mean raw score 15.9, converted with 1979 British norms |
| Fahrmeier (1975), tested around 1973 | 69 | 375 children aged 6 to 13 on the Coloured Progressive Matrices; 70, lowered by 1 for the 6-year gap to the 1979 British norms |
| Nigeria | 67 | (64 + 69) / 2 = 66.5, rounded toward 100 |
The second study’s own title is “The effect of school attendance on intellectual development in Northern Nigeria”, so it was a study of schooling and test scores in one region, not a national sample. We read the 2002 book’s account of both studies, not the studies themselves.
The 67 then did more work. The same table gives Niger 67 from Nigeria alone, and sets Benin at 69, Cameroon at 70, the Central African Republic at 68 and Togo at 69 by averaging Nigeria with other neighbours. So two samples fixed the estimates of six countries.
How many studies stand behind it?
The 2019 compiled table prints 10 studies and 13,372 people for Nigeria. That is 29 times the 461 people in the 2002 table, and the figure moved from 67 to 67.80.
More people is not the same as a representative sample. Nigeria had about 227.9 million people in 2023 (World Bank), so 13,372 is about 1 person in 17,000. The 2026 online table’s 639 takers are about 1 in 357,000, and they chose to take the test. We did not open the ten studies behind the 2019 figure, so we cannot say which tests they used or whom they sampled.
One more check on the 2019 table: it lists Cameroon at the same 67.80, marked “est.” because it has no test data of any kind. A figure that a neighbour can share by estimate is a weak description of either country. Our report on what country IQ rankings cannot support sets out the wider problem.
What do large education surveys say instead?
No international assessment result for Nigeria was found for this article. Nigeria has no row in the OECD’s PISA 2025 results tables, and it is not on the list of 44 countries in the 2023 TIMSS cycle from the IEA. We did not check PIRLS.
What exists is school access. UNICEF’s Nigeria page says one in every five of the world’s out-of-school children is in Nigeria, about 10.5 million children aged 5 to 14. It says only 61% of 6 to 11 year olds regularly attend primary school, and that net attendance in the north is 53%. The page does not date these figures.
These numbers describe who is in school, not how well children can reason. A learning result would need a test given to a sample of pupils, and we found none. Our post on whether PISA is an IQ test explains why school results and IQ are different things.
Why do national IQ estimates change with schooling, nutrition and test familiarity?
Because a test score reflects practice and health as well as reasoning, and national tables cannot separate them. World Population Review, which prints the online table, says lower national averages are often linked to limited education, undernutrition in early childhood and less exposure to standardised tests, rather than to fixed differences in ability.
That is a general statement, not a Nigerian estimate, and none of our sources gives an effect size for Nigeria. So we put no number on it. Our pages on nutrition and IQ, socioeconomic status and IQ and the Flynn effect cover what research has found elsewhere.
Wicherts and colleagues (2010) add that the Flynn effect, the rise in test scores over decades, “has yet to take hold” in sub-Saharan Africa on Raven’s matrices, although adult scores rose over the years in their review. They also say more studies of test bias are needed. See cultural bias in IQ tests.
Where would your own score land?
Take the IIF-certified assessment and get your score with the scale it was measured on, the percentile it corresponds to and the confidence range around it — the three figures most online tests leave out.
Find your IQ score now! →Do researchers dispute the national IQ data for Africa?
Yes. Published reviews found higher averages than the older tables, and said the tests may not measure the same thing in every setting.
| Source | What the abstract says | Scope |
|---|---|---|
| Wicherts, Dolan and van der Maas (2010), Intelligence 38(1) | Tests other than Raven’s: about 82 against UK norms. Matches about 82 predicted from international student-achievement studies. More studies of measurement bias needed | Sub-Saharan Africa as a whole, not Nigeria |
| Wicherts and colleagues (2010), Learning and Individual Differences 20(3) | Raven’s: about 80 against US norms. Weak indicator of general intelligence in Africa; what the scores reflect is unknown | Sub-Saharan Africa as a whole |
| Lynn and Meisenberg (2010), Intelligence 38(1) | A published reply to the first review (we read the title, not the abstract) | Sub-Saharan Africa as a whole |
Both sides published, and the exchange is long. For Nigeria the point is simpler: the 2002 figure comes from two samples, and the reviews say the choice of samples and tests decides the answer. A culture-fair test removes some language and schooling content, but it does not remove practice effects or unequal test experience. Our guide to the culture-fair IQ test explains what it can and cannot fix.
Average IQ in Africa vs Nigeria: do the tables agree?
Not on the order. On average IQ in Africa vs Nigeria, five African countries sit 17.0 points apart in the compiled table and 4.6 points apart in the online one, and their order changes.
| Country | Compiled table (Lynn and Becker, 2019) | Online table (International IQ Test, 2026) |
|---|---|---|
| Nigeria | 67.80 (10 studies, 13,372 people) | 92.76 |
| Ghana | 58.16 (5 studies, 4,515 people) | 91.40 |
| Kenya | 75.20 (8 studies, 3,528 people) | 91.69 |
| South Africa | 68.87 (15 studies, 6,704 people) | 93.63 |
| Ethiopia | 68.42 (6 studies, 707 people) | 96.00 |
In the compiled table Nigeria ranks 173rd of 201 countries. In the online table it ranks 107th of 137. A Nigeria IQ ranking therefore describes the list, not the country: change the list and the rank changes. The online table’s figures sit close together, and our report on the 2026 online ranking shows that its scores track how many people from each country took the test. Our smartest countries study ranks countries by school results instead.
What does a country average say about you?
Nothing. A national figure is an average of a sample, and individual scores inside any country span a wide range. The only number that describes you is your own, with its scale and percentile, as our page on what an IQ of 126 means shows. To see where your score falls, take the IQ test.
Quick answers
- What is the average IQ in Nigeria? No measured figure exists that we found. 67.80 is a 2019 compiled estimate and 92.76 an online-table average.
- What is the Nigeria average IQ in the older table? 67, from two samples: 86 men in 1965 and 375 children around 1973.
- Is the IQ of Nigerians measured? Not by a national sample. The figures are compiled studies or online volunteers.
- Is there a Nigeria IQ ranking? Only by list: 173rd of 201 in the compiled table, 107th of 137 in the online one.
- How does the average IQ in Africa compare with Nigeria’s? Reviews give about 82 (tests other than Raven’s, UK norms) and about 80 (Raven’s, US norms) for sub-Saharan Africa as a whole, and the tables disagree on the order of countries.
Sources
- Lynn R, Vanhanen T (2002). IQ and the Wealth of Nations. Praeger: Table 6.1 and the appendix entry for Nigeria, read in the Internet Archive scan.
- Lynn R, Becker D (2019). The Intelligence of Nations, as printed on our average IQ by country page (dataset V1.3.2, read 16 November 2026); International IQ Test 2026 table via World Population Review and our 2026 ranking report.
- Wicherts JM, Dolan CV, van der Maas HLJ (2010). A systematic literature review of the average IQ of sub-Saharan Africans. Intelligence 38(1), 1-20 (abstract read).
- Wicherts JM, Dolan CV, Carlson JS, van der Maas HLJ (2010). Raven’s test performance of sub-Saharan Africans. Learning and Individual Differences 20(3), 135-151 (abstract read).
- Lynn R, Meisenberg G (2010). The average IQ of sub-Saharan Africans: Comments on Wicherts, Dolan, and van der Maas. Intelligence 38(1), 21-29 (title read).
- Fahrmeier ED (1975). The effect of school attendance on intellectual development in Northern Nigeria. Child Development 46(1), 281 (title confirmed on Crossref; paper not read).
- OECD, PISA 2025 results tables (searched for Nigeria: no row); IEA, TIMSS 2023 participants (read 16 November 2026).
- UNICEF Nigeria, Education (read 16 November 2026; figures undated on the page); World Bank, population, total (2023).
- Percentage, ratio and sample-share figures on this page are IQ Metrics arithmetic on the numbers above.
Keep reading
All articles →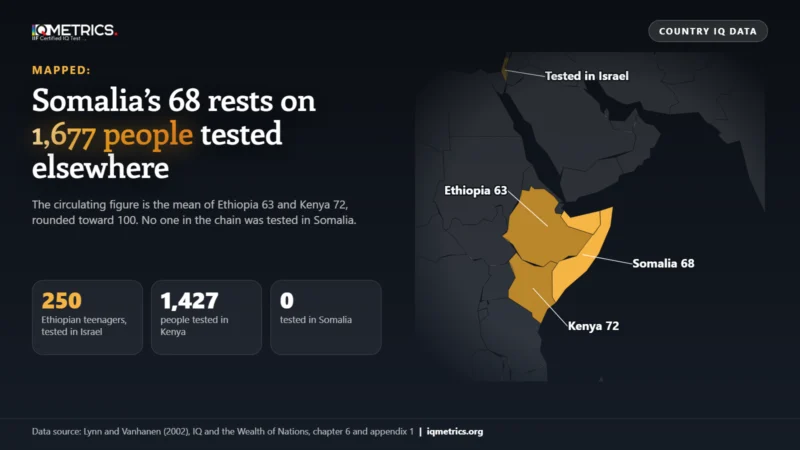 Scores & Scales
Average IQ in Somalia
The average IQ in Somalia is an estimate: the 68 in a 2002 table is the mean of Ethiopia 63 and Kenya 72, resting on 1,677 people tested elsewhere, while an online quiz shows 83.84. How each figure was made, what researchers dispute, and what the World Bank and UNICEF data cover.
 Scores & Scales
Average IQ in India
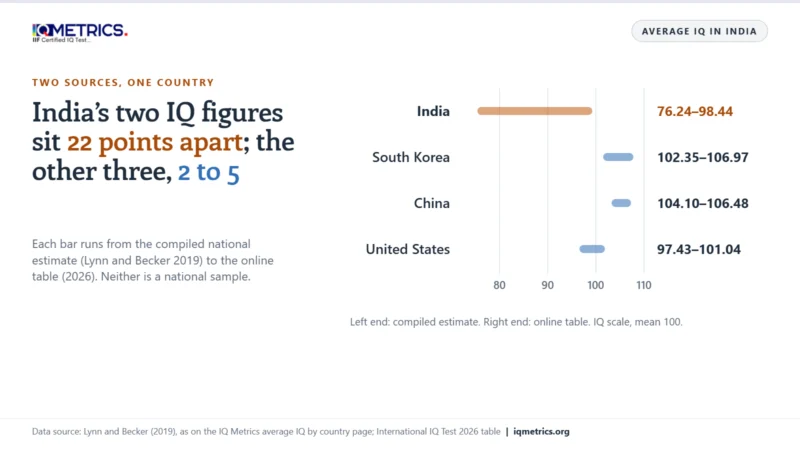
The average IQ in India is 100 on an Indian-normed test. The circulating national figures are 76.24 from a compiled estimate and 98.44 from an online table, 22 points apart. See where each comes from, what PISA 2009+ and ASER 2024 show, and how India compares with China, the US and South Korea.
 Research & Evidence
What Is the Average IQ in the Philippines?
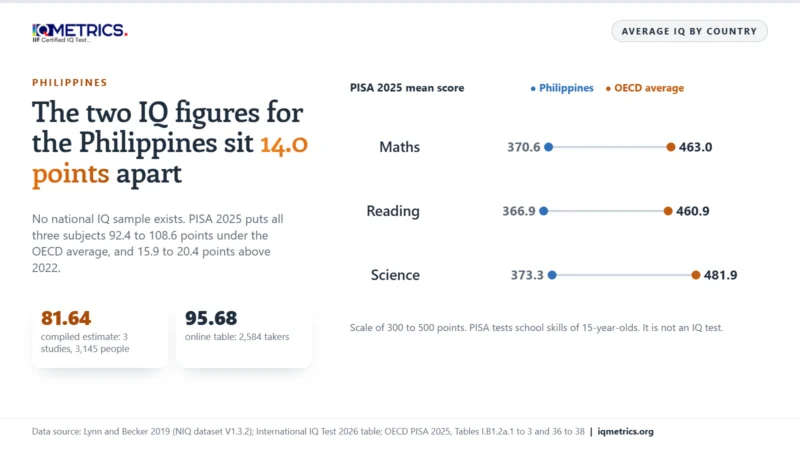
The average IQ in the Philippines is 100 on any local test. Two national figures circulate, 81.64 and 95.68, 14.0 points apart, and neither is a national sample. PISA 2025 maths is 370.6 against an OECD average of 463.0, up 15.9 since 2022.