IQ Metrics
IIF Certified Assessment Start IQ Test
IIF Certified Assessment

Can Your IQ Be Zero?

Scores & Scales

Can Your IQ Be Zero? What a Score That Low Would Actually Mean

Mathematically, the IQ scale has no floor built in – but no test has ever reported a zero. Where the deviation IQ scale actually stops working, why real tests bottom out around 40, and what a score that low would even require.

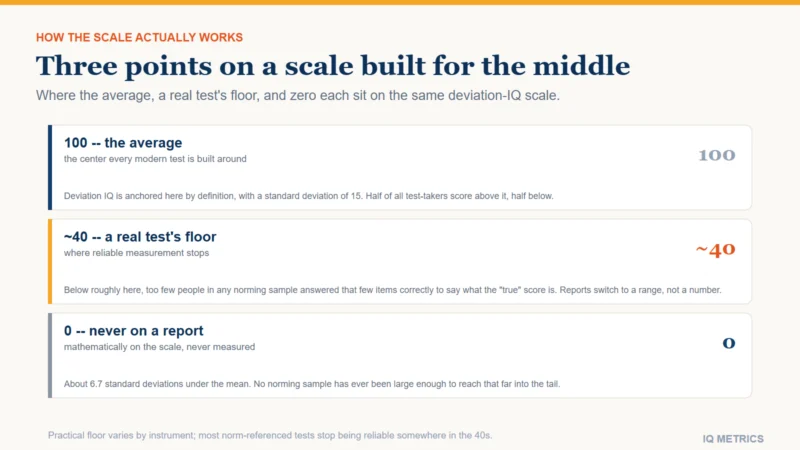
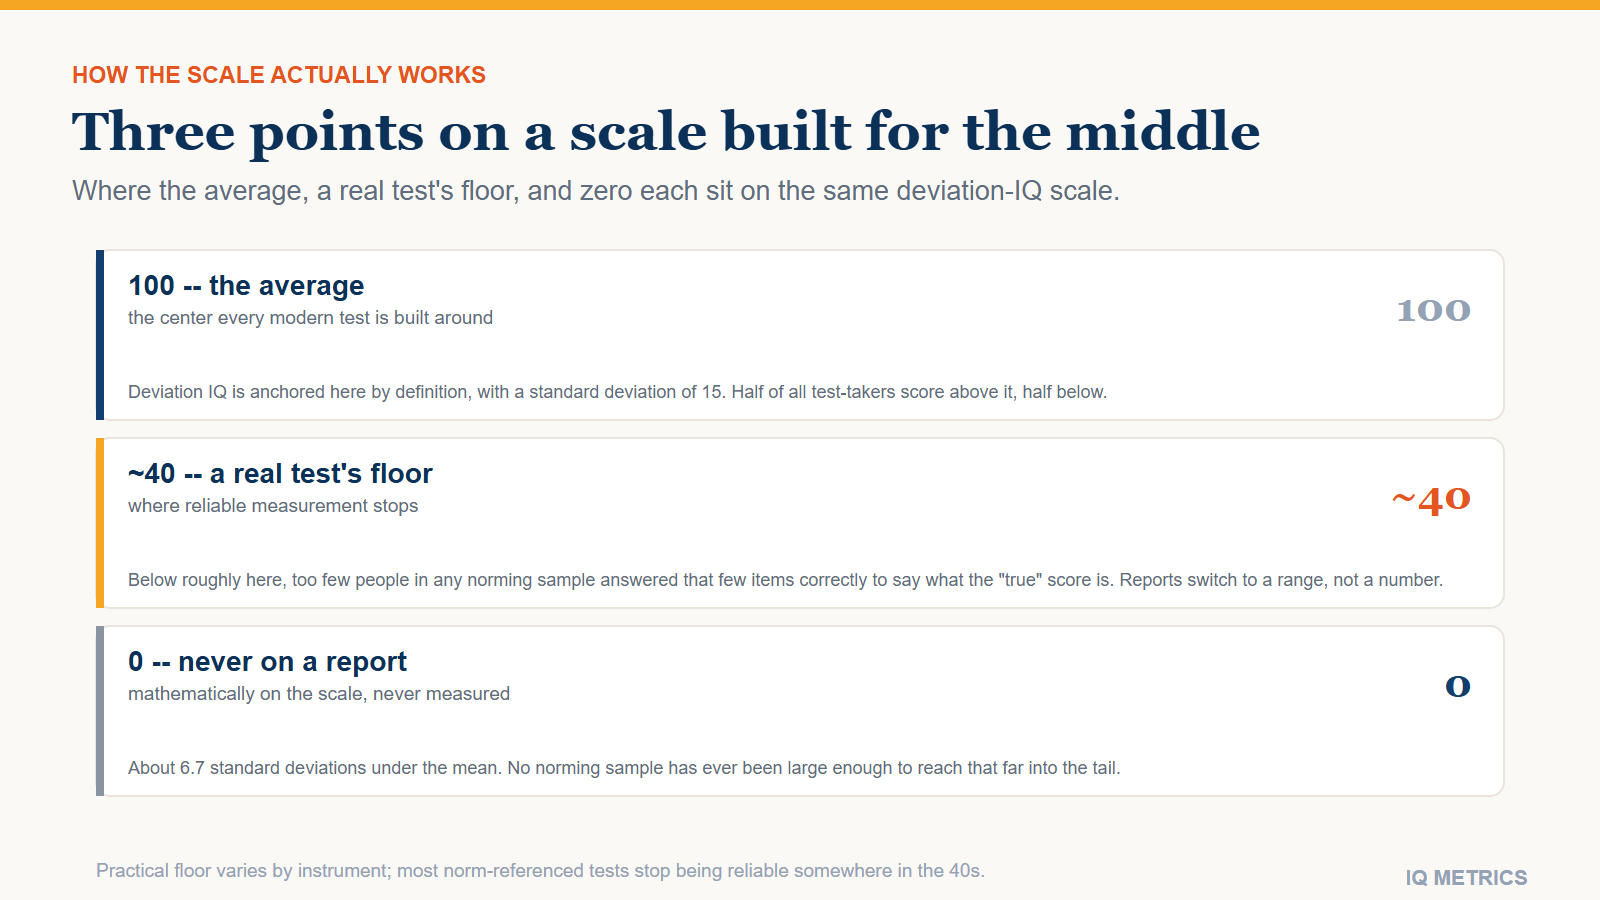
Three cards showing where 100 the average, about 40 a real test's practical floor, and 0 sit on the same deviation IQ scale, with zero about 6.7 standard deviations below the mean.

Mathematically, yes: the deviation IQ scale used by every major test today has no built-in floor, and the arithmetic behind it continues cleanly through zero and into negative numbers. In practice, no test has ever reported a score of zero, and no real test ever will. This article covers how the scale is actually built, where real testing stops working long before it gets anywhere near zero, what a score that low would actually require of a person, and how clinical practice handles the small number of people whose ability genuinely cannot be captured in a single number at all.

That gap between the math and the reality is not a flaw in the test. A ruler with a foot of usable markings can still, in principle, describe a distance of ten miles — the formula never stops working, but nothing anyone would actually measure with it gets anywhere close.

How the modern IQ scale is actually built

Every mainstream test in current use — the Wechsler scales, the Stanford-Binet 5 — reports what is called deviation IQ: a score built around a mean of 100 with a standard deviation of 15 (some scales use 16). How IQ is scored by age covers the mechanics in full, but the short version is that a deviation IQ score is really a statement about rarity relative to same-age peers, not a raw count of correct answers. Scoring 115 does not mean answering 15% more questions right; it means scoring higher than roughly 84% of people the same age who took the same test.

This is a relatively modern convention. Early twentieth-century testing used ratio IQ instead: mental age divided by chronological age, multiplied by 100. Deviation IQ vs. ratio IQ explains why psychologists abandoned that formula, but it matters directly here: under the old arithmetic, a very low score genuinely was reachable. A ten-year-old assessed at a one-year mental age computed to a ratio IQ of 10, mechanically, no special case required. Deviation IQ does not work that way at all, which is a real part of why zero does not come up today even in principle for anyone who can be meaningfully tested.

Why zero is "on" the scale but never reached

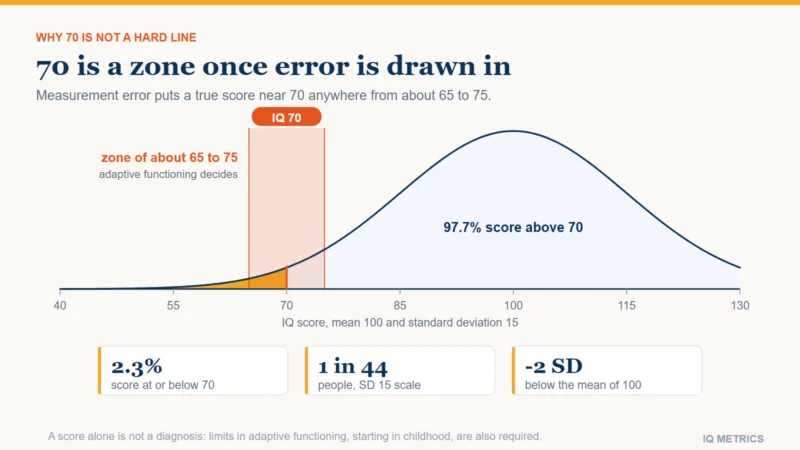
Zero sits 100 points below the mean, which on a standard deviation of 15 works out to about 6.7 standard deviations below average. To see how fast that escalates: about 68% of people fall within 1 standard deviation of the mean (85 to 115), about 95% fall within 2 (70 to 130), and about 99.7% fall within 3 (55 to 145). Each additional standard deviation past that point does not shrink the remaining share by a little; it shrinks it by orders of magnitude. By roughly 6.7 standard deviations out, the normal-curve model treats the remaining share as rarer than one person in the entire population that has ever lived, let alone the few thousand people in any single test’s norming sample. Long before a real distribution gets anywhere near that far out, the bell-curve approximation has already stopped describing anything real. There is no group of people zero could be measured against, because no such group exists to be rare within.

Does IQ even have a "true zero"?

This is a different, more technical question than whether a zero score has ever been recorded, and it has a clean answer: no. Measurement theory distinguishes an interval scale, where equal gaps mean the same thing at any point but zero is arbitrary, from a ratio scale, where zero means a true absence of the thing being measured. Temperature in Celsius is an interval scale — 0°C is not “no temperature,” it is just where water freezes — while weight is a ratio scale, where 0 kg really does mean no mass. Deviation IQ is built as an interval scale. It supports statements like “115 is 15 points above 100,” but it was never built to support a statement like “an IQ of 150 is twice as smart as an IQ of 75,” because doubling and halving are ratio-scale ideas that do not carry over. Even in the hypothetical world where a test could reach all the way down to 0, that score would not mean “zero intelligence” any more than 0°C means zero heat — the scale simply is not built to make that kind of claim in the first place.

That also covers the colloquial use of the phrase, which shows up constantly online as an insult — “their IQ is zero,” “IQ below zero.” As internet shorthand for “acting foolishly,” it is harmless hyperbole. As a literal claim about a measured score, it is not just false in practice, as this article covers throughout; it is not really a coherent claim on this kind of scale to begin with.

Where a real test actually stops measuring

Most standardized tests can reliably measure down to somewhere in the neighborhood of 40, depending on the specific instrument and its norming sample; scores below roughly 20 to 25 are generally treated as unreliable regardless of test. This is a floor effect: once someone is missing nearly every item on the easiest end of a test, the instrument can no longer tell a true score of 35 apart from a true score of 15, because too few people in the norming sample ever scored that low for the statistics to be trustworthy. Researchers have specifically studied how to compute meaningful index scores for children who “floor” the WISC-IV in this way, precisely because the standard scoring tables simply run out.

Three cards showing where 100 the average, about 40 a real test's practical floor, and 0 sit on the same deviation IQ scale, with zero about 6.7 standard deviations below the mean.
Three cards showing where 100 the average, about 40 a real test’s practical floor, and 0 sit on the same deviation IQ scale, with zero about 6.7 standard deviations below the mean.

When a test hits this wall, a competent report does not print a guess. It reports a ceiling on the estimate instead — something like “below 40” — rather than pretending to distinguish one very low score from another with a precision the data cannot support. How to read an IQ test report covers what a real report actually contains, which is always a range and a set of index scores, never a single bare number standing in for a person’s whole ability.

Your own number

Where would your own score land?

Take the IIF-certified assessment and get your score with the scale it was measured on, the percentile it corresponds to and the confidence range around it — the three figures most online tests leave out.

Find your IQ score now! →

Secure & encryptedInstant results10–20 minutes

What a score that low would actually require

Getting close to a test’s floor means missing nearly every item written for the easiest end of the norming sample — typically material aimed at very young children on an adult-normed test. Below that point, the practical problem stops being about reasoning ability at all. Sitting through a timed, instructed, standardized assessment requires baseline attention, motor coordination and communication just to produce a response in the first place. Someone whose impairment is severe enough to theoretically approach a near-zero score is, in the overwhelming majority of cases, someone for whom those basic prerequisites cannot be assumed either — which means the instrument cannot separate “very low reasoning ability” from “unable to engage with this particular kind of task” at all.

For research purposes, specialists sometimes work with extended or extrapolated norms that project a curve mathematically below a test’s actual floor, the same way extended norms exist above a test’s ceiling for profoundly gifted children. Those extrapolated numbers are useful for research comparisons across studies, but nobody treats them as a directly observed score in the way a report hands a family a number like 92. They are a modeling tool, built on the assumption that the same statistical pattern continues past the point where it was ever actually observed — which is exactly the assumption that stops being trustworthy the further out it is pushed.

How very low ability is actually assessed today

Clinical practice has moved well past the idea of a single IQ cutoff for this reason. The DSM-5 and the American Association on Intellectual and Developmental Disabilities both define the severity of intellectual disability primarily through adaptive functioning — conceptual, social and practical skills for daily life — with a test score treated as supporting evidence rather than the sole basis for a diagnosis. That shift happened specifically because a bare number was never an adequate description on its own, at either end of the scale but especially at the low end, where the measurement itself becomes least trustworthy exactly where the stakes for getting it right are highest.

The high end runs into the identical problem, in reverse

The ceiling effect is the mirror image of everything above: every test also has a highest score it can report, set by how many people in its norming sample answered every item correctly, and claims that outrun it deserve the same scrutiny. The highest IQ ever recorded covers what happens when a headline number tries to describe someone past the point where any real test can actually distinguish one score from another — the same honest-measurement problem this article covers, just at the opposite tail.

The bottom line

A score of zero is a real point on the deviation IQ formula and a point no test has ever measured, for the same reason: the formula is built to describe the middle of a distribution precisely, and it keeps working on paper long after the actual population it describes has run out. This is the same idea behind a ranking like average IQ by college major being meaningful only as a group comparison, never a verdict on one person: a score only means something next to the sample it was measured against, and at either extreme of the curve, that comparison sample has already run out.

Share this article

Know someone who keeps seeing these numbers quoted without the scale they were measured on? Send it to them.

Tagged deviation iq, floor effect, intellectual disability, iq classifications, iq percentile, iq scale, IQ Science, IQ Score, lowest iq, norm-referenced testing, psychometrics, ratio iq, standard deviation

IQ and Crime

Research & Evidence

IQ and Crime: What the Correlation Does and Does Not Explain

IQ and crime show a real but modest correlation: offenders average eight to ten points lower than non-offenders. What actually drives the gap, including a specific environmental cause with its own evidence, and what the finding cannot tell you about any one person.

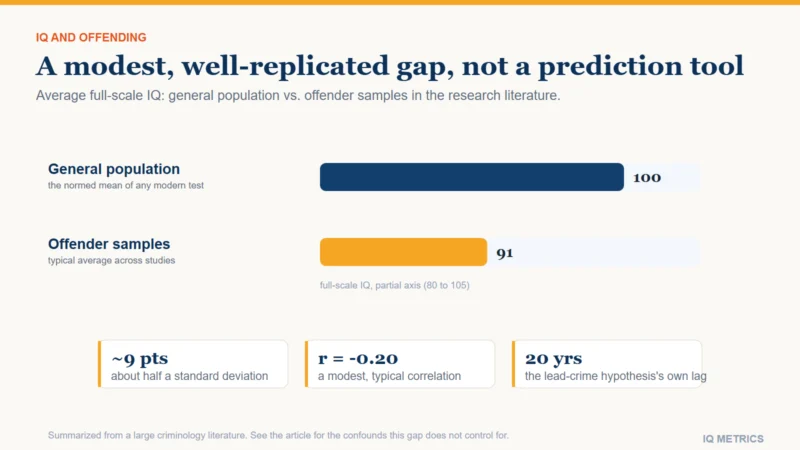
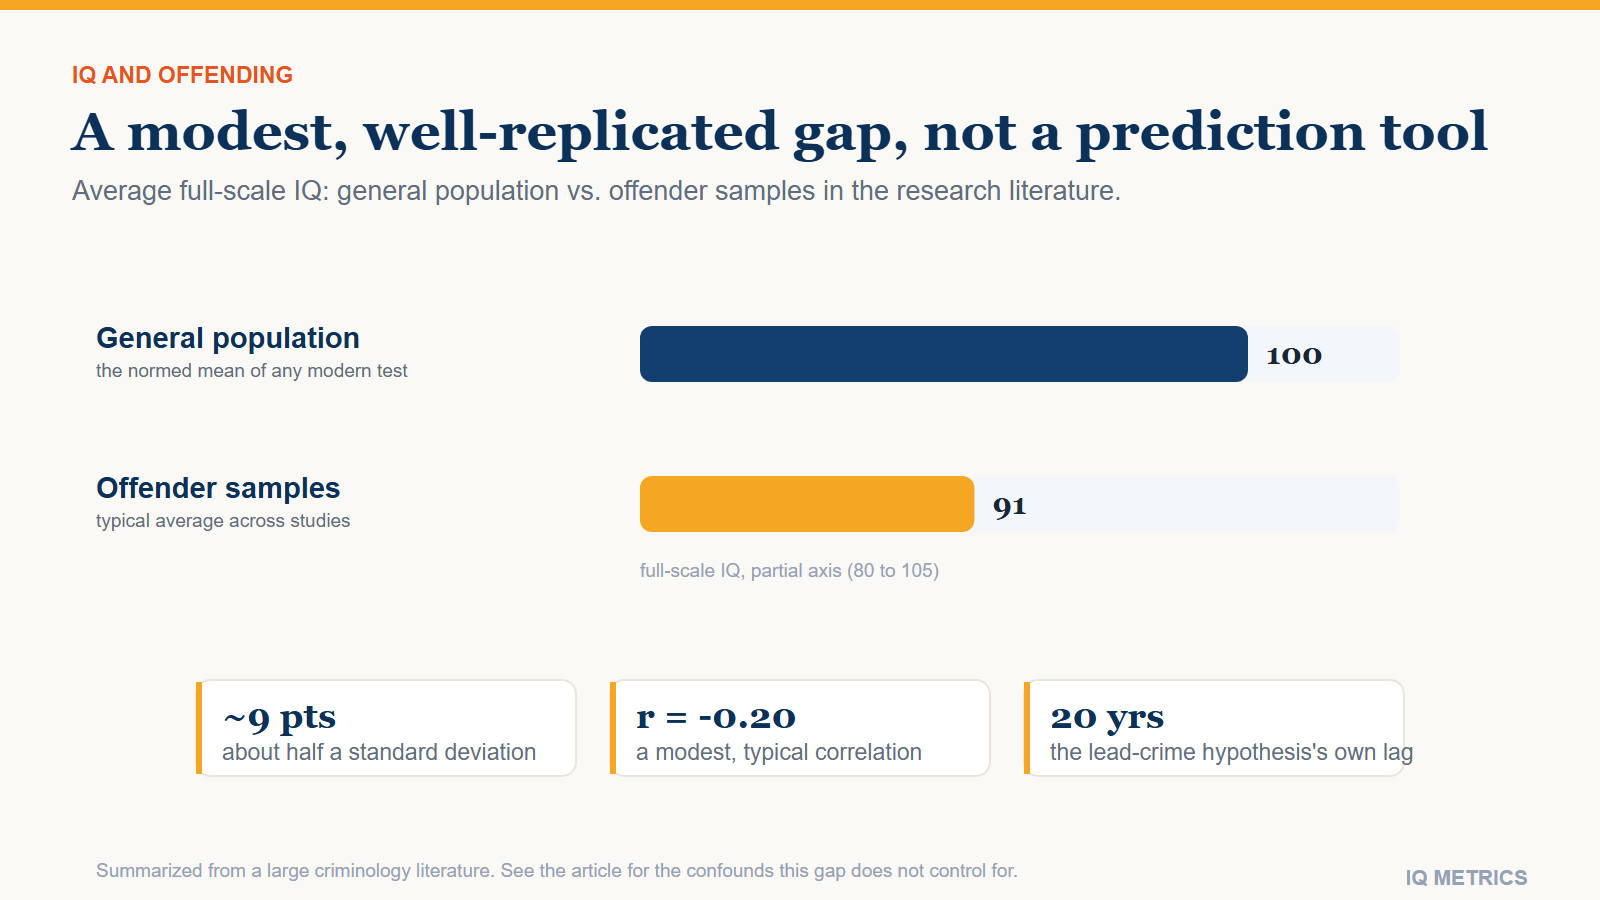
Bar chart comparing average full-scale IQ of the general population, 100, with offender samples, 91, an approximately 9-point gap described in criminology research.

IQ and crime show a real but modest correlation. People convicted of crimes score, on average, about eight to ten points lower on IQ tests than people who are not — roughly half a standard deviation, with a correlation researchers typically report around r = -0.20. That pattern shows up consistently across decades of criminology research, and it explains far less than it sounds like it should: the correlation is small, it says nothing about any individual, and a large share of it traces back to causes that have nothing to do with intelligence itself. This article covers the size of the finding, what actually seems to be driving it, and where the research gets misused.

How big is the IQ-crime correlation, really?

An r of -0.20 means intelligence and offending share only a small slice of their variation — on the order of 4% by the crude squared-correlation arithmetic researchers use as a rough guide — alongside dozens of other factors that matter far more for any individual case: family stability, peer group, substance use, neighborhood, and plain chance among them. The eight-to-ten-point gap is consistent enough across studies to be treated as a solid finding, but “solid” describes the correlation’s reliability, not its size or its meaning.

Reviews in this area go back generations. Travis Hirschi and Michael Hindelang’s influential 1977 synthesis is often credited with re-establishing IQ as a variable criminology could not responsibly ignore, after some decades in which the field treated it as close to a taboo subject following its misuse earlier in the twentieth century. Later meta-analyses have generally confirmed the size of the gap they reported, even as the explanations offered for it have grown more careful.

A pattern that only holds for some kinds of crime

The eight-to-ten-point gap is not uniform across offense types. It shows up most consistently for repeated, impulsive and violent offending, the kind most closely tied to weak executive function and poor future-planning. White-collar crime tells close to the opposite story: fraud, embezzlement and similar offenses are disproportionately committed by people with above-average education and, by extension, likely above-average measured cognitive ability — the institutional access that large-scale financial crime generally requires is exactly what low educational attainment forecloses. A single “IQ and crime” correlation is really an average across very different phenomena with different, sometimes opposite, relationships to cognitive ability.

What the correlation is not evidence of

A correlation this size cannot predict who will offend. Most people with below-average IQ scores never commit a crime, and most people convicted of crimes do not have unusually low scores; the two distributions overlap heavily, with only the averages pulled apart. Reading the finding as “low IQ causes crime” also skips past a more basic explanation researchers take seriously: detection and prosecution are not neutral processes. Cultural bias in IQ testing and what national IQ rankings cannot support both cover how easily aggregate score comparisons get misused when the groups being compared differ in far more than the trait being measured.

Socioeconomic status and IQ is the confound that does the most work here. Poverty is linked to worse schooling, more environmental exposure to cognitive harms, more contact with a justice system that treats the same behavior differently by neighborhood, and lower average IQ scores — all independently of each other. Statistical models that control for socioeconomic status typically shrink the IQ-crime correlation, though it does not disappear entirely, which is part of why researchers still treat it as real if modest rather than pure confounding.

Your own number

Where would your own score land?

Take the IIF-certified assessment and get your score with the scale it was measured on, the percentile it corresponds to and the confidence range around it — the three figures most online tests leave out.

Find your IQ score now! →

Secure & encryptedInstant results10–20 minutes

The lead-crime hypothesis: an environmental cause for both

Bar chart comparing average full-scale IQ of the general population, 100, with offender samples, 91, an approximately 9-point gap described in criminology research.

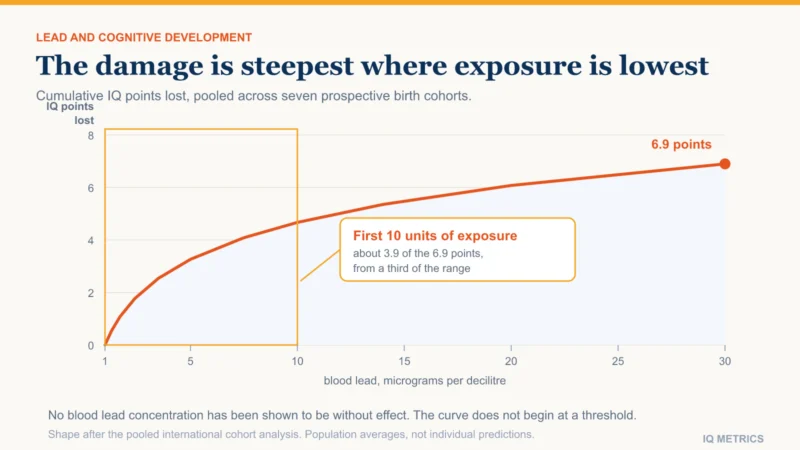
One of the more evidence-backed explanations for part of the correlation runs through a specific environmental exposure: leaded gasoline. Economists Rick Nevin and Jessica Wolpaw Reyes independently found that the rise and fall of childhood lead exposure, tracked through leaded gasoline consumption, closely parallels the rise and fall of violent crime rates roughly two decades later — the lag matching the time it takes a child exposed to lead in early life to reach peak crime-committing age. Lead exposure and IQ covers the underlying dose-response relationship: lead lowers IQ scores and, separately, appears to impair impulse control through the same neurological pathways, giving it two routes into offending rather than one.

The hypothesis is taken seriously in economics and public health, not accepted as the whole story. It rests on an ecological correlation across time, a weaker form of evidence than a controlled study of individuals, and it competes with several other explanations proposed for the same decades-long rise and fall in crime — changes in policing, incarceration rates, the crack cocaine epidemic’s own arc, and legalized abortion among them. Most researchers in the area now treat lead as one real contributor among several, not a single cause that settles the question.

Why this research keeps getting misused

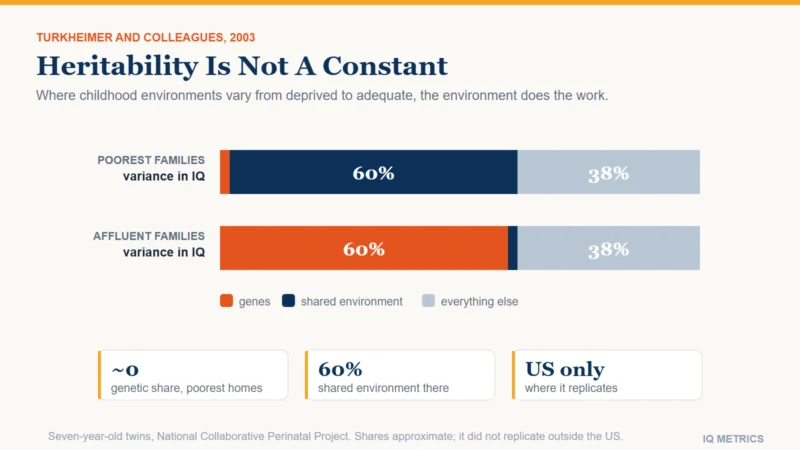
The same small correlation gets stretched in two directions by people with opposite agendas: read as proof that IQ determines crime, to justify broad claims about groups, or dismissed entirely to avoid an uncomfortable but real, modest finding. Both misreadings skip the same step, which is asking what is actually being measured and what else moves alongside it. Is IQ genetic? and what twin studies on IQ heritability actually show cover a closely related trap: even a trait with substantial heritability within a population says nothing about why two different groups or two different eras differ on average, because environment and genes are tangled together at the population level in ways a heritability estimate cannot untangle.

This is not a new debate. The eugenics era of IQ testing shows how an earlier generation of researchers used exactly this kind of correlational data, stripped of its confounds and caveats, to justify forced sterilization and immigration restriction. That history is a direct warning about what happens once a modest, confounded correlation gets treated as a settled, deterministic fact.

The responsible reading of the IQ-crime literature is the boring one: a small, real, well-replicated correlation, driven substantially by shared environmental disadvantage and at least partly by specific, identifiable exposures like lead, that explains almost nothing about any individual person and should never be used to sort people — only to inform where prevention resources, better schooling, lead abatement, early intervention, might do the most good.

Where self-control fits in

A fair amount of criminology research treats weak self-control and executive function as a more direct predictor of offending than IQ itself — planning ahead, resisting impulse, managing frustration. Those are largely the same executive functions covered in the research on ADHD in people with a high IQ, where attention and impulse control run on a mostly separate track from reasoning ability. The overlap is a useful reminder that “smart” and “self-controlled” are different traits measured by different tools, whether the setting is a classroom, a hiring test, or a criminology dataset. Programs that directly train planning and impulse-control skills in at-risk children show up in the intervention literature far more often than programs aimed at raising IQ itself, which is a reasonable response to just how separate the two systems appear to be.

The policy implications researchers actually draw from this literature point toward prevention, not sorting: universal early-childhood cognitive enrichment, removing lingering environmental sources of lead exposure such as old pipes and legacy soil contamination, and addressing the socioeconomic conditions that independently predict both lower scores and higher offending. None of that requires believing IQ is a strong individual predictor of criminality; it only requires taking the population-level correlation seriously enough to address its most plausible shared causes.

The bottom line

The IQ-crime correlation is real, small, and thoroughly confounded with poverty, schooling, and at least one specific environmental exposure with its own well-studied mechanism. It is a finding for policy researchers thinking about prevention at a population level, not a tool for judging any individual, and the research literature itself treats it with far more caution than the number tends to get treated with once it leaves an academic paper.

Share this article

Know someone who keeps seeing these numbers quoted without the scale they were measured on? Send it to them.

Tagged confounding variables, correlation vs causation, criminology, Cultural Bias, executive function, heritability, IQ and crime, IQ Science, lead exposure, lead-crime hypothesis, research and evidence, self-control, Socioeconomic Status, twin studies

IQ Tests in Job Interviews

Taking a Test

IQ Tests in Job Interviews: What Employers Actually Use and Why

An IQ test for a job interview is usually branded a cognitive ability assessment, like the Wonderlic. What it actually measures, why a 1998 meta-analysis made employers take it seriously, whether it is legal, and how to prepare.

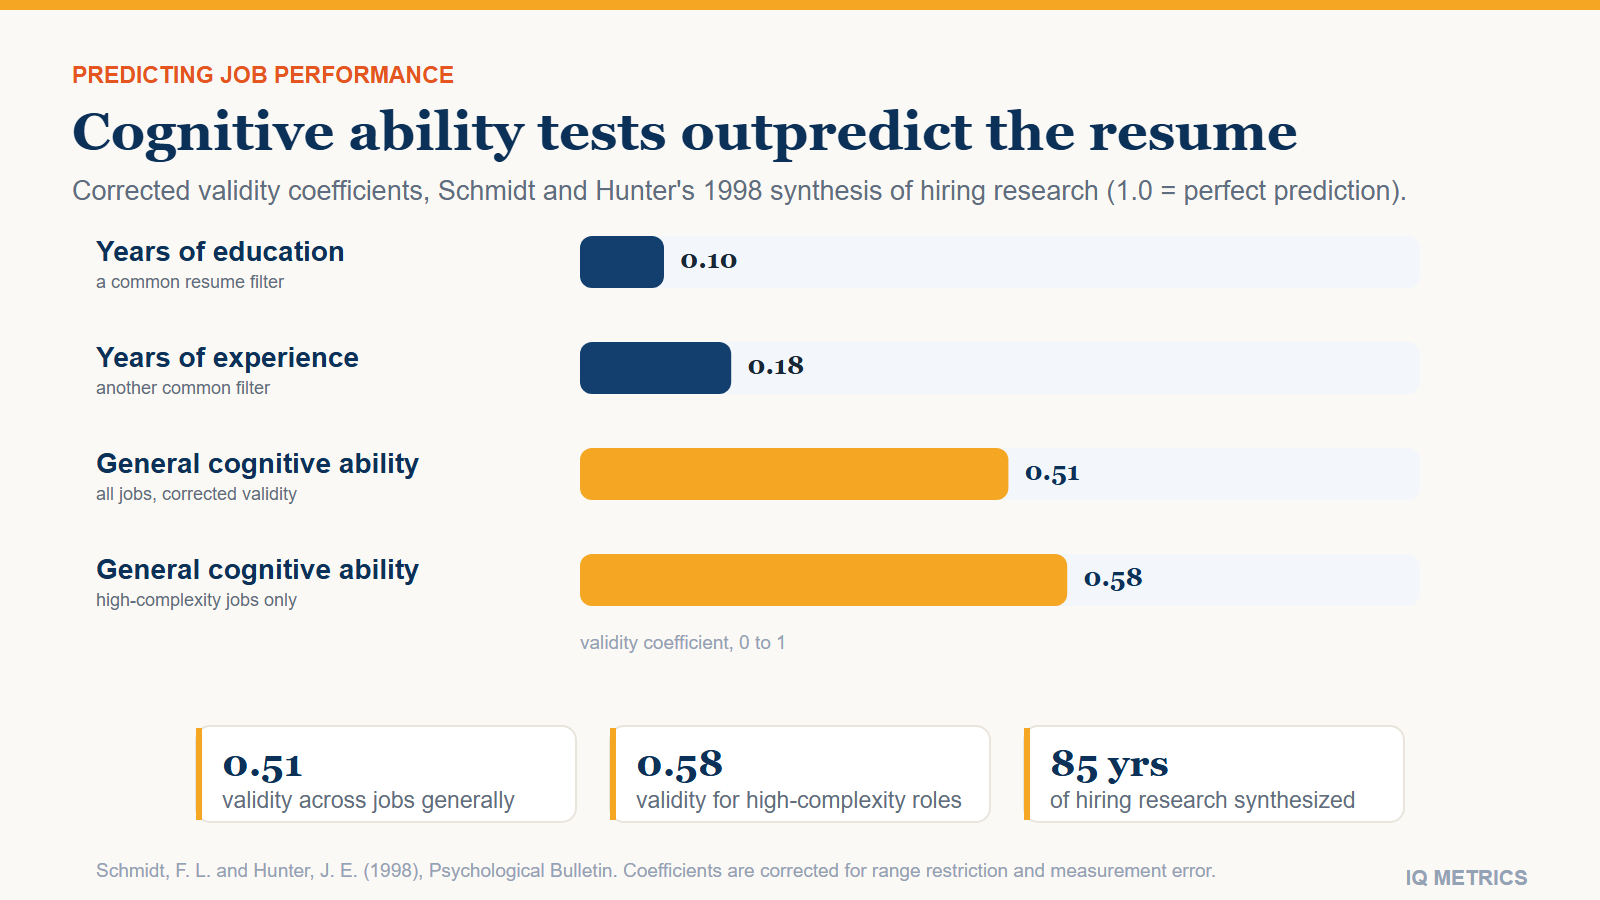
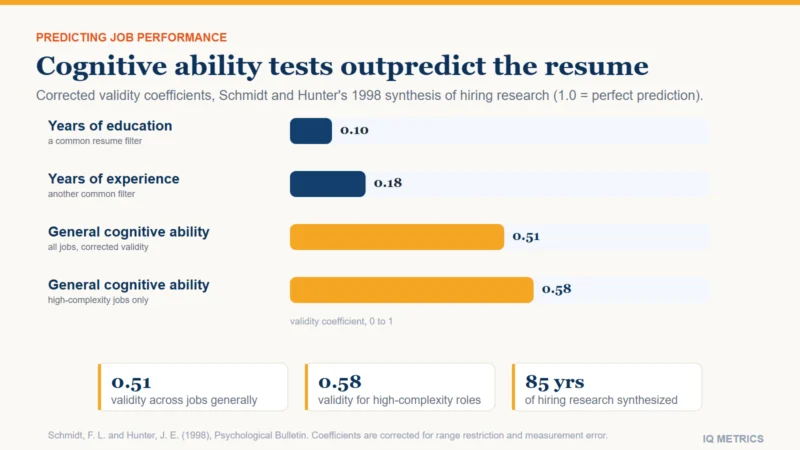
Bar chart of validity coefficients for predicting job performance: years of education 0.10, years of experience 0.18, general cognitive ability 0.51 across jobs and 0.58 for high-complexity jobs, from Schmidt and Hunter 1998.

Yes, an IQ test for a job interview is a real thing at some employers — it just rarely goes by that name. What shows up in an application process is usually branded a “cognitive ability assessment,” an “aptitude test,” or a specific product name like the Wonderlic, and it measures largely the same general reasoning ability an IQ test does, scored and validated for a different purpose. This article covers what these tests actually are, why employers use them despite the controversy, which ones you are likely to see, whether they are legal, and how to prepare without wasting your time.

Is a hiring test really an "IQ test"?

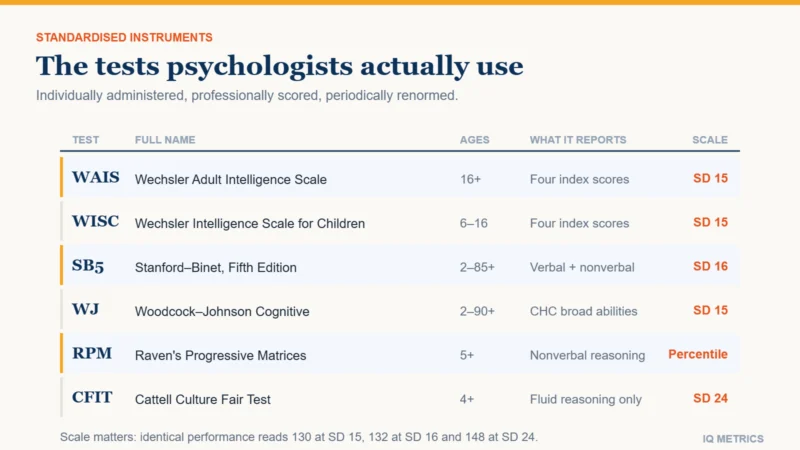
Not officially, and the distinction matters. A clinical IQ test like the WAIS is administered one-on-one by a trained psychologist, takes an hour or more, and is normed for diagnostic use. Professional IQ tests covers those instruments in detail. A pre-employment cognitive ability test is usually a short, timed, group- or online-administered instrument, validated specifically for predicting job performance rather than for clinical use — and employers avoid the term “IQ test” partly for the legal reasons covered further down.

Under the hood, both are measuring overlapping ground. Verbal reasoning, numerical reasoning and pattern recognition are common to nearly every test in the family built around the general factor of intelligence. That overlap is why a hiring test correlates with an IQ score even though it is scored and marketed as something else entirely.

Scoring also works differently in practice. A clinical IQ report compares one number against the general population. A hiring test more often reports a percentile against a role-specific norm group — other applicants for similar jobs — and many employers set a minimum threshold rather than ranking candidates by raw score past that point, specifically to avoid over-weighting small differences between two qualified people.

Why employers use them at all

The case for cognitive testing in hiring rests on one of the more replicated findings in industrial psychology. In a 1998 synthesis of 85 years of selection research, Frank Schmidt and John Hunter found that general mental ability tests predicted job performance with a corrected validity of about 0.51 across jobs generally, rising to roughly 0.58 for high-complexity roles — the strongest single predictor they examined, ahead of work samples and structured interviews, and well ahead of the resume staples: years of education came in around 0.10 and years of experience around 0.18.

Bar chart of validity coefficients for predicting job performance: years of education 0.10, years of experience 0.18, general cognitive ability 0.51 across jobs and 0.58 for high-complexity jobs, from Schmidt and Hunter 1998.

Put plainly, a candidate’s general cognitive ability score predicts how well they go on to perform in a role better than how many years they spent in school, or in a similar job, does. That is the finding employers who use these tests are leaning on. It is also the finding critics push back against, since a single, decades-old meta-analysis has limits: job performance ratings are themselves imperfect, and validity varies by role, by test, and by how the score actually gets used in the final decision.

Not every industrial psychologist agrees a single general-ability score is the best approach even where those numbers hold up. A competing view favors narrower, job-specific aptitude tests — a coding test for a software role, a numerical-reasoning test for an analyst role — on the theory that a task-matched measure adds useful signal on top of general ability without necessarily replacing it. In practice, many of the assessments candidates actually sit blend both approaches.

Which industries lean on these tests hardest

Cognitive ability testing shows up most visibly in a handful of settings. The NFL has administered the Wonderlic to draft prospects since the 1970s, less to predict who will play well than as one data point among many in an already expensive evaluation process. Quantitative trading firms and parts of finance use numerical-reasoning-heavy assessments as an early screen, on the theory that raw quantitative reasoning speed matters directly to the job. Large consulting firms and some technology employers use shorter, broader assessments earlier in the pipeline, often before a human reviews the resume at all, because the tests scale to thousands of applicants far more cheaply than early-round interviews do.

Your own number

Where would your own score land?

Take the IIF-certified assessment and get your score with the scale it was measured on, the percentile it corresponds to and the confidence range around it — the three figures most online tests leave out.

Find your IQ score now! →

Secure & encryptedInstant results10–20 minutes

Which tests you are likely to see

  • Wonderlic Personnel Test — 50 questions in 12 minutes, widely used across industries and well known for its use in NFL prospect evaluation.
  • Criteria Cognitive Aptitude Test (CCAT) — a similarly short, timed test common in corporate and tech hiring pipelines.
  • Predictive Index Cognitive Assessment — another timed reasoning test, often paired with a separate personality or behavioral survey.
  • In-house or platform-specific assessments — some large employers and hiring platforms build their own, but nearly all borrow the same verbal, numerical and abstract-reasoning item types.

Average IQ by occupation shows how scores have historically clustered by field, even though the underlying data there is decades old and scored on a different scale than any test in current use.

Is it legal to test candidates this way?

In the United States, yes, with real constraints. Cognitive ability tests can produce group score differences that draw legal scrutiny under adverse-impact rules; the four-fifths rule explains the specific ratio regulators use to flag a test result for a closer look, and whether IQ tests are legal for hiring covers the broader legal history, including Griggs v. Duke Power, the 1971 Supreme Court case that first required an employment test to be job-related rather than simply convenient. A test that is properly validated for a specific role can still be used lawfully even where it produces a group difference; one that is not validated is the version that draws legal trouble.

What a cognitive ability score actually predicts at work goes further into how employers are supposed to justify using one of these tests in the first place, which is worth reading before assuming a test you were asked to take is either clearly fair or clearly not.

A newer wrinkle is AI-scored and AI-proctored assessments, which raise similar adverse-impact questions in a new form; how AI agents and proctored hiring tests interact covers what is different about auditing an algorithmic scorer versus a fixed answer key.

How to prepare without wasting your prep time

Practice effects on cognitive ability tests are real but modest, and tend to plateau after a couple of exposures — enough to knock off first-time jitters and unfamiliarity with the item types, not enough to meaningfully raise the ceiling on a fixed reasoning ability. How to prepare for an IQ test covers the same territory in more depth. The highest-value prep for a timed hiring test specifically is usually: run through one full timed practice set of the actual item types — verbal analogies, number series, spatial pattern completion — so the format itself is not a surprise, get a full night’s sleep beforehand, and budget your time per question rather than getting stuck defending one answer. If a disability affects testing, most employers using a validated assessment are required to offer reasonable accommodations, such as extended time, on request — worth raising with a recruiter before the test date rather than after a low score.

It is also worth remembering what these scores do and do not mean for you personally. The importance of IQ tests in education and employment covers the wider picture; a single timed test is one input into one hiring decision, not a verdict on your intelligence, and even the strongest predictors in the Schmidt-and-Hunter numbers above leave roughly three-quarters of the variation in job performance unexplained by cognitive ability alone.

The bottom line

If a job posting mentions an assessment, an aptitude test, or a “cognitive” screening step, there is a good chance it is functionally a cognitive ability test even if the words “IQ test” never appear. The research case for using one is genuinely strong, the legal rules around using one responsibly are specific, and the most useful thing a candidate can do is show up rested, familiar with the format, and not over-invested in what one timed score says about them.

Share this article

Know someone who keeps seeing these numbers quoted without the scale they were measured on? Send it to them.

Tagged adverse impact, career and iq, cognitive ability test, employment testing, hiring assessment, IQ Science, iq test for job interview, iq testing, job performance prediction, pre-employment testing, test anxiety, Test Preparation, wonderlic, work and hiring

Highest IQ Ever Recorded

Scores & Scales

The Highest IQ Ever Recorded: What the Famous Numbers Actually Rest On

The highest IQ ever recorded is usually given as Marilyn vos Savant’s 228 or William James Sidis’s claimed 250 to 300 – neither from a test in use today. Where the famous numbers actually come from, and what a modern test can really report.

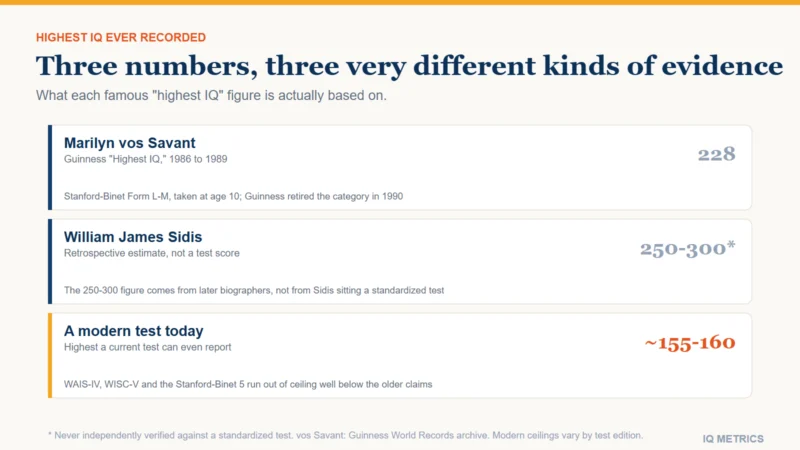
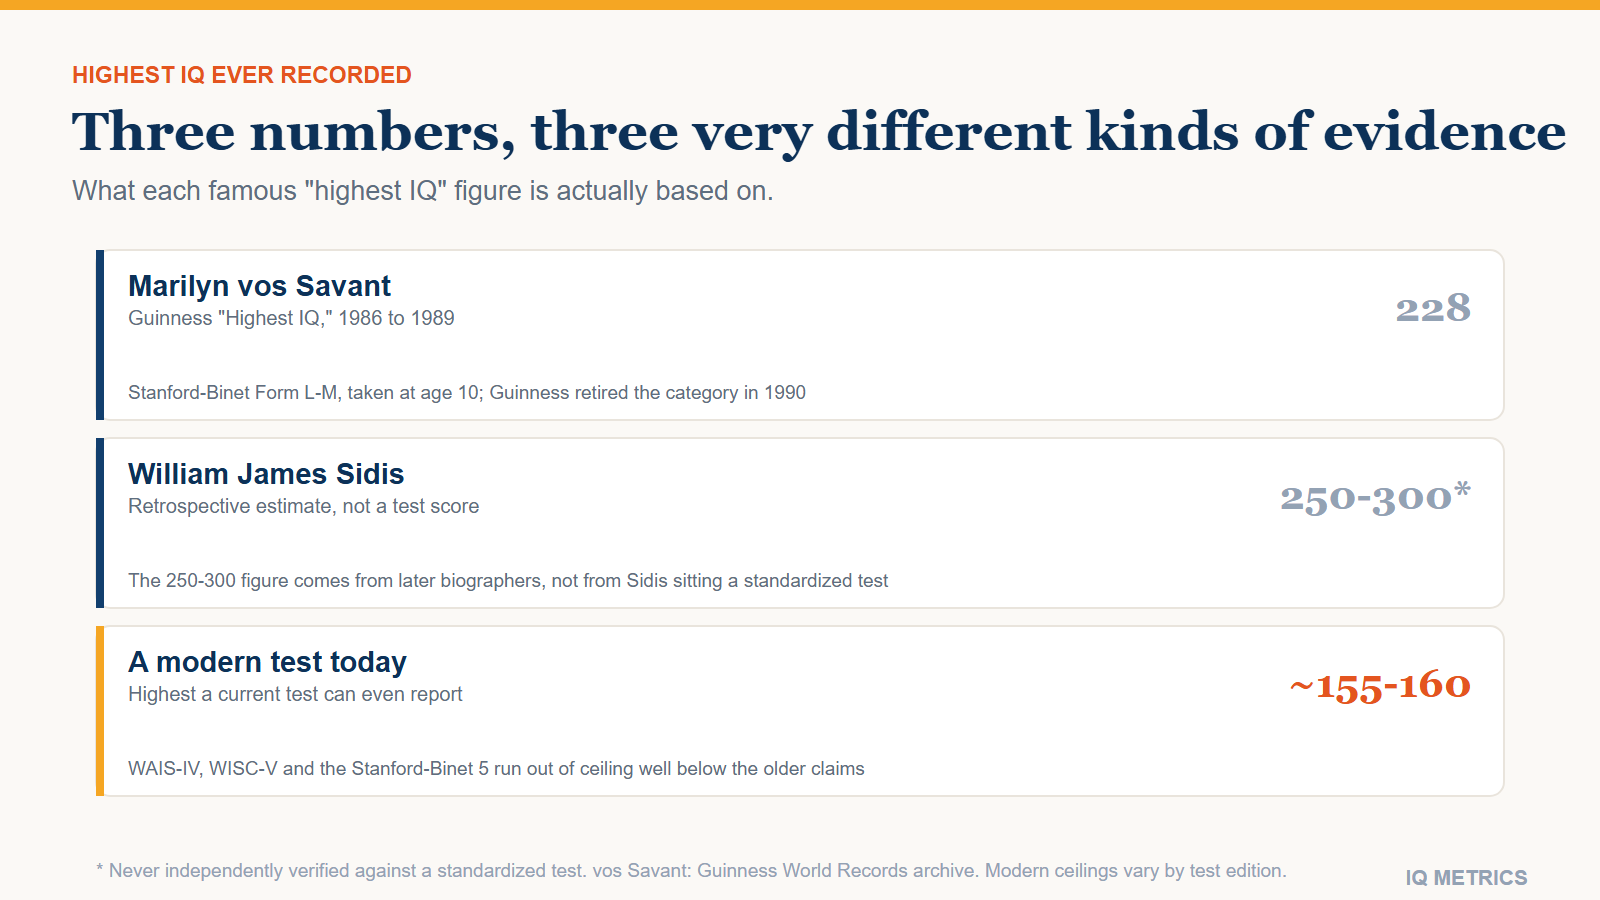
Comparison of three highest-IQ figures: Marilyn vos Savant's 228 Guinness record, William James Sidis's unverified 250 to 300 estimate, and the roughly 155 to 160 ceiling of a modern IQ test.

No single person holds a verified “highest IQ ever recorded.” The two numbers that circulate most — Marilyn vos Savant’s 228 and William James Sidis’s claimed 250 to 300 — come from a discontinued Guinness category and a number nobody ever actually measured, not from a test anyone uses today. This article covers where each famous figure really comes from, why “IQ over 200” claims keep circulating anyway, and what the highest score a modern test can even report looks like.

Marilyn vos Savant and the Guinness record

Marilyn vos Savant is the source of the most-cited number: 228, reportedly scored on the Stanford-Binet Form L-M at age ten. Guinness World Records listed her under “Highest IQ” from 1986 to 1989, then retired the category entirely in 1990, citing concerns that scores at the extreme end of any test are far less reliable than scores nearer the middle of the curve. vos Savant later entered the Guinness Hall of Fame instead, and Guinness has not run a “highest IQ” category since.

That retirement is itself the most important fact about the number. A ratio-scored childhood test like the Form L-M, built on age norms, compresses enormous uncertainty into one figure once a child is answering questions written for people twice their age. The 228 was real in the sense that it was a documented score on a real test, but it was never intended, even by the test’s own authors, to be read the way “228” gets read now.

vos Savant went on to write the long-running “Ask Marilyn” column in Parade magazine, and her most famous moment there had nothing to do with her IQ score. In 1990 she correctly solved the Monty Hall probability problem in print and was met with thousands of letters, many from mathematicians and PhDs, insisting she was wrong. She was not: later simulations and formal proofs confirmed her answer. The episode is often cited as a real demonstration of the reasoning ability behind the number, independent of whether 228 itself was ever the right way to state it.

William James Sidis and the 250-to-300 estimates

Sidis is the name attached to the highest numbers of all, often quoted as 250 to 300. The important detail is that Sidis never sat a modern standardized IQ test and produced that number himself. The figure originates from later biographers and popular writers, working backward from his documented precocity — reading fluently at eighteen months, lecturing Harvard mathematicians at eleven — not from a scored assessment. It is an estimate of an estimate, several steps removed from anything a psychometrician would call data.

None of that means Sidis was not exceptionally able; his early academic record is well documented and genuinely remarkable. It means the specific number 250 or 300 is best read as folklore that attached itself to a real person, not as a test result comparable to anyone else’s score.

Why do old "genius" scores look so much bigger than modern ones?

Both numbers above come from an era when child IQ scores were commonly calculated as ratio IQ: mental age divided by chronological age, multiplied by 100. Deviation IQ vs ratio IQ covers why psychologists abandoned that formula, but the short version matters here directly: a bright seven-year-old answering questions written for a twelve-year-old produces a ratio score well above 150 almost automatically, because the formula rewards raw age-advancement rather than measuring how rare that advancement actually is among same-age peers.

Modern tests use deviation IQ instead, scored against people the same age, on a scale with a fixed standard deviation — usually 15 or 16 points, as this comparison of the two conventions explains. That single change is most of the reason nobody produces a documented score anywhere near 200 today: the scale itself no longer allows the kind of runaway number a precocious child could generate under the old formula.

A worked example makes the mechanism concrete. A seven-year-old who can correctly answer questions written for an average twelve-year-old has a mental age of twelve against a chronological age of seven: 12 divided by 7, times 100, works out to a ratio IQ of about 171, purely from being five years ahead on that test’s ladder of questions. Push the same child two more years ahead and the ratio IQ climbs past 200, without the child’s underlying ability changing at all — only the arithmetic changes. A deviation-scored test never does this, because it asks a different question entirely: not “how many years ahead is this child,” but “how rare is this performance among children the same age.”

Your own number

Where would your own score land?

Take the IIF-certified assessment and get your score with the scale it was measured on, the percentile it corresponds to and the confidence range around it — the three figures most online tests leave out.

Find your IQ score now! →

Secure & encryptedInstant results10–20 minutes

A modern contrast: how today’s exceptional scorers talk about their own numbers

Mathematician Terence Tao is sometimes cited as having tested around 230 as a child, a ratio-IQ-era number from the same mold as vos Savant’s and Sidis’s. Tao himself has repeatedly downplayed the figure in interviews, pointing out that raw processing speed and pattern recognition — the kind an early ratio-IQ test rewards heavily — matter far less to real mathematical work than sustained effort, collaboration, and simply working on the right problem at the right time. That is a useful corrective on its own: even someone who would plausibly test in the far tail of ability today treats a single childhood number as far less meaningful than the internet treats it.

Comparison of three highest-IQ figures: Marilyn vos Savant's 228 Guinness record, William James Sidis's unverified 250 to 300 estimate, and the roughly 155 to 160 ceiling of a modern IQ test.
Comparison of three highest-IQ figures: Marilyn vos Savant’s 228 Guinness record, William James Sidis’s unverified 250 to 300 estimate, and the roughly 155 to 160 ceiling of a modern IQ test.

What can a modern test actually report?

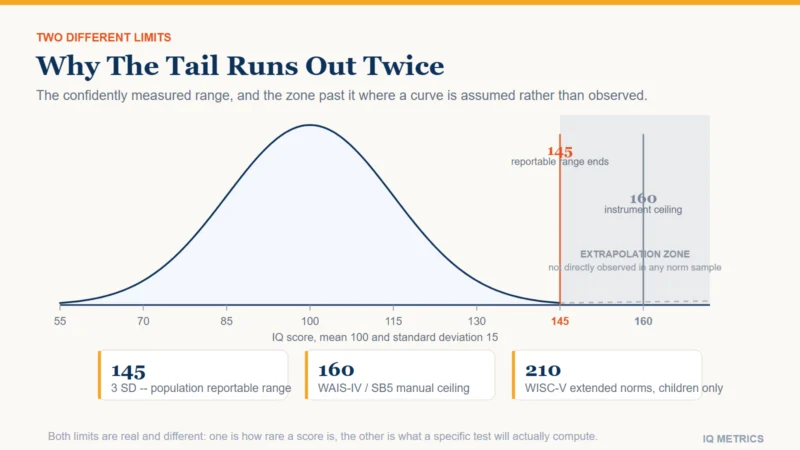
Every real test has a ceiling — the highest score its norming sample can support with any precision — and it sits far below the old headline numbers. How high a test can score you and the ceiling effect both cover this in depth; in practice, the Wechsler scales top out in the neighborhood of 155 to 160, and the Stanford-Binet 5 reports similarly. Past that point, too few people in any norming sample answer every question correctly to say with any confidence whether one exceptional scorer is more or less able than another.

That ceiling is a feature of honest measurement, not a limitation to work around. A test that claimed to distinguish a 190 from a 250 would be reporting false precision — certainty the underlying data cannot support — which is exactly the failure mode Guinness cited when it dropped the category. The same problem matters well outside trivia, too: cognitive tests used in hiring top out in a similar range, so a candidate’s raw score past the mid-140s tells an employer very little more than a score in the 130s would.

So who has the highest IQ in the world today?

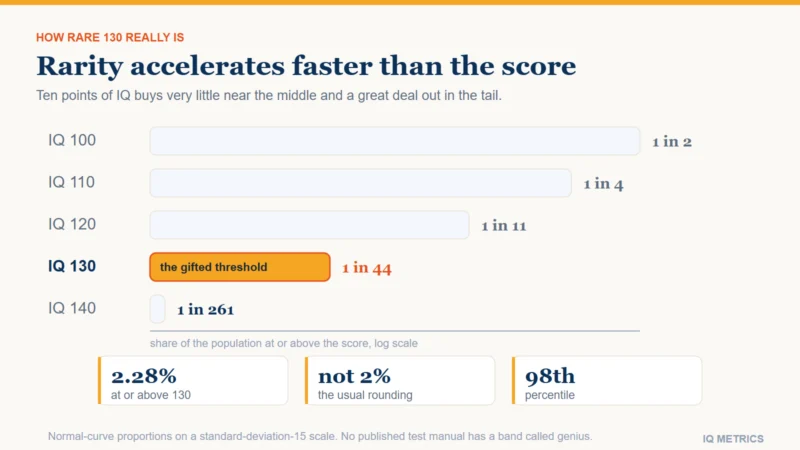
There is no defensible answer, and that is the honest one. High-IQ societies such as Mensa set admission around the 98th percentile, roughly 130 on a standard-deviation-15 scale — see Mensa’s admission requirements — while more selective societies reach further into the tail, and what genius IQ level means and whether 130 counts as genius both cover how that upper range gets classified. None of those societies claims to crown a single “highest” member, because past a certain point measurement error swamps any real difference between two exceptional scorers.

Any specific name attached to “world’s highest IQ” online today deserves the same scrutiny vos Savant’s and Sidis’s numbers get: ask what test produced it, who administered it, and whether the scale in question even reports a number that high. Most of the time, at least one of those answers is missing.

Other names that circulate in "highest IQ" lists

Christopher Langan and Kim Ung-Yong are two more names that turn up regularly in “smartest person alive” roundups, both linked to self-reported or informally administered scores rather than a documented, mainstream test result. That is not a comment on either person’s actual ability — Kim, for instance, had a well-documented career as a child prodigy and later became a civil engineering professor — it is the same pattern as vos Savant and Sidis: a headline number that predates, or sits outside, the kind of standardized, norm-referenced testing this site otherwise covers.

Share this article

Know someone who keeps seeing these numbers quoted without the scale they were measured on? Send it to them.

Tagged deviation iq, genius iq level, Guinness World Records, high iq societies, highest IQ, iq ceiling, iq classifications, iq percentile, IQ Science, IQ Score, Marilyn vos Savant, mensa, ratio iq, William James Sidis

High IQ and ADHD

Understanding IQ

High IQ and ADHD: What Twice-Exceptional Research Actually Shows

High IQ and ADHD can and do coexist, at close to the general-population rate. What twice-exceptional actually means, why the combination gets missed in both directions, and how ADHD can pull down a full-scale IQ score without touching real reasoning ability.

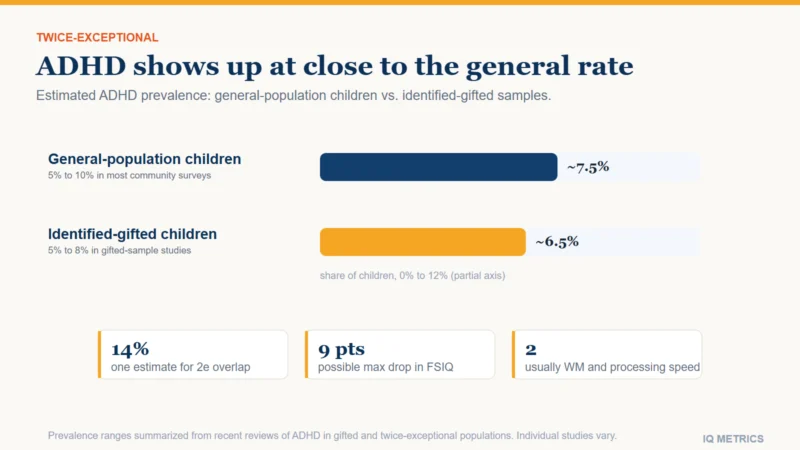
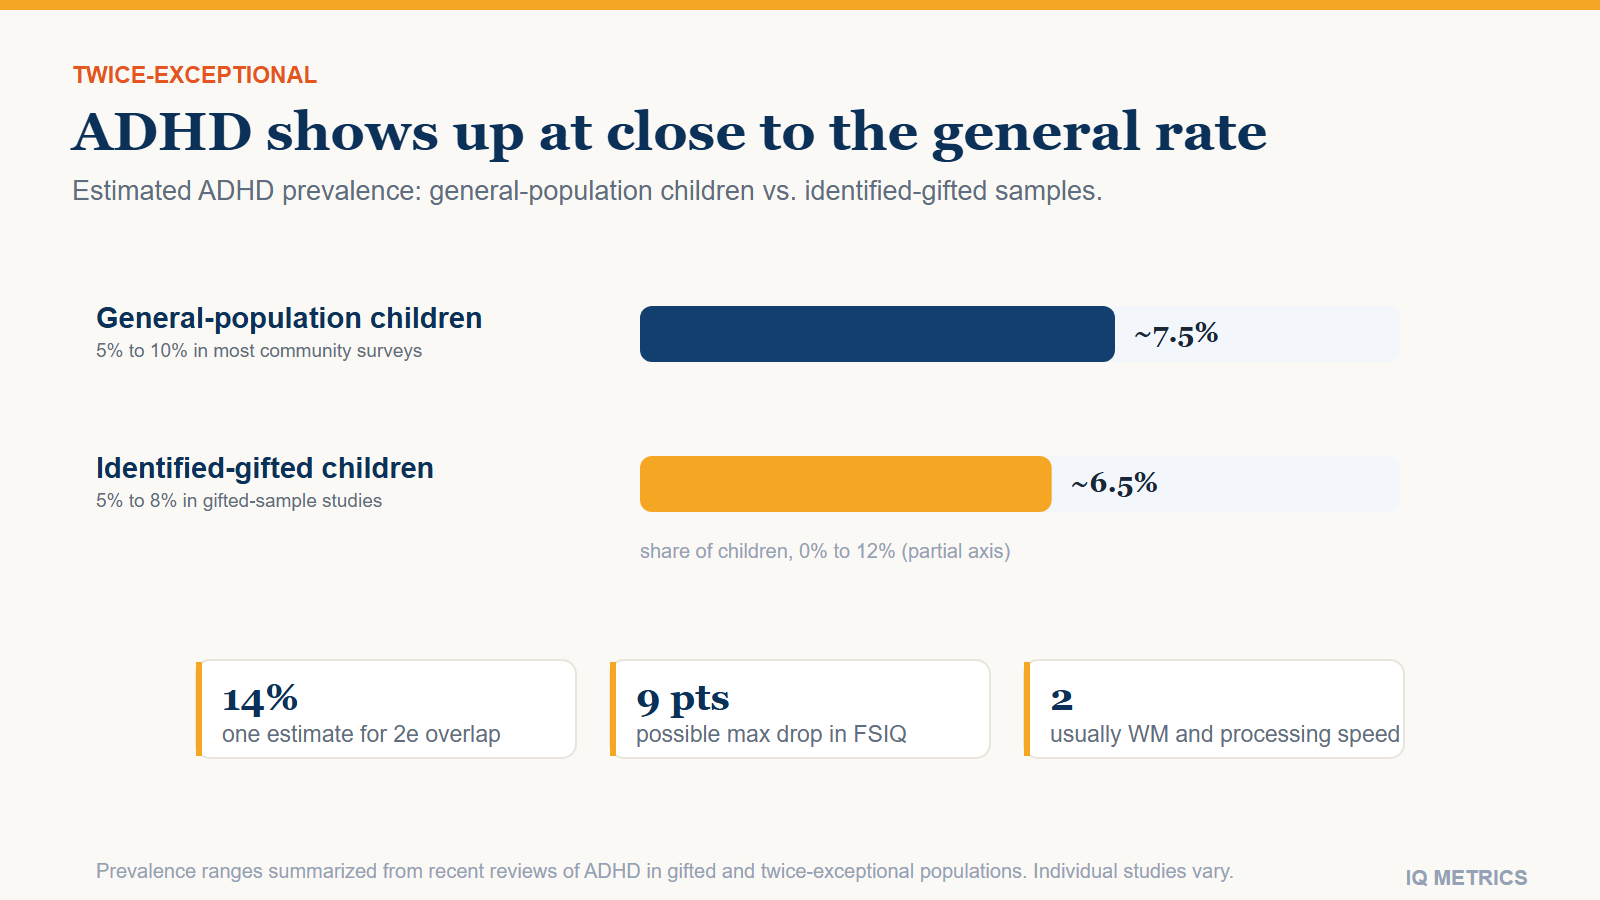
Bar chart comparing estimated ADHD prevalence in general-population children, about 7.5 percent, and identified-gifted children, about 6.5 percent, showing the two rates are close.

Yes. Having a high IQ does not prevent ADHD, and having ADHD does not cap how high an IQ score can go. Attention-deficit/hyperactivity disorder turns up in intellectually gifted people at close to the same rate it turns up everywhere else, and when the two coexist, clinicians call it twice-exceptional, or 2e for short.

That overlap is easy to miss in both directions. A child who reads early and talks like an adult does not look like the stereotype of ADHD, so the fidgeting and the unfinished worksheets get written off as boredom. An adult who was always “the smart one” rarely gets checked for ADHD at all. This article covers what twice-exceptional actually means, how common the overlap really is, why it is missed so often, and what ADHD can do to an IQ score itself.

What does twice-exceptional actually mean?

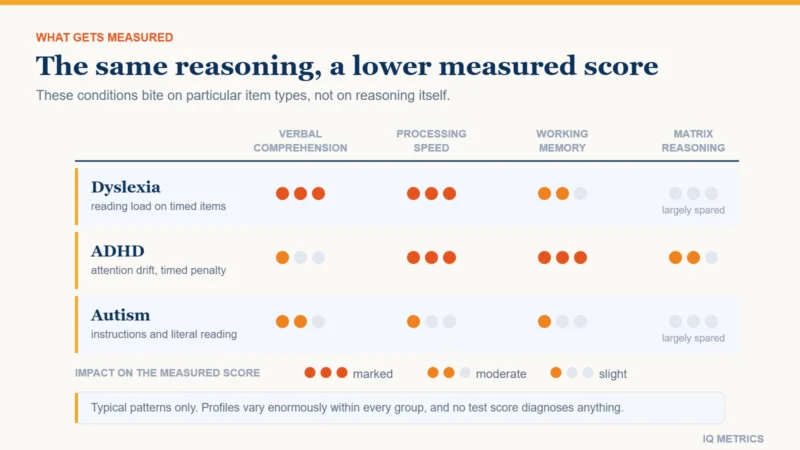
Twice-exceptional describes someone who qualifies as intellectually gifted and has one or more diagnosed neurodevelopmental conditions, most often ADHD, autism, or a specific learning disability such as dyslexia. How ADHD, autism and dyslexia affect IQ test scores covers the measurement side of that combination in detail; this piece focuses on the ADHD-and-giftedness pairing specifically, and on what it is like to live with, rather than how it is scored.

The term is not a diagnosis on its own, and it is not a trade-off. A student can be gifted and have ADHD without either label softening the other: the giftedness does not cancel out the attention difficulties, and the ADHD does not lower the ceiling on ability. The two run on largely independent tracks, which is exactly why the combination is so often missed — each trait can hide the other from a casual observer.

How common is ADHD among gifted people?

Community surveys generally put ADHD prevalence in children somewhere between 5% and 10%. Research specifically on identified-gifted samples finds a similar range, usually cited around 5% to 8% — in other words, no strong evidence that giftedness protects against ADHD, and no strong evidence that it predisposes to it either. One recent estimate puts the theoretical rate of any twice-exceptional overlap, across every neurodevelopmental condition that can co-occur with giftedness, at around 14% of gifted children.

Bar chart comparing estimated ADHD prevalence in general-population children, about 7.5 percent, and identified-gifted children, about 6.5 percent, showing the two rates are close.

Those numbers carry real uncertainty. Studies define “gifted” differently — some use a single IQ cutoff, others use school identification records that lean toward children whose difficulties never got noticed — and ADHD diagnosis itself depends on who is doing the rating and in what setting. Reviewers describe identifying twice-exceptional students as a genuinely complex process for exactly this reason: giftedness can produce behavior, like restlessness under low-challenge instruction or intense focus on one narrow interest, that overlaps with an ADHD checklist without being ADHD at all.

Why gifted ADHD is so often missed

Two things work against each other here. A gifted child can compensate for attention and organizational weaknesses using raw processing power and vocabulary, scoring well enough on schoolwork that no one looks closer. And an adult who was praised for intelligence throughout childhood rarely gets referred for an ADHD evaluation, because “smart” and “has ADHD” still read as a contradiction to a lot of teachers, parents, and even clinicians.

The result is a child who is seen either as gifted with a discipline problem, or as having ADHD with test scores that “must mean it is not that bad.” Both framings miss the twice-exceptional profile underneath. Girls face this compounding twice over: ADHD in girls is already under-recognized because it presents more often as inattention than the hyperactivity that gets a boy referred, and a gifted girl’s compensating strategies can mask it for years longer.

Can ADHD actually lower an IQ score?

Sometimes, yes — not because ADHD reduces reasoning ability, but because a full-scale IQ score blends several subtests, and two of them, working memory and processing speed, are exactly the areas ADHD most reliably affects. Processing speed and IQ explains why that particular subtest carries less weight as a marker of “true” ability than people assume.

When a twice-exceptional profile pulls down working memory and processing speed while verbal reasoning and perceptual reasoning stay high, the four index scores disagree with each other, and the single full-scale number ends up lower than either of the strong subtests alone would suggest. Research on these mixed profiles has found the gap can run to roughly nine points off the full-scale score compared with what the strongest subtests alone would predict — enough, in some cases, to move a child from qualifying for a gifted program to not qualifying, on a test that was never measuring the thing being screened for.

Your own number

Where would your own score land?

Take the IIF-certified assessment and get your score with the scale it was measured on, the percentile it corresponds to and the confidence range around it — the three figures most online tests leave out.

Find your IQ score now! →

Secure & encryptedInstant results10–20 minutes

What twice-exceptional looks like day to day

The profile rarely looks like a textbook case of either trait alone. A twice-exceptional student might finish a 400-page novel in a weekend for fun, then lose the permission slip for a field trip three days running. An adult might land a technically brilliant solution to a hard problem at work in ten minutes, then miss the meeting where it was due because the invite got buried in an inbox with thousands of unread messages. Neither example is a contradiction: the reasoning system and the executive-function system that plans, organizes and tracks time genuinely are separate, and giftedness gives the first system nothing to lend the second.

  • Big-picture insight that outruns follow-through: a strong grasp of a whole project, paired with real difficulty sequencing the steps to finish it.
  • Intense, narrow interests that look like exceptional focus, alongside real trouble sustaining attention on anything outside them.
  • Perfectionism that masks avoidance: a task gets endlessly refined, or never started, because starting risks an imperfect result.
  • Emotional intensity that gets mistaken for giftedness alone or ADHD alone, when the two are actually compounding each other.

Getting evaluated without over-simplifying either label

  • Ask for a full battery, not a single IQ number. A profile that reports subtest and index scores separately, not just the composite, is what actually shows a twice-exceptional pattern.
  • Rule out anxiety and boredom first. Both an under-challenged gifted student and an anxious test-taker can produce ADHD-shaped symptoms without having ADHD.
  • Expect the picture to look uneven, not uniformly behind. A twice-exceptional child is often ahead on some measures and behind on others in the same session.
  • Treat the ADHD component on its own terms. Executive-function support and, where appropriate, medication address ADHD directly; neither is a giftedness problem to be managed away.

The self-diagnosis wave, and where to be careful

Adult ADHD awareness has grown fast over the past few years, partly through social media, and plenty of people who always felt “too smart to have ADHD” are now recognizing the pattern in themselves. That recognition can be a useful first step toward an evaluation, but a video or a checklist is not a diagnosis: a real assessment rules out other explanations — sleep debt, anxiety, depression, an unmanageable workload — that can mimic several ADHD symptoms without being ADHD.

It is also worth separating high IQ and ADHD from a much broader claim people sometimes make, that ADHD-style impulsivity is simply the price of a fast-moving mind. IQ and crime looks at a related version of the same executive-function research from a very different angle — how weak impulse control, independent of intelligence, connects to real-world outcomes — and the short version is the same one: intelligence and self-control are separate systems, and neither substitutes for the other.

The bottom line

A high IQ score and an ADHD diagnosis are not in tension. They measure different things — one a snapshot of reasoning ability across several domains, the other a pattern of attention and self-regulation — and a person can score well on the first while genuinely struggling with the second. Twice-exceptional identification exists precisely because neither label, used alone, describes what is actually going on.

Share this article

Know someone who keeps seeing these numbers quoted without the scale they were measured on? Send it to them.

Tagged ADHD, adult ADHD, child development, cognitive development, diagnosis and assessment, executive function, gifted children, giftedness, IQ Science, neurodivergent, Processing Speed, Test Accommodations, twice exceptional, Working Memory