IQ Metrics
IIF Certified Assessment Start IQ Test
IIF Certified Assessment

IQ Test Questions for Kids

Taking a Test

IQ Test Questions for Kids: Sample Questions by Age, With Answers

Original IQ test questions for kids with answers, by age: sample items for 4-7, 8-12 and 13-17, a matrix puzzle worked through, how a child’s score is set, how stable it is, and what practice really does.

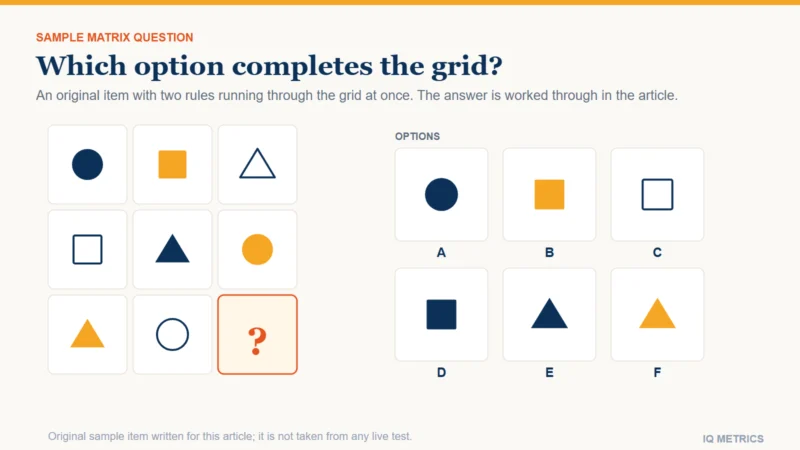
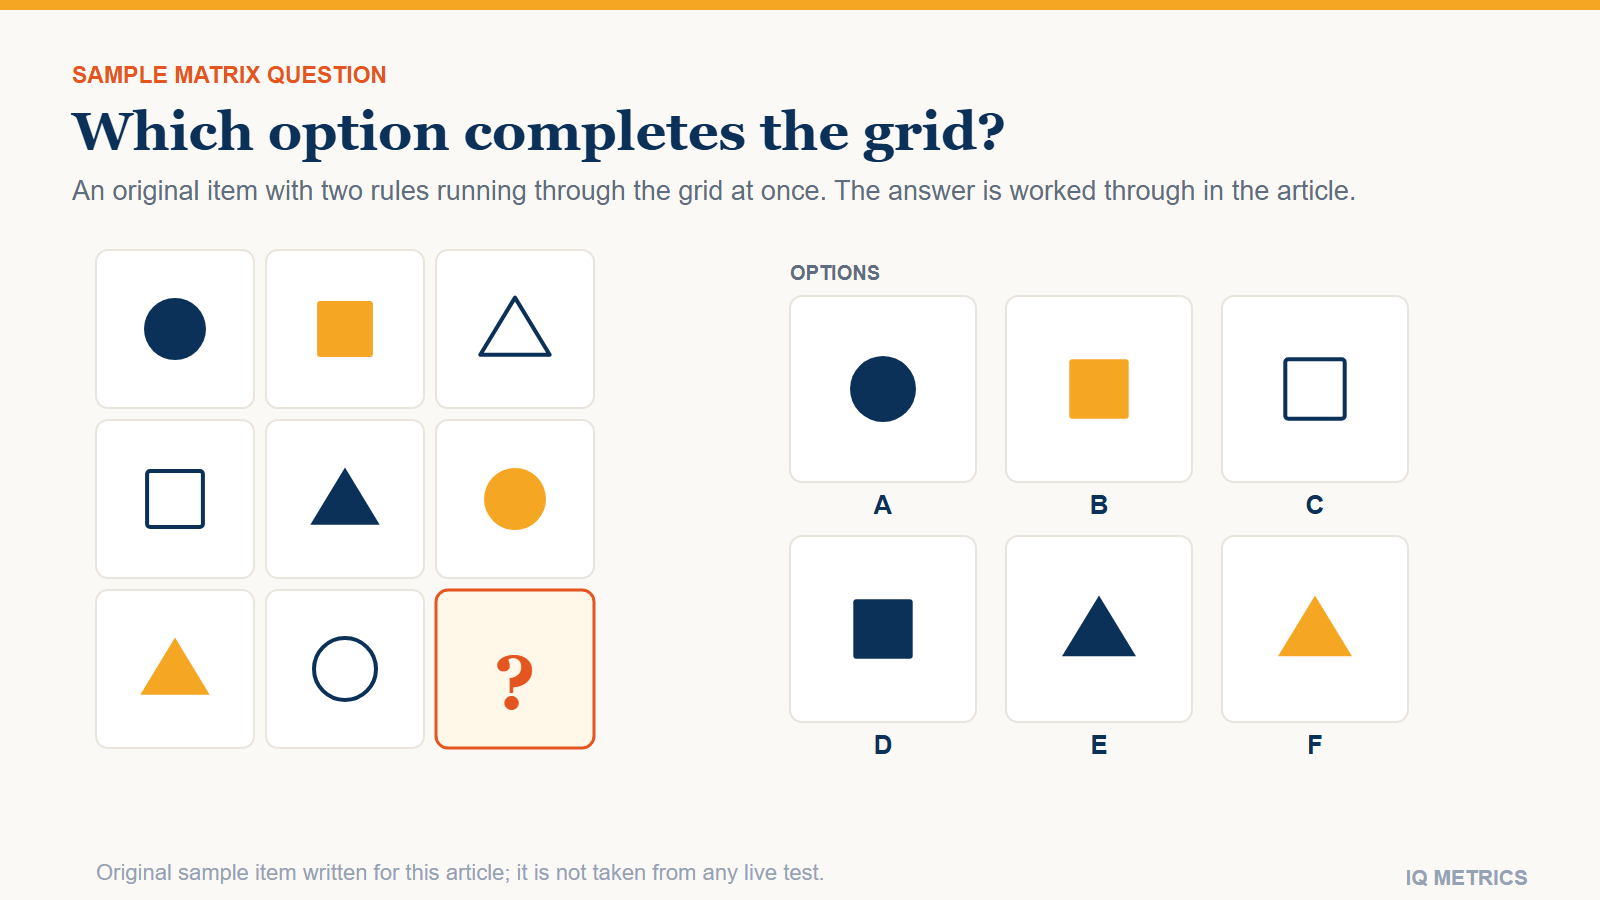
A three-by-three grid of circles, squares and triangles in navy, gold and outline with the bottom-right cell missing, and six answer options labelled A to F: an original sample matrix question.

Children’s IQ tests ask puzzle-style questions, not school questions: finish a pattern, find the odd one out, continue a number series, say how two things are alike, work out who is tallest from two clues. The wording changes with age, but the reasoning skills underneath are the same at every age. Below are 15 original sample questions with answers for ages 4 to 7, 8 to 12 and 13 to 17, one matrix puzzle worked through step by step, how a child’s answers become a score, how stable that score is, and what the research says about practising.

  • What is asked: patterns and matrices, odd-one-out, analogies, number series, logic and spatial puzzles. The one-to-one tests add vocabulary, similarities and memory tasks.
  • How it is scored: a child’s raw score is converted to a standard score by comparison with children of the same age, so the same answers can mean different scores at 8 and at 12.
  • How stable it is: scores taken before about age 6 are a rough guide. A 2024 meta-analysis of 205 studies found that tests taken at 11 or later predicted scores at 16 with correlations above 0.80, while tests taken at 7 or younger did not reach 0.70.
  • Practice: repeating the same kind of test adds a few points, so keep practice light and different from the real thing.

Every example here was written for this article. Real test items are secure and copyrighted, and we do not publish questions from our own tests either, because a published answer stops measuring anything.

What kinds of questions are on a children’s IQ test?

Six families of question turn up across the main children’s tests. Each is built to measure one reasoning skill, and each has a deeper guide on this site.

Question types and what they measure
Question type What it is designed to measure Guide
Matrices and pattern completion Fluid reasoning: working out the rule that completes a grid or sequence Matrix puzzles
Odd one out and classification Concept formation: seeing what things have in common Odd-one-out questions
Analogies and word relationships Verbal reasoning: understanding how ideas relate Analogy questions
Number series and quantitative puzzles Quantitative reasoning: finding the rule behind numbers Number series
Logic and deduction Deductive reasoning: combining facts to reach a conclusion Syllogism questions
Spatial puzzles Visual-spatial reasoning: rotating and folding shapes in the mind Paper folding and rotation

The one-to-one tests add a few more. The WISC-V, for ages 6 to 16, has ten primary subtests: Similarities, Vocabulary, Block Design, Visual Puzzles, Matrix Reasoning, Figure Weights, Digit Span, Picture Span, Coding and Symbol Search, and seven of them feed the full-scale IQ. Our own kids IQ tests group their puzzles into five areas: pattern recognition, abstract reasoning, analytical thinking, visual perception and spatial orientation. The wider adult picture is in what types of questions an IQ test asks.

Sample IQ test questions for ages 4 to 7

At this age questions are read aloud or shown as pictures, and the child answers by speaking or pointing. Nothing needs reading or writing. The examples are described in words here; on a real test the pattern and odd-one-out items would be pictures.

Ages 4 to 7: five sample questions
Question Answer What it measures
Red square, blue square, red square, blue square, red square. What comes next? A blue square Pattern recognition: spotting a repeating sequence
Apple, banana, carrot, pear. Which one does not belong? The carrot (the others are fruit) Classification: seeing what things have in common
A bird flies. A fish …? Swims Verbal reasoning: matching a relationship
Ben has 3 stickers and gets 2 more. How many does he have now? 5 Early quantitative reasoning
Say these numbers backwards: 3 … 8. 8 … 3 Working memory (a digit-span task, used on the WISC-V from age 6)

What separates a four-year-old’s answers from a seven-year-old’s is rarely the type of question. It is how many steps the child can hold in mind at once. That is why individual tests start with easy items and move to harder ones, and why the same skills are still being measured a decade later.

Sample IQ test questions for ages 8 to 12

From around grade 3, group tests such as the CogAT use printed questions that the child reads alone, while the WISC-V stays one-to-one with a psychologist. The items now carry more steps and less picture support.

Ages 8 to 12: five sample questions
Question Answer What it measures
3, 6, 5, 10, 9, 18, … What number comes next? 17 (double, subtract one, then repeat) Quantitative and pattern reasoning: finding the rule in a series
Glove is to hand as sock is to …? Foot Verbal reasoning: the relationship inside an analogy
Square, triangle, rectangle, cube. Which one does not belong? The cube (the others are flat shapes) Classification
Mia is taller than Noah. Noah is taller than Omar. Who is the shortest? Omar Deductive reasoning: combining two facts
A cyclist rides 12 km in 40 minutes at a steady speed. How far does the cyclist ride in 90 minutes? 27 km (0.3 km a minute) Quantitative reasoning: proportional thinking

The matrix below is the format most people picture when they picture an IQ test: a grid with one cell missing and a row of options underneath. Try it before reading on. Saying the rule out loud is the method that works, as this guide to matrix puzzles explains.

A three-by-three grid of circles, squares and triangles in navy, gold and outline with the bottom-right cell missing, and six answer options labelled A to F: an original sample matrix question.

The answer is D, the navy square. Two rules run through the grid at once: every row and every column contains each of the three shapes once, and each of the three fills (navy, gold, outline) once. The bottom row already has a gold triangle and an outline circle, so its missing shape must be the square, and since gold and outline are used, its missing fill must be navy. The third column, with an outline triangle and a gold circle, gives the same answer. Each wrong option breaks a rule: A and E repeat a shape already in the row, B and C repeat a fill, and F repeats both. A matrix with this structure sits at the harder end of what children meet, and the Raven’s Progressive Matrices use the same pattern-completion format.

Sample IQ test questions for ages 13 to 17

Teen items measure the same skills with more steps. Word relationships become more abstract, number rules combine operations, and logic items carry more conditions.

Ages 13 to 17: five sample questions
Question Answer What it measures
2, 3, 5, 9, 17, … What comes next? 33 (the gap doubles each time: 1, 2, 4, 8, 16) Quantitative reasoning: a growth rule rather than a fixed step
Drizzle is to downpour as whisper is to …? Shout Verbal reasoning: an analogy about degree
In what way are a poem and a symphony alike? Both are creative compositions. Naming the shared category earns more credit than naming a detail such as “both have parts” Verbal concept formation, as in Wechsler-style similarities questions
Priya finishes a race before Sam but after Tariq. Uma finishes last. Who came second? Priya (the order is Tariq, Priya, Sam, Uma) Deductive reasoning: ordering from several clues
A game is 20% off and now costs 36 dollars. What did it cost before the sale? 45 dollars (36 is 80% of the original price) Quantitative reasoning: working backwards from a percentage

Notice that the same skill appears at two levels. Mia, Noah and Omar at ages 8 to 12 and the race puzzle at 13 to 17 both test combining clues; what changes is the number of steps and how abstract the language is. Researchers use the same idea across species: a 2012 study gave children aged 4 to 10 the same water-displacement puzzles that had been given to rooks and crows, as crow IQ describes.

How does a child’s answer become an IQ score?

On the one-to-one tests, a psychologist adds up the points earned on each subtest, converts each raw score to a scaled score by comparing it with children of the same age, and combines the scaled scores into a composite. The WISC-V was normed on 2,200 children in 11 age groups and reports scores on a scale with a mean of 100 and a standard deviation of 15. The WPPSI-IV covers ages 2 years 6 months to 7 years 7 months and was normed on 1,700 children in nine age groups. Because the comparison is with same-age children, the same raw score is worth less at 12 than at 8. IQ scale by age explains how that works, and deviation IQ versus ratio IQ covers the older mental-age formula.

Group screening tests report something slightly different. The CogAT gives a Standard Age Score with a mean of 100 and a standard deviation of 16, plus percentiles and stanines, and its publisher is explicit that the CogAT is not an IQ test. A child’s 99th percentile is what carries over between tests, which is the point what an IQ of 135 means makes about the top 1%.

Children’s tests at a glance
Test Ages Format What a child does
WPPSI-IV 2 years 6 months to 7 years 7 months One-to-one with a psychologist, 30 to 60 minutes From age 4: information, similarities, block design, matrix reasoning, picture memory and bug search
WISC-V 6 years to 16 years 11 months One-to-one, about 60 minutes for the core subtests Ten primary subtests from vocabulary to symbol search
Stanford-Binet 5 2 to 85 and over One-to-one Ten subtests covering fluid reasoning, knowledge, quantitative reasoning, visual-spatial processing and working memory, verbal and nonverbal
Raven’s Coloured Progressive Matrices 5 to 11 Untimed, individual or group 36 pattern-completion items
CogAT Kindergarten to grade 12 Group, paper or screen Verbal, quantitative and nonverbal batteries
NNAT3 Kindergarten to grade 12 Group, 48 items, about 30 minutes One nonverbal matrix format: find the missing piece

The individual tests are restricted to qualified professionals, so parents cannot buy them, and any quiz advertised as a real IQ test “with answers” is unstandardised practice. WISC-V index scores explained and CogAT and NNAT scores explained cover how to read each report, and IQ testing for children covers the instruments and norms in more depth.

How stable is a child’s IQ score?

Less stable than most people assume, and it depends on age. A 2024 meta-analysis in Psychological Bulletin by Breit and colleagues pooled 205 longitudinal studies and 87,408 people. Stability was low in preschoolers and rose steeply through childhood, reaching a correlation of about 0.76 at age 20 over five years. If 0.80 is the bar for decisions about an individual, general intelligence does not reach it before about age 6; at age 8 that level of stability lasts about two years, at 12 about four, and in adults about six. Tests taken at 11 or later predicted scores at 16 with correlations above 0.80, tests at 8 to 10 above 0.70, and tests at 7 or younger did not reach 0.70.

In plain terms: with a stability of 0.70, a child who scores 130 is expected to score about 121 next time, before any practice effect, purely because extreme scores drift toward the average (regression to the mean). Those are group statistics, and individual children can change a lot in either direction. The publishers say the same thing: the NNAT3 is not intended for children under 5, CogAT age norms begin at 4 years 11 months, and the National Association for Gifted Children cautions that scores under age 6 are hard to interpret. What age is most accurate for an IQ test and the margin of error explained give the wider picture.

Your own number

Where would your own score land?

Take the IIF-certified assessment and get your score with the scale it was measured on, the percentile it corresponds to and the confidence range around it — the three figures most online tests leave out.

Find your IQ score now! →

Secure & encryptedInstant results10–20 minutes

Should you practise IQ questions with your child?

A little familiarity helps; drilling adds little. The best evidence comes from adults. Scharfen, Peters and Holling’s 2018 meta-analysis of 122 studies and 153,185 people found a gain of about a third of a standard deviation, roughly 5 IQ points, on the second sitting of the same kind of test, half a standard deviation by the third and no further gain by the fourth. Identical forms gave bigger gains than parallel forms. The samples averaged 12 to 70 years old, so it says little about young children, and coaching studies were excluded. In children, Pearson’s NNAT3 retest study (524 children, kindergarten to grade 4, retested after about 18 days) found a gain of 3.8 points. A few points, mostly from familiarity, matter only near a cut-off. What practice actually changes and how to prepare for an IQ test go further.

  • Keep it playful. Puzzles, pattern games, riddles and number games build the same reasoning without a test atmosphere.
  • Do not drill real test items. Some selective schools say preparation can count against an applicant; Hunter College Elementary’s admissions page warns that prepared children may be disqualified.
  • Leave time before a retest. The CogAT publisher’s guidance is at least three months, six preferred, or switching to a different form.
  • Practise the format, not the answers. Familiarity with how a matrix or analogy is laid out is what practice really buys.

What do schools do with the scores?

Programmes differ, and there is no universal cut-off. At the time of writing, Chandler Unified School District in Arizona asks for the 97th percentile on any one CogAT battery or the 95th on the composite, and offers a retest after six months. The Rockwood district in Missouri asks for the 95th percentile on two of three composites plus achievement and nonverbal-reasoning criteria. At the selective end, the Davidson Young Scholars programme asks for an individual IQ score of 145 or higher for ages 5 to 16. The National Association for Gifted Children advises against relying on any single assessment. Gifted cutoff scores explains why one line misses children it should find, and signs of a gifted child covers what giftedness looks like at home.

Are online IQ tests for kids accurate?

They are a different thing from the tests above. Real children’s tests are restricted to qualified users and given under standard conditions. The International Test Commission’s guidelines say that the meaning of a score assumes a proctored, standardised setting, and an unsupervised online test cannot verify who is answering. An online puzzle set can still be a low-stakes way for a child to meet the question types. Our own age-banded sets are 15 picture puzzles for ages 4 to 7, 25 puzzles for ages 8 to 12 and 30 puzzles for ages 13 to 17. They are not a clinical assessment, and for a decision about school placement the right route is a school psychologist.

Quick answers

What is on a 5-year-old’s IQ test?

On the one-to-one WPPSI-IV, information and similarities questions, block designs, matrix puzzles, picture memory and a bug-search task. Group screening tests for this age use picture puzzles.

Can a 5-year-old take an IQ test?

Yes. The WPPSI-IV starts at 2 years 6 months. But scores before about age 6 are a rough guide, so most gifted programmes weigh them cautiously.

What tests do 10- and 12-year-olds take?

The WISC-V one-to-one, or group tests such as the CogAT, NNAT3 and OLSAT at school.

Is there a real IQ test for kids with answers?

Not for the public. The real tests are restricted to qualified professionals, so any “with answers” version is unstandardised practice.

What IQ score is gifted for a child?

There is no single rule. Many districts use the 95th to 97th percentile on a group test, while some selective programmes ask for 145 or higher.

Do practice questions raise a child’s IQ?

They raise familiarity, and repeat scores by a few points. They do not change underlying ability.

The bottom line

A children’s IQ test is a set of reasoning puzzles whose difficulty rises with age and whose score is a rank among same-age children. Use sample questions to learn the format, not to drill, treat a score before about age 6 as a rough guide, and never as a label. For what a very high rank looks like, see what an IQ of 135 means.

Sources

Share this article

Know someone who keeps seeing these numbers quoted without the scale they were measured on? Send it to them.

Tagged child iq, child iq testing, CogAT, fluid reasoning, gifted children, gifted identification, IQ Science, IQ Score, iq testing for children, kids iq test, NNAT, Practice Effect, Raven matrices, sample questions, WISC-V

What an IQ of 135 Means

Scores & Scales

What Does an IQ of 135 Mean? The Top 1% Explained

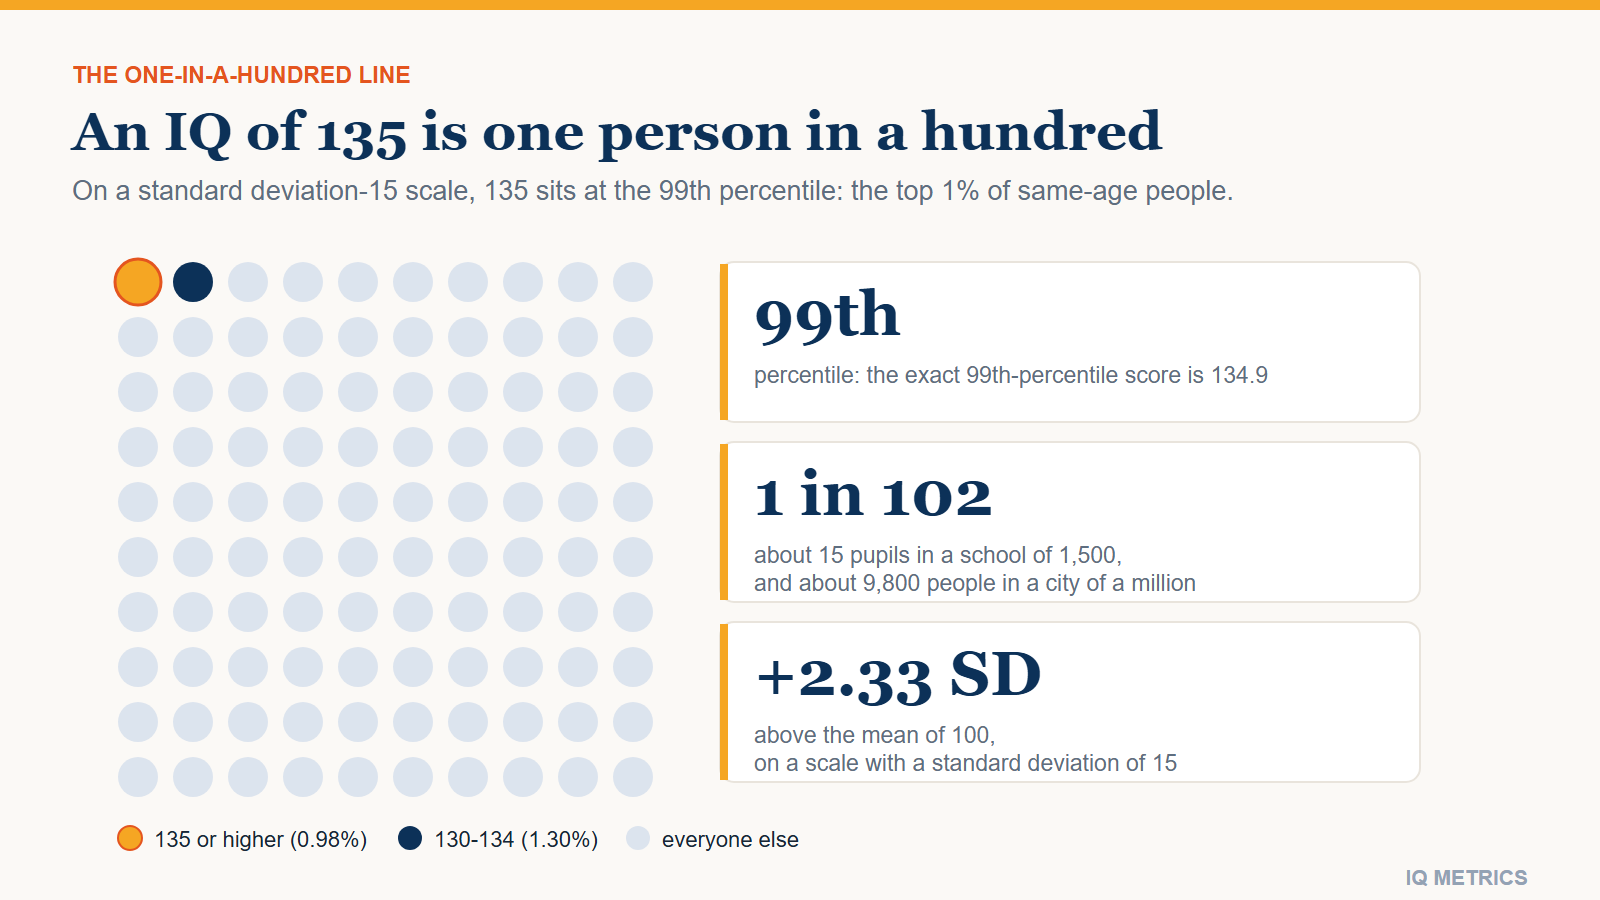
An IQ of 135 is the 99th percentile: one person in 102 on the Wechsler scale, but only 1 in 14 on the Cattell scale. Rarity of every score from 130 to 139, the cut-off Terman really used, how precise a 135 is, and what it predicts.

A grid of 100 dots showing one gold dot for the person in a hundred who scores 135 or higher, one navy dot for the 130 to 134 band and 98 grey dots, beside the figures 99th percentile and 1 in 102.

An IQ of 135 is the 99th percentile on the standard deviation-15 scale used by the Wechsler tests and the Stanford-Binet 5. About one person in 100 scores this high or higher (more exactly, 1 in 102), which makes it the top 1% of same-age people. It clears the 98th-percentile line that Mensa uses, sits at the entry point for societies that ask for the top 1%, and falls inside the 130-and-above band that the major test manuals label as very high. It is not a “genius” score on any current test, and the same number means something different on a scale with a different spread.

  • Rarity: 99.02nd percentile, 2.33 standard deviations above the mean, 1 in 102. That is about 15 pupils in a school of 1,500 and about 9,800 people in a city of a million.
  • Other scales: the same 135 is the 98.6th percentile on a standard deviation-16 scale (1 in 70) and only the 92.8th on the Cattell scale (1 in 14). The person at the 99th percentile scores 134.9, 137.2 and 155.8 on the three.
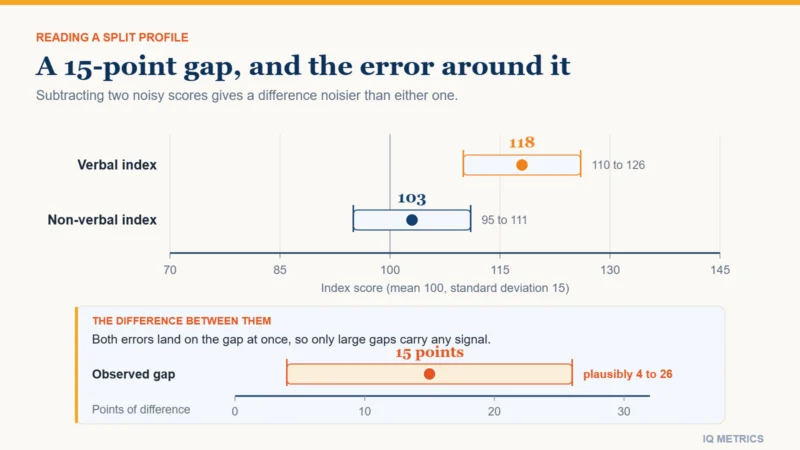
  • Precision: on the current Wechsler tests an observed 135 is best read as a true score of roughly 128 to 139.
  • What it predicts: better average outcomes in education and work, weaker links to wealth, and no sign that the benefit stops at the top.

This article covers the rarity of every score from 130 to 139, where 135 turns up as a line (Terman’s study, high-IQ societies, the test manuals), how precise a 135 is on three current tests using the publishers’ own reliability figures, what it predicts in studies that other pages on this site do not cover, and how to read a 135 from an old test or an online quiz. The neighbouring scores have their own pages: is 130 IQ a genius score? and what an IQ of 140 means.

How rare is an IQ of 135?

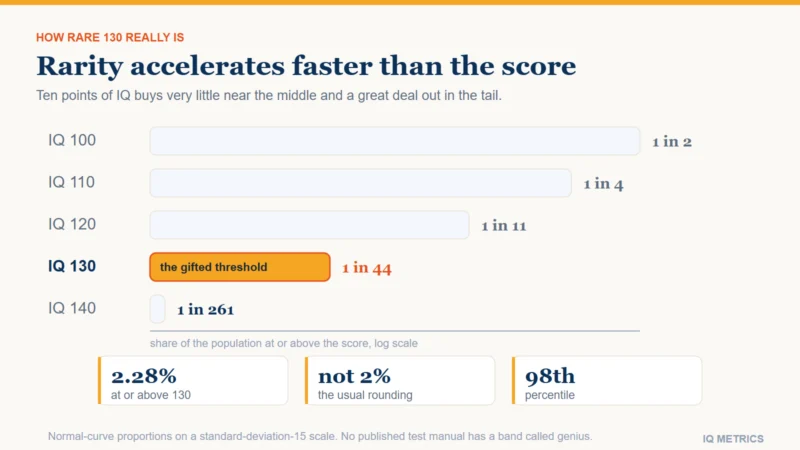
On a normal curve with a mean of 100 and a standard deviation of 15, an IQ of 135 sits 35 points, or 2.33 standard deviations, above the middle. That leaves 0.98% of people at or above it: 1 in 102. Scaled up, that is about 15 pupils in a school of 1,500, around 9,800 people in a city of a million, roughly 980,000 in a country of 100 million and about 80 million people worldwide. The 130s are not a flat band. Each point removes a larger share of the people still left above it, so a 139 is more than twice as rare as a 135.

130 to 139 on a standard deviation 15 scale
IQ Percentile People at or above
130 97.72nd 1 in 44
131 98.06th 1 in 52
132 98.36th 1 in 61
133 98.61st 1 in 72
134 98.83rd 1 in 85
135 99.02nd 1 in 102
136 99.18th 1 in 122
137 99.32nd 1 in 147
138 99.44th 1 in 177
139 99.53rd 1 in 215
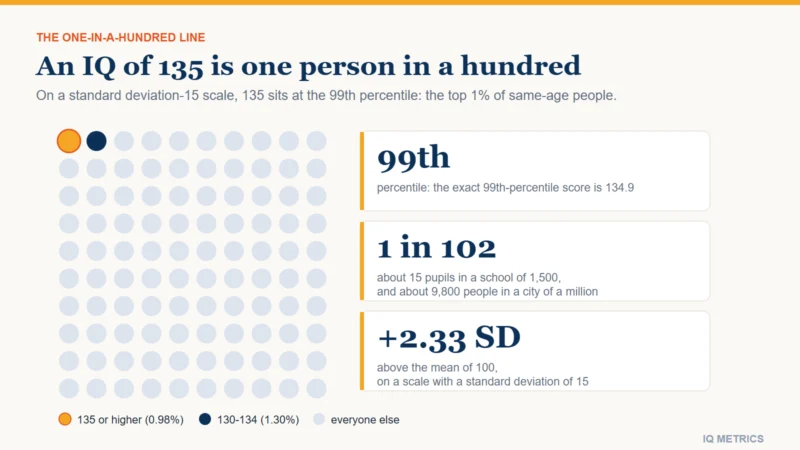
A grid of 100 dots showing one gold dot for the person in a hundred who scores 135 or higher, one navy dot for the 130 to 134 band and 98 grey dots, beside the figures 99th percentile and 1 in 102.

The table picks up where is a 120 IQ high? leaves off and hands over to the 140s table in what an IQ of 140 means. How rare a high IQ score is compares the rarity at every threshold, and the IQ percentile calculator places any score on the same curve.

Is 135 the same on every scale?

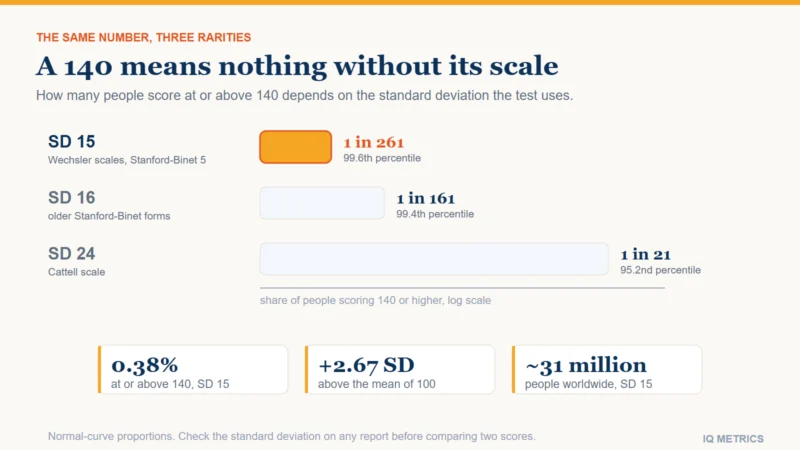
No. A score belongs to a scale, and the scale is set by the standard deviation the test uses. Most modern clinical tests use 15. Older Stanford-Binet forms and the CogAT use 16, and the Cattell scale uses 24.

The same 135 on three scales
Scale Percentile of a 135 Rarity Score at the 99th percentile
SD 15 (Wechsler, Stanford-Binet 5) 99.0th 1 in 102 134.9
SD 16 (older Stanford-Binet forms, CogAT) 98.6th 1 in 70 137.2
SD 24 (Cattell) 92.8th 1 in 14 155.8

So a 135 on a Cattell-type scale is a good result and not a rare one, and a person who really is in the top 1% would report about 156 on it. Mensa’s own entry table shows the same effect from the other side: its qualifying scores are 130 on the Wechsler tests but 148 on the Cattell scale. The IQ score converter moves a score between scales, and standard deviation 15 versus 16 explains where the two common scales come from.

Where does 135 show up as a line?

The best-known 135 is historical. Lewis Terman’s Genetic Studies of Genius, begun in California in 1921, screened an estimated 168,000 schoolchildren through teacher nominations and successive tests, and followed 1,528 of them by 1928. Terman’s working lower limit was an IQ of about 140 on the 1916 Stanford-Binet for children under 11, relaxed for older children, with 135 accepted for siblings and special cases; most later accounts simply say 135 or above. Those were ratio IQs, mental age divided by chronological age, so the same number was not equally rare at every age (see deviation IQ versus ratio IQ). The group averaged about 150 on that scale, and it grew up less religious than the general public, a finding covered in IQ and religion.

The footnote everyone remembers is that two boys who were tested but missed the cut, William Shockley and Luis Alvarez, went on to win the Nobel Prize in Physics, while none of the selected children did. It is usually read as a failure of IQ testing. A 2020 simulation by Russell Warne and colleagues in Intelligence, which modelled the tests’ reliability and how rare a Nobel Prize is, found that Terman was unlikely to have selected either man: the chance of missing both was between about 53% and 83%, depending on the assumptions, mostly because the prize is so rare and the minimum IQ so high. Shockley’s childhood scores are reported second-hand as 129 and then 125. A cut-off can find high ability without being able to predict very rare outcomes.

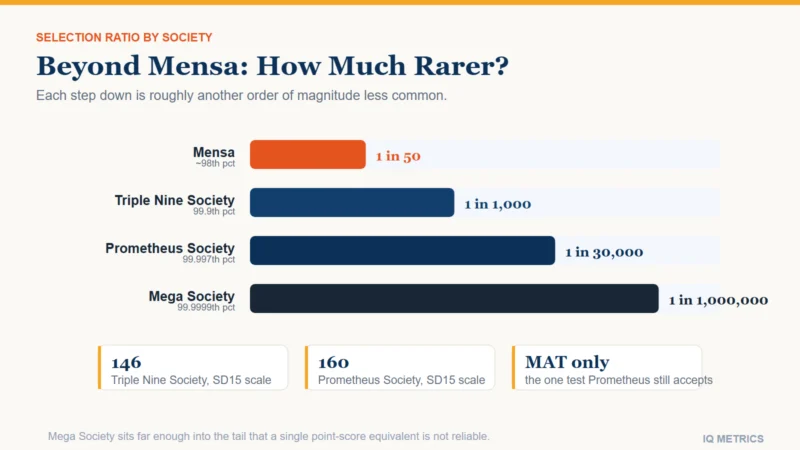
Other lines sit near 135 too. High-IQ societies set their rules as percentiles, which is why the qualifying number changes from test to test (high-IQ societies explained covers what each accepts as evidence):

Does a 135 qualify?
Society Line A 135?
Mensa 98th percentile: 130 on the Wechsler tests and Stanford-Binet 5, 148 on the Cattell Yes, on an approved supervised test; unsupervised online scores are not accepted
Intertel 99th percentile, about 135 At the line
International Society for Philosophical Enquiry 99.9th percentile No
Triple Nine Society three standard deviations above the mean: 146 on the WAIS and Stanford-Binet 5 No
Prometheus Society roughly the top one in 30,000 No

The test manuals themselves have no separate label for 135. The WAIS-IV calls 130 and above “Very Superior”, the WISC-V calls it “Extremely High”, and the Stanford-Binet 5 places the 130s in a gifted or very advanced band. None of them uses the word genius.

Who has a documented 135?

Very few public figures have a score anyone can trace. One is the chess champion Garry Kasparov: our Garry Kasparov profile records a test battery commissioned by Der Spiegel in Hamburg in the late 1980s that returned an overall 135, with the memory subtests at the top of the scale, and notes that the 190 attached to his name has no source. That is the pattern to expect: a documented score is usually far more modest than the number that circulates. Celebrity IQ numbers: where they come from explains how the circulating figures get made.

How precise is a 135 on the current Wechsler tests?

Less precise than it looks, and the publishers’ own figures show by how much. Every IQ carries a standard error of measurement, and for a high score the true value is expected to sit slightly closer to 100 than the observed one. Using each test’s reported reliability, an observed full-scale score of 135 works out like this:

What a 135 means on three Wechsler tests
Test Full-scale reliability Standard error Likely true score for an observed 135 Same-test retest
WAIS-IV .97 to .98 about 2.1 about 130 to 138 about +4 to +5 points
WAIS-5 .97 average 3.0 about 129 to 139 +2 to +4 points
WISC-V .96 2.9 average about 128 to 139 retest correlation .91 over 26 days

The ranges use the standard estimated-true-score method: the observed score is pulled toward 100 by the reliability, then widened by 1.96 standard errors. The WAIS-IV standard error is the value implied by its reliability. Two effects pull in opposite directions on a retest. Regression to the mean means a 135 is expected to come back at about 132 to 134 (regression to the mean explains why). Practice pushes the other way: the meta-analysis of retest effects by Scharfen, Peters and Holling found a gain of about a third of a standard deviation, roughly 5 IQ points, on the second sitting of the same kind of test, and on the Wechsler tests themselves the reported gains were about 2 to 5 points (what practice actually changes).

Three further limits apply near 135. First, the tail of the norm sample is thin: on a normal curve only about 22 of the 2,200 children in the WISC-V norm sample would score 135 or higher. Second, the scale has room, because full-scale scores on the WAIS-IV and WISC-V run from 40 to 160 and 135 is nowhere near the ceiling, although online tests often cap lower: Mensa Norway’s own online test reports scores from 85 to 145 and says it is no substitute for professional testing. Third, old norms flatter. Scores rose about 2.8 points a decade in Pietschnig and Voracek’s meta-analysis of 271 samples and roughly four million people, so a 135 earned on 20-year-old norms is worth about 129 on current ones if the 0.3-point-a-year correction used in disability diagnoses is applied. That correction was built for a different purpose, so treat it as a sense of scale. Why IQ norms expire covers the Flynn effect and its recent stall.

Your own number

Where would your own score land?

Take the IIF-certified assessment and get your score with the scale it was measured on, the percentile it corresponds to and the confidence range around it — the three figures most online tests leave out.

Find your IQ score now! →

Secure & encryptedInstant results10–20 minutes

What does an IQ of 135 predict?

For groups, quite a lot; for one person, much less. The 140 article covers the Study of Mathematically Precocious Youth. Four other bodies of evidence put a 135 in context:

  • Education and work. Tarmo Strenze’s meta-analysis of longitudinal studies found intelligence correlated .56 with education, .43 with occupational status and .20 with income. It is a strong predictor but, as does IQ predict income explains, not an overwhelmingly better one than parental status or school grades.
  • Money. In a large US cohort (NLSY79), Jay Zagorsky found each extra IQ point went with roughly $200 to $600 more income a year after controls, and correlations of .30 with income but only .16 with net worth. The regressions found no statistically distinguishable link with wealth, and some measures of financial distress, such as missed payments, rose at higher scores. A 135 is not a wealth guarantee.
  • Job performance. The widely cited estimate that cognitive ability correlates about .5 with job performance (Schmidt and Hunter, 1998) was revised to about .31 in 2022 by Paul Sackett and colleagues, who argued that earlier corrections for restricted range had overshot. Ability still matters; the older figure overstated it. See what a score predicts at work.
  • No ceiling on the benefit. Matt Brown, Jonathan Wai and Christopher Chabris analysed four longitudinal studies with 48,558 participants and found no threshold beyond which higher ability stopped predicting better outcomes, and no disadvantage of high ability. Spearman’s law of diminishing returns covers the related question of whether g itself weakens at high ability.

None of these studies isolates a 135. They describe the trend a 135 sits on, and even a strong correlation leaves most of the variation in any one life to other things: a correlation of .43 accounts for about 18% of the variance.

If you or your child scored 135

Read it as a range, not a point: the low 130s to about 139 on a current Wechsler test, on the scale that test used. Before comparing it with anyone else’s number, check four things: which test, which scale (the standard deviation), how old its norms are and whether it was taken under supervision. A proctored result is far stronger evidence than a one-off online quiz, and how to read an IQ test report shows where each of those appears on a real report. For a child, the score is a ranking among children of the same age, not a fixed trait; IQ test questions for kids covers how children’s tests work, how stable their scores are and what programmes do with them.

Quick answers

Is an IQ of 135 good?

Yes. It is the 99th percentile on the standard scale, the top 1%, above the Mensa line and inside the highest band of the Wechsler manuals.

Is 135 IQ genius?

Not by any current manual. None uses the word genius, and a 135 sits inside the “very high” bands. See is 130 IQ a genius score? for the history of the label.

What percentile is an IQ of 135?

The 99.02nd percentile on a standard deviation-15 scale, the 98.6th on a standard deviation-16 scale and the 92.8th on the Cattell standard deviation-24 scale.

Can you join Mensa with an IQ of 135?

Yes, if the score comes from an approved supervised test. Mensa accepts 130 on the Wechsler tests, and unsupervised online scores do not count.

Is 135 IQ gifted?

It is above every gifted line in common use. School programmes range from around the 95th to the 97th percentile on group tests (about 125 to 128 on a standard deviation-15 scale) up to 145 and above at some highly selective ones; gifted cutoff scores explains why one line still misses children it should find.

The bottom line

An IQ of 135 is the top 1%: one person in about 100 on the Wechsler scale, past Mensa’s line, at Intertel’s, and inside the highest band of the test manuals. It is a range of roughly 128 to 139 rather than a point, it means something different on a scale with a different spread, it needs a check for old norms, and it predicts better average outcomes in education and work without guaranteeing wealth or greatness. The number that travels between tests is not 135 but 99, the percentile.

Sources

Share this article

Know someone who keeps seeing these numbers quoted without the scale they were measured on? Send it to them.

Tagged confidence interval, Flynn Effect, gifted cutoff, high iq societies, intertel, iq 135, iq classifications, iq of 135, iq percentile, iq scale, IQ Science, IQ Score, mensa, standard deviation iq, Terman, top 1 percent

Crow and Raven IQ

Understanding IQ

Crow IQ: How Smart Are Crows and Ravens, Really?

A crow has no IQ, but tests show what corvids can do: bend wire, plan hours ahead, count their own calls. The 7-year-old comparison traces to one 2014 study of six crows, who were at chance on two of six puzzles.

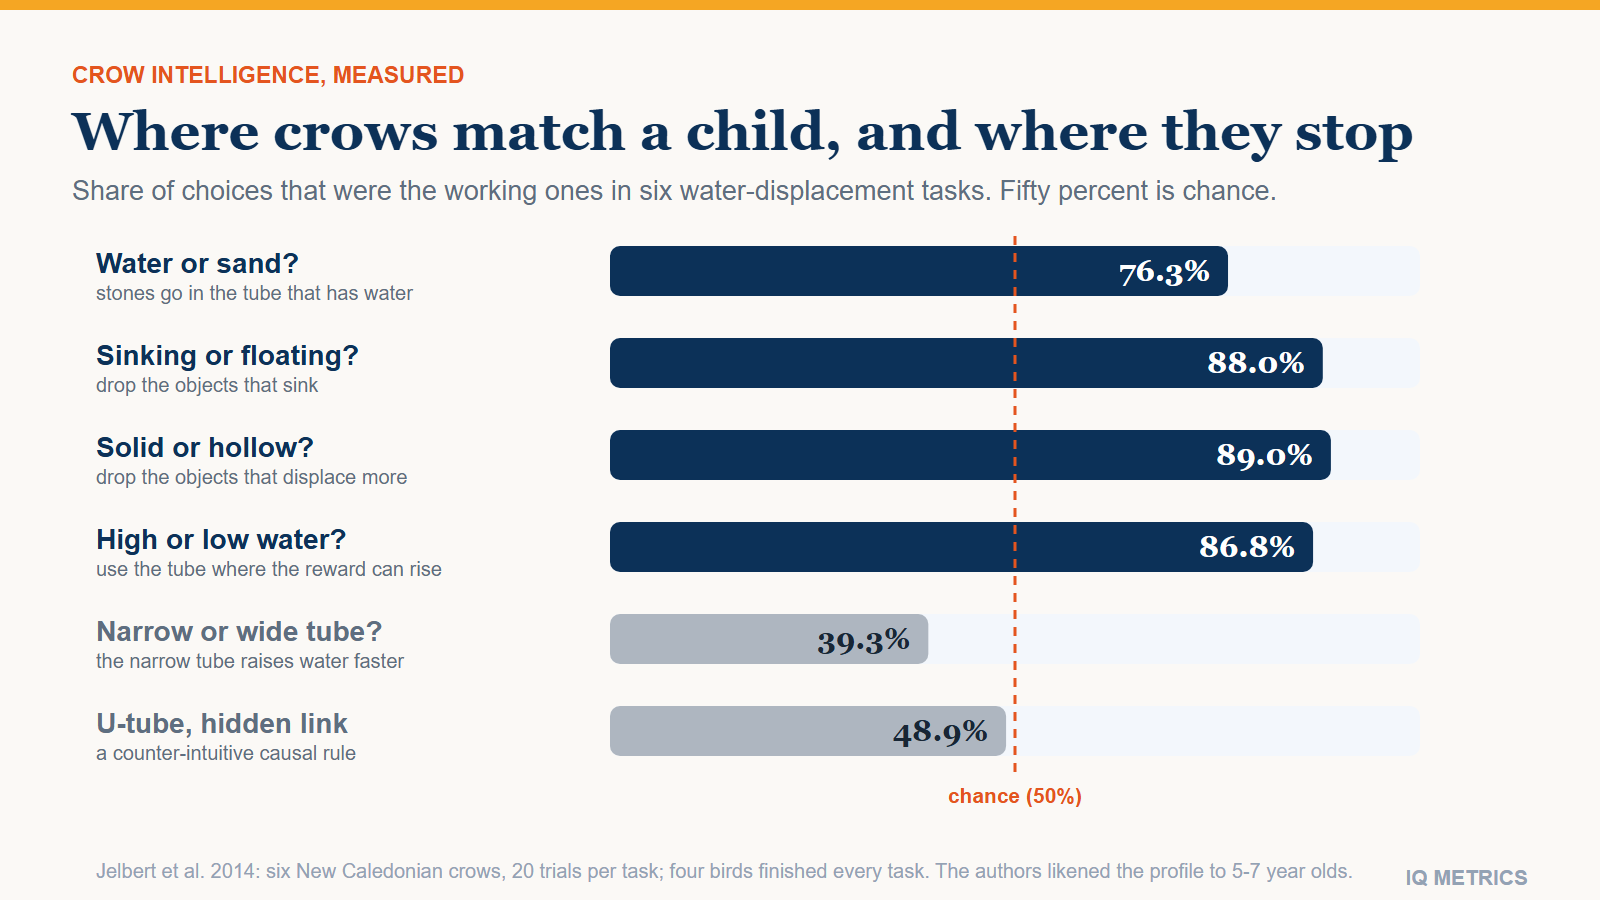
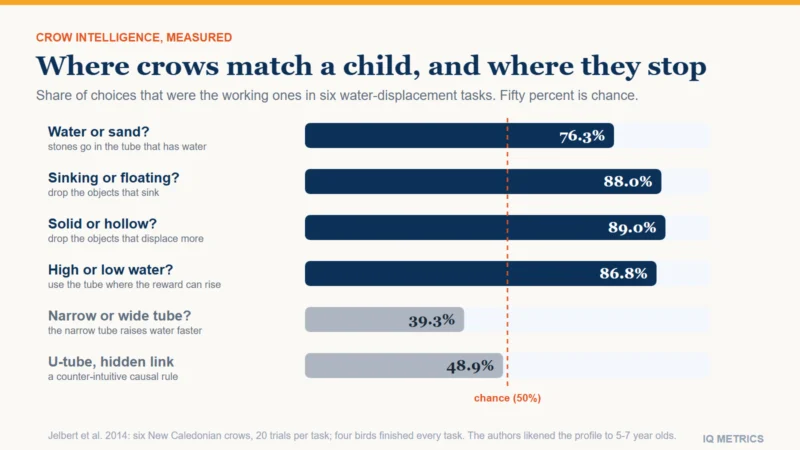
Bar chart of six water-displacement tasks: New Caledonian crows chose the working option 76 to 89 percent of the time on four tasks but stayed near chance on the narrow-tube and U-tube tasks.

A crow has no IQ. An IQ is a score defined by comparing a person with a norm group of people the same age, and no norm group exists for any bird. What science can say is what crows and ravens do: bend wire into hooks, plan for a need that will only arise hours later, produce a set number of calls on cue, and pass some cause-and-effect puzzles at about the level of a 5-to-7-year-old child. On other puzzles the same crows perform no better than chance. That mixed record is more interesting than any single number.

  • No crow IQ exists. IQ needs human norms; any figure attached to a crow or raven in a meme or listicle has no source.
  • What is measured instead: tool making, planning ahead, analogical reasoning, counting one’s own calls and remembering human faces, each tested with a task built for the species, usually on a handful of birds.
  • The “7-year-old” line traces to a 2014 study of six New Caledonian crows on water-displacement puzzles, compared with children aged 5 to 7 on that task alone.
  • Where crows stop: the same birds were at chance on two of the six puzzles.

This article covers why “crow IQ” is not a real number, the landmark experiments and their limits, the true origin of the 7-year-old comparison, how a crow brain compares with a primate brain, whether ravens are smarter than crows, and the other kind of Raven that turns up when you search for “raven IQ”.

Can a crow’s IQ be measured?

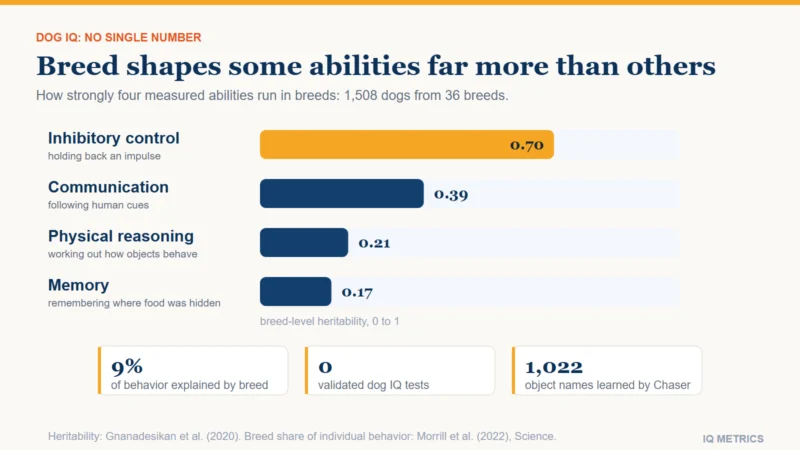
Not in the way a person’s can. A modern IQ is a deviation score with a mean of 100 and a standard deviation of 15, so a result only means something next to the people of the same age it was normed on (see the IQ bell curve). There is no such reference group for crows, and no test written in words or pictures for humans would be fair to a bird with different senses, motivations and bodies. The same problem applies to dog IQ, where researchers use tasks that fit the species instead.

What comparative psychologists do is give animals a physical task and compare pass rates, trial counts and errors. The result is a profile of what a species can do, with its own caveats about training, motivation and sample size. Some researchers have asked whether animals show a general factor of intelligence like human g. A meta-analysis of 555 correlations between cognitive tasks in animals found a mean of just 0.185 (95% confidence interval 0.087 to 0.287) and described the support for general intelligence as relatively weak. Studies of wild birds point in different directions: New Zealand robins tested on six tasks produced a first component explaining a little over 34% of the variance, below the 40% or so typical of human tests, while Australian magpies on four tasks produced 64.6%, though critics say four tasks are far from comprehensive. As far as we could find, no crow or raven has been tested for a general factor at all.

What do crows and ravens actually do?

These seven results are the ones most often cited, each from a peer-reviewed study. Species matter: crows, ravens and rooks are all corvids, but each finding belongs to the species tested, and the sample sizes are small.

Landmark corvid experiments
Experiment Species What the birds did
Tool making (Weir, Chappell and Kacelnik, 2002) New Caledonian crow A crow called Betty bent a straight wire into a hook in 9 of 10 valid trials. Her male companion never did. One bird, and the authors note the skill probably has a developmental history.
Metatool use (Taylor et al., 2007) New Caledonian crow Seven crows faced a puzzle in which a short tool had to be used to get a longer one. Six tried it and four succeeded on the first trial.
Water displacement (Bird and Emery, 2009) Rook All four rooks tested dropped stones into a water-filled tube to raise a floating reward within reach.
Analogical reasoning (Smirnova et al., 2015) Hooded crow Two birds passed relational matching-to-sample after training on identity matching. Critics question whether this is analogy in the human sense.
Planning ahead (Kabadayi and Osvath, 2017) Raven Five hand-raised ravens chose and kept a tool, or a token to trade for one, for a task that arrived 15 minutes or 17 hours later.
Counting own calls (Liao, Brecht, Veit and Nieder, 2024) Carrion crow Three crows produced one to four calls to match arbitrary cues. Errors grew with the number, which the authors read as an approximate number sense, a precursor of counting.
Remembering faces (Marzluff et al., 2010) American crow Wild crows trapped by a person in a mask kept responding to that mask for at least 2.7 years.

Two cautions apply to every row. First, most of these birds were trained or habituated for the task, and each result has critics who propose leaner explanations, such as trial-and-error learning. Second, a result such as the 2017 raven study is usually described as matching great apes on one kind of planning; it is not evidence of an all-round ape-level mind. Researchers describe the pattern as “divergent brain evolution with convergent mental evolution”, the phrase Nathan Emery and Nicola Clayton used in their 2004 Science review of the field.

Where does the "as smart as a 7-year-old" claim come from?

It traces to a 2014 paper in PLOS ONE by Sarah Jelbert and colleagues. Six wild-caught New Caledonian crows, pre-trained to drop stones, were given “Aesop’s fable” puzzles, in which objects must be dropped into a tube to raise a floating reward. Across 20 trials per task the birds chose the tube with water over the tube with sand 76.3% of the time, objects that sink over objects that float 88.0%, solid over hollow objects 89.0%, and the tube with the higher water level 86.8%. They did not favour the narrow tube that raises water faster (39.3%), and on the U-tube task, where a hidden connection makes the obvious choice the wrong one, they performed at chance (48.9%). Only four of the six birds completed every task. The authors said the birds’ grasp of causal properties rivalled that of 5-to-7-year-old children on similar tasks. Press coverage later compressed that into “as smart as a 7-year-old”.

Bar chart of six water-displacement tasks: New Caledonian crows chose the working option 76 to 89 percent of the time on four tasks but stayed near chance on the narrow-tube and U-tube tasks.

A companion study by Lucy Cheke, Elsa Loissel and Nicola Clayton (2012) gave the same tasks to children aged 4 to 10, in five two-minute trials. Most children aged seven and over learned to pass even the counter-intuitive U-tube version, while few younger children did. So the line is a fair summary of one narrow task, and even that is contested: critics note that the crows sometimes dropped non-functional objects early on, and a later meta-analysis argued that Aesop’s fable tasks cannot separate trial-and-error learning from causal reasoning. It is not a statement about general intelligence. A crow that matches a six-year-old at water displacement has not matched one at language, arithmetic or reading. The age-based comparison also mirrors how human testing works, which is what IQ test questions for kids explains.

How does a crow brain compare with a primate brain?

Bird brains are small but densely packed. A 2016 study in PNAS by Seweryn Olkowicz and colleagues counted neurons in 73 birds from 28 species and found that parrot and songbird brains hold about twice as many neurons as primate brains of the same mass. A raven’s 14-gram brain contains about 2.2 billion neurons, more than a billion of them in the pallium, the forebrain region associated with flexible behaviour. That is more than a capuchin monkey has in its pallium, and a blue-and-yellow macaw, with a walnut-sized brain, has more pallial neurons than a rhesus monkey. Two limits are worth stating. The study sampled ravens and rooks but no crow species, so “crows have primate-like neuron counts” goes a step beyond the data. And a raven’s brain, at about 14.5 cubic centimetres, is roughly a twenty-fifth the volume of a chimpanzee’s.

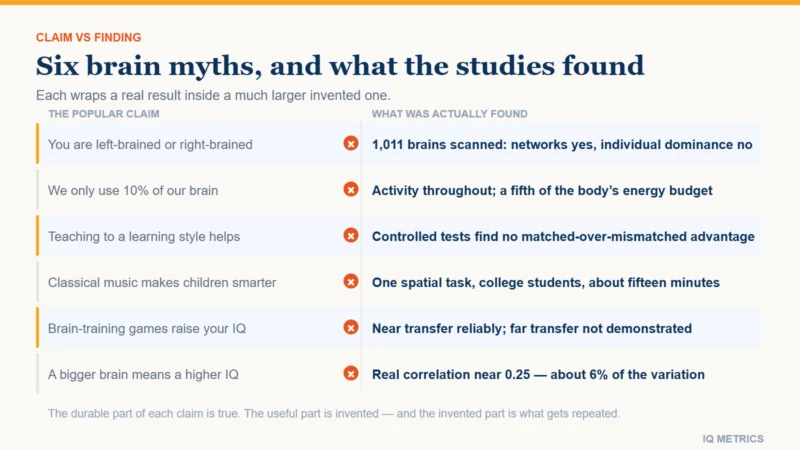
That is why “bird brain” is a poor insult, and why raw brain size is a weak predictor of ability across species. The same caution holds within humans: brain size and IQ correlate only modestly, and popular brain myths about intelligence show how often a tidy claim about brains outruns the evidence.

Crow vs raven: which is smarter?

Nobody has run one identical test battery on both species and ranked them, so the honest answer is that they are comparable on the tasks that exist. The famous tool-making results come from New Caledonian crows, which use tools routinely in the wild, while the long-range planning results come from ravens. Each species looks best on the task it was given. The physical differences are clearer:

Common raven and American crow at a glance
Measure Common raven American crow
Length 56 to 69 cm 41 to 53 cm
Wingspan 116 to 118 cm 86 to 99 cm
Weight 689 g to 1.63 kg 311 to 623 g
Oldest wild bird on record 22 years 6 months 18 years 4 months
Brain volume (measured in a comparable species) raven: 14.5 cm³ New Caledonian crow: 7.3 cm³

The raven is the largest songbird in the world, and it has the bigger brain. That does not make it the cleverer bird on any given test, only the larger one.

Your own number

Where would your own score land?

Take the IIF-certified assessment and get your score with the scale it was measured on, the percentile it corresponds to and the confidence range around it — the three figures most online tests leave out.

Find your IQ score now! →

Secure & encryptedInstant results10–20 minutes

Are crows smarter than dogs, chimpanzees or children?

There is no single fair answer, because the skills differ. Dogs are exceptional at following human pointing and gestures, a skill shaped by thousands of years of domestication; crows are exceptional at making and adapting tools, which dogs are not known to do. No head-to-head test of the two exists, and the dog IQ article covers the dog side.

Corvids have been compared with apes on published ape data rather than in the same room. In a self-control task in which an animal must resist reaching straight for visible food, ravens scored 100% (five birds), jackdaws 97% and New Caledonian crows 92%, against 100% for chimpanzees, 99.1% for orangutans, 95% for bonobos and 94.4% for gorillas. In a 2020 study, hand-raised ravens (eight started, seven finished) sat a 15-task battery adapted from the one used with apes: similar on quantities, theory of mind and social learning, slightly lower on causality and communication, and lower on spatial memory. The authors warned against generalising, and the original battery compared apes with 2.5-year-old children, which is a different yardstick from the 7-year-old headline. Verbal versus non-verbal IQ scores shows why a task-based, non-verbal measure is the closest thing to a fair test for any species.

Not the bird: Raven’s Progressive Matrices

Searching for “raven IQ” also returns a different Raven. Raven’s Progressive Matrices is a non-verbal reasoning test devised in the 1930s by the British psychologist John C. Raven, in which the test taker picks the piece that completes a pattern. It has nothing to do with the bird, and it is one of the most widely used measures of abstract reasoning in people. Its scoring is covered in Raven’s Progressive Matrices scores explained, and the pattern-completion format is the one children meet in the kids IQ tests.

Quick answers

What is the IQ of a crow?

There is none. IQ is a human-normed score. Experiments give task results, such as 76.3% correct at choosing water over sand, not a single number.

Are crows as smart as a 7-year-old?

On one narrow set of water-displacement puzzles, comparable to 5-to-7-year-olds, according to the study that started the claim. On two of six puzzles the same crows were at chance, and the comparison says nothing about language or schooling.

Can crows count?

Approximately. In a 2024 Science study three crows produced one to four calls to match a numeral or a sound cue. That shows control over the number of their own calls, not exact counting or arithmetic.

Do crows remember faces?

Yes. Wild American crows kept responding to the face of a person who trapped them for at least 2.7 years in the 2010 experiment. Claims of far longer grudges come from press coverage rather than that peer-reviewed figure.

Do crows hold funerals?

Not in the sense of mourning. Crows gather around dead crows, and research from the University of Washington found they use the scene to learn what is dangerous.

What is the smartest bird?

Corvids and parrots top the comparative studies and have the densest forebrain neuron counts, but no ranking exists across all species and tasks.

The bottom line

Crows and ravens are impressive, but the question “what is a crow’s IQ” has no answer, because IQ is a comparison with human norms. The real picture is a profile: expert tool users, planners and face-readers that match a young child on some causal puzzles and fail others. The same lesson holds for people, where what an IQ of 135 means depends entirely on the group that the score is measured against.

Sources

Share this article

Know someone who keeps seeing these numbers quoted without the scale they were measured on? Send it to them.

Tagged animal cognition, animal intelligence, bird brain, Brain Size and IQ, comparative cognition, corvids, crow iq, G Factor, intelligence research, IQ Science, raven iq, research and evidence, tool use

IQ and Religion

Research & Evidence

IQ and Religion: What the Research Actually Shows

Three meta-analyses agree: higher IQ goes with slightly weaker religious belief, r about -0.14 to -0.17, or four to five IQ points, with heavy overlap. What the numbers mean, what explains them, where they weaken and what they cannot show.

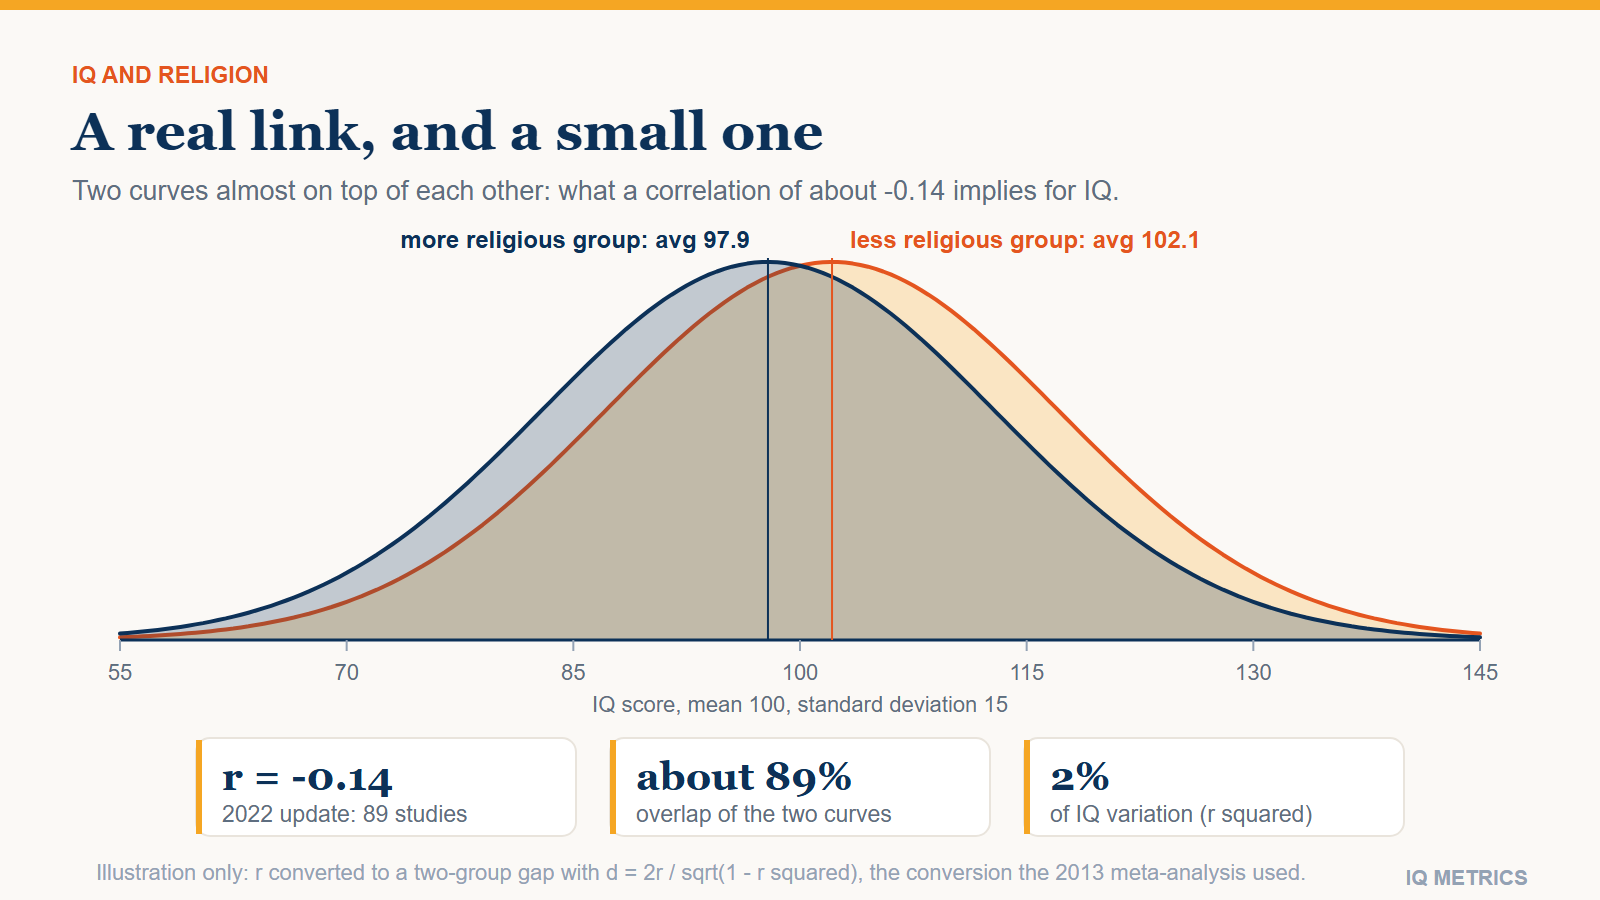
Two almost identical IQ bell curves, one for a more religious group (average 97.9) and one for a less religious group (average 102.1), overlapping by about 89 percent, drawn from a correlation of -0.14.

Yes, but only slightly. Across roughly a century of studies, higher IQ scores go with somewhat weaker religious belief, on average. The most recent large meta-analysis, published in 2022 (89 studies, 201,457 people), puts the correlation at r = −0.14. The figure most often quoted online, −0.24, comes from an earlier 2013 meta-analysis and applies to religious belief in adult samples; across all 63 studies in that review the mean was −0.16. Either way it is a small tendency across groups. It is not a verdict on any believer or non-believer, and it does not show that religion lowers intelligence or that intelligence erodes faith.

  • Direction: negative in most studies — 53 of 63 in the 2013 meta-analysis, 59 of 62 in a 2020 update, and 135 of 192 analysis specifications in 2022, with none significantly positive.
  • Size: small and stable. Three meta-analyses give overall correlations of −0.16, −0.17 and −0.14, which is about 2 to 3% of the differences in IQ, or roughly 4 to 5 IQ points between groups.
  • Weakest links: church attendance and other behaviour, spirituality, and samples younger than college age.
  • Cause: unknown. Several explanations are proposed and none has been shown to be the cause.

This article covers what the meta-analyses found, what the correlation means in IQ points, where the “atheists score six points higher” claim comes from, the main explanations, which variable seems to come first, where the link weakens, why country-level correlations deserve caution, and why nothing here supports ranking religions, or individual people, by IQ.

What do the meta-analyses show?

The first comprehensive quantitative review came from Miron Zuckerman, Jordan Silberman and Judith Hall in Personality and Social Psychology Review (2013). They pooled 63 studies from 52 sources. Fifty-three found a negative correlation between intelligence and religiosity and 10 a positive one. The mean across all studies was −0.16 (median −0.14, weighted mean −0.13). The often-quoted −0.24 is narrower: it is the mean for religious belief in college and adult samples once college scores were corrected for restricted range. The link was weaker for religious behaviour, such as attendance, and weaker below college age, where the best estimate for belief was about −0.08.

Zuckerman and colleagues repeated the exercise in 2020 with 83 studies. The belief correlation in college and adult samples came out at −0.20 to −0.23, and the cleaned 62-study set gave an overall correlation of −0.17 (95% confidence interval −0.20 to −0.14), negative in 59 of the 62. Florian Dürlinger and Jakob Pietschnig then updated the picture in PLOS ONE (2022) with 89 studies covering 105 independent samples and 201,457 participants. Their pooled correlation was −0.14 (95% confidence interval −0.17 to −0.12). They also ran 192 “reasonable” combinations of analysis choices: 135 of them (70.4%) gave a significant negative effect and none gave a significant positive one. The link was stronger when intelligence was measured with a psychometric test than with a proxy such as grade point average, and stronger for belief than for behaviour.

Three meta-analyses of intelligence and religiosity
2013 2020 2022
Authors Zuckerman, Silberman and Hall Zuckerman, Li, Lin and Hall Dürlinger and Pietschnig
Studies 63 83 (62 after cleaning) 89 (105 samples)
Overall correlation −0.16 (weighted −0.13) −0.17 −0.14
Belief in adult samples −0.24 −0.20 to −0.23 —
Negative results 53 of 63 59 of 62 135 of 192 specifications significant; none significantly positive

The overall estimate has barely moved across three reviews, and it is small in every one of them. The larger numbers people quote belong to narrower subsets.

How many IQ points is a correlation of -0.14?

A correlation feels abstract until it is converted into something concrete. Squaring it gives the share of the differences in IQ that religiosity accounts for: r² is about 0.02 at −0.14, or 2%. The other 98% is everything else.

To express it in IQ points, the 2013 authors used the standard conversion Cohen’s d = 2r / √(1 − r²), multiplied by 15, which treats the sample as two groups. For the belief measures that gave 6.2 to 7.8 points, about 7.3 on average, between believers and non-believers. The same conversion applied to the 2022 figure of −0.14 gives d = 0.28, or about 4 IQ points, with the two groups’ IQ distributions overlapping by roughly 89%. Pick one person at random from each group and the less religious person has the higher IQ about 58% of the time, against 50% for a coin flip. These are conversions from reported correlations, not measured group gaps, but they show the scale: a few points on average and very heavy overlap.

Two almost identical IQ bell curves, one for a more religious group (average 97.9) and one for a less religious group (average 102.1), overlapping by about 89 percent, drawn from a correlation of -0.14.

For comparison, the margin of error on a single good IQ test is itself a few points (see the IQ score margin of error explained), so an average gap of about four points is comparable to the uncertainty in one person’s result. The overlapping curves above are the same normal curve described on the IQ bell curve page.

Where does the "atheists score six points higher" claim come from?

Mostly from one 2009 study. Helmuth Nyborg analysed 3,742 white American teenagers in the National Longitudinal Survey of Youth (NLSY97) and reported that atheists averaged 111.1 on his general-ability estimate, agnostics 109.1, and the denominations he classed as “liberal” and “dogmatic” 107.3 and 105.2. The headline is a gap of 5.89 points between atheists and the “dogmatic” group. Three caveats matter. Only a few dozen atheists were in the sample. The denomination categories were the author’s own, and he noted that they are “highly debatable”. And the study is one teenage cohort in one country. The meta-analyses above, which pool far more people, put the average gap nearer 4 to 5 points on the same conversion.

Why might IQ and religiosity be linked?

Zuckerman and colleagues proposed three interpretations, and later work has added others. Each is a hypothesis about why a correlation exists, and they are not mutually exclusive.

  • Nonconformity. More intelligent people may be less likely to accept a belief simply because their community holds it, and so more likely to resist religious dogma.
  • Analytic thinking. People who stop and reason through a problem, rather than following their first intuition, tend to report weaker religious belief. A 2016 meta-analysis in PLOS ONE (31 studies, 15,078 people) found a correlation of −0.18 between Cognitive Reflection Test performance and religious belief, and the 2020 update found analytic style partly mediated the intelligence link. Both are ability tests, so this may partly restate the same thing.
  • The functions religion serves. Religion can supply a sense of control, self-regulation, self-worth and secure attachment. Intelligence can supply some of the same things, so more intelligent people may have less need for religious belief.
  • Education. Schooling goes with both higher test scores and lower religiosity, but it explains little of the link. Across 15 studies with the relevant data, controlling for education moved the correlation only from −0.20 to −0.18. A 2016 re-analysis by Gregory Webster and Ryan Duffy argued the opposite, and the 2020 update disputed it.

In the 2016 analytic-thinking paper, 133 self-identified atheists scored 18.7% higher than 597 religiously affiliated people on a composite of analytic-thinking measures (Cohen’s d = 0.72), a far larger gap than the IQ correlations imply. That result concerns a thinking style, in small samples, and should not be read as an IQ gap. The wider point that intelligent people still make poor judgments is the subject of why smart people make bad decisions.

Which comes first, intelligence or religiosity?

Correlational data cannot say, and the 2013 authors were explicit about that. Two sets of results are, however, consistent with intelligence coming first. In four studies that measured intelligence 3 to 25 years before religiosity, the mean correlation was about −0.12. And the roughly 1,528 gifted children Lewis Terman selected in the 1920s, generally with IQs above 135 (see what an IQ of 135 means), grew up less religious than the general public in all four comparisons the 2013 authors could make, even though around 60% reported strict or considerable religious training as children.

The evidence is not one-directional, though. In the Lothian Birth Cohort 1921, a Scottish group tested at age 11 in 1932 and followed into their nineties, intelligence at age 11 was unrelated to religiosity at 83; only later-life intelligence correlated with religious belief. Neither belief nor attendance predicted cognitive change from age 11 to old age, or across the ninth decade of life. In that cohort religion neither protected nor harmed mental ability over time (Ritchie, Gow and Deary, Intelligence, 2014). The sociologist Darren Sherkat even proposed the reverse arrow for conservative Christian fundamentalism: by discouraging secular schooling and outside information, it may hold verbal ability back.

Where does the link get weaker or disappear?

Belief is not behaviour. In the Scottish cohort, religious belief was negatively related to intelligence but church attendance was not. A 2026 study in Frontiers in Psychology using two large US cohorts (NLSY79, N = 12,686; NLSY97, N = 8,984) found the same split within denominations in the NLSY97 data: among Catholics the correlation with belief was −0.09 but with religious behaviour +0.04, and among Protestants −0.06 and 0.00. Going to services for community, family or habit is a different thing from what a belief scale measures.

Spirituality is not religiosity. A 2024 analysis of the General Social Survey’s ten-word vocabulary test, a short measure of crystallised ability rather than a full IQ test (35,093 respondents across 14 cohorts spanning 1988 to 2022), found that religiosity correlated −0.13 with the score, while spirituality correlated +0.03, which is effectively nothing.

Younger samples. Both the 2013 and 2020 reviews found the link weaker below college age, at about −0.07 to −0.08.

Re-analyses disagree. Webster and Duffy re-analysed the 2013 data and argued that the negative link appeared only in samples of women and only in studies dated before 2010. The 2020 update and the 2022 meta-analysis, both with more studies, did not find those patterns to be robust. Two careful groups reaching different conclusions from overlapping literatures is a reason for humility about how stable the link is in recent samples.

Your own number

Where would your own score land?

Take the IIF-certified assessment and get your score with the scale it was measured on, the percentile it corresponds to and the confidence range around it — the three figures most online tests leave out.

Find your IQ score now! →

Secure & encryptedInstant results10–20 minutes

Why do country-level correlations deserve caution?

The most quoted single figure is from a 2009 paper by Richard Lynn, John Harvey and Helmuth Nyborg: across 137 nations, the correlation between national IQ estimates and the share of people disbelieving in God was 0.60. Look at their own table, though. Among the 69 countries with national IQs of 64 to 86 the correlation was 0.16, and among the 68 with IQs of 87 to 108 it was 0.54. The United States is itself an outlier, with unusually low disbelief for a high-IQ country. National IQ figures rest on small, uneven samples and on tests designed in Western countries, which is why country IQ rankings cannot bear much weight and why average IQ by country figures need heavy caveats. A correlation between countries also says nothing about individuals inside them, and wealth, schooling and life expectancy move with both variables. Webster and Duffy reported that the link became non-significant once they controlled for spatial dependence, the fact that neighbouring countries resemble each other.

Can you rank religions by IQ?

No dataset supports it. Nyborg’s teenage sample produced denominational averages, but the groups were small (some a few dozen respondents), the spread inside each was 10 to 15 points, and his own analysis found that denomination explained almost none of the variation in IQ (R² of about 0.001). Even the 2026 analysis of two large national cohorts could not compare Jewish or Muslim participants because there were too few of them. The meta-analyses above concern how strongly individuals hold religious belief, not which religion they hold, so they say nothing about traditions. The same discipline applies to any identity group; see IQ and political party for how survey comparisons of that kind should be read, and cultural bias in IQ tests for why the test itself can favour some backgrounds.

What can this research not tell you?

  • Anything about one person. An r of −0.14 leaves 98% of the variation unexplained. Every belief group, and every non-belief group, contains people at every IQ level, including the roughly one person in a hundred who scores 135 or higher and people well below average.
  • Which way the arrow points. Schooling, family background and country move with both variables, and schooling itself changes test scores. Education-level patterns are covered in average IQ by education level.
  • Anything about wisdom, ethics or wellbeing. IQ tests sample reasoning tasks. They do not measure kindness, meaning or judgment.

Quick answers

Are atheists smarter than religious people?

On average, non-believers score a few IQ points higher in most studies, with almost complete overlap between the groups. That is a statistical tendency across large samples, not a statement about any one person.

Does religion lower IQ?

There is no good evidence that it does. In one long-running cohort, neither religious belief nor attendance predicted cognitive change from childhood to old age. The correlation describes who holds which beliefs, not a cognitive cost of holding them.

What is the average IQ of religious people?

No single figure exists. Studies report correlations and group differences on different tests, and religious people are not one group. The best summary is the meta-analytic correlation: small, negative, and mainly about the strength of belief.

Is IQ linked to spirituality?

Not meaningfully. In a 2024 analysis of 35,093 US respondents spirituality correlated +0.03 with a vocabulary-test score, against −0.13 for religiosity.

Is the link the same in every country and religion?

Unknown. Most of the individual-level evidence comes from Western, largely US samples, and most IQ tests were developed in Western cultures, so the pattern is best documented for the groups studied most.

The bottom line

Higher IQ scores go with slightly weaker religious belief across large samples. The best current estimate is about −0.14 to −0.17, roughly four to five IQ points between groups, with heavy overlap. The link is strongest for belief rather than behaviour, absent for spirituality, weaker in the young, contested in some re-analyses, and not evidence that religion harms thinking or that intelligence removes faith. It is a small fact about populations and a poor guide to any individual.

Sources

Share this article

Know someone who keeps seeing these numbers quoted without the scale they were measured on? Send it to them.

Tagged analytic thinking, atheism, cognitive ability, confounding variables, correlation vs causation, effect size, intelligence research, IQ and religion, IQ Science, longitudinal study, meta-analysis, religion and intelligence, religiosity, research and evidence

IQ and Testosterone

Research & Evidence

IQ and Testosterone: Does the Correlation Chart Hold Up?

A popular online chart claims a clean link between testosterone and IQ. Real studies disagree with each other on direction and size, and the most rigorous test found no effect at all. What the actual research says, and why the meme persists.

Four cards comparing testosterone and cognition findings across studies: no correlation in 8 year old boys, positive at age 10, negative at age 12, and no association with memory in older men in a Mendelian randomization study.

No — not a consistent one, in either direction. A chart claiming a clean relationship between testosterone and IQ circulates widely online, but real studies measuring both disagree with each other on direction, size, and even which way the correlation points, and the most rigorous test of the idea — a study designed specifically to get at cause and effect rather than mere correlation — found no relationship at all. This article covers what actual studies have found, why the results keep contradicting each other, and why the popular chart is not backed by the research it claims to summarize.

Where the "IQ and testosterone chart" comes from

Search interest in “iq and testosterone chart” and “iq and testosterone chart meme” is real and substantial, which tells you something on its own: the chart is a social-media object first and a scientific claim a distant second. Versions of it typically carry no citation at all, or misread a single study far beyond what it actually found. The appeal is obvious — a simple story about two traits people already have strong intuitions about — and that is exactly the kind of claim worth checking against the underlying research rather than the picture.

What real studies actually find

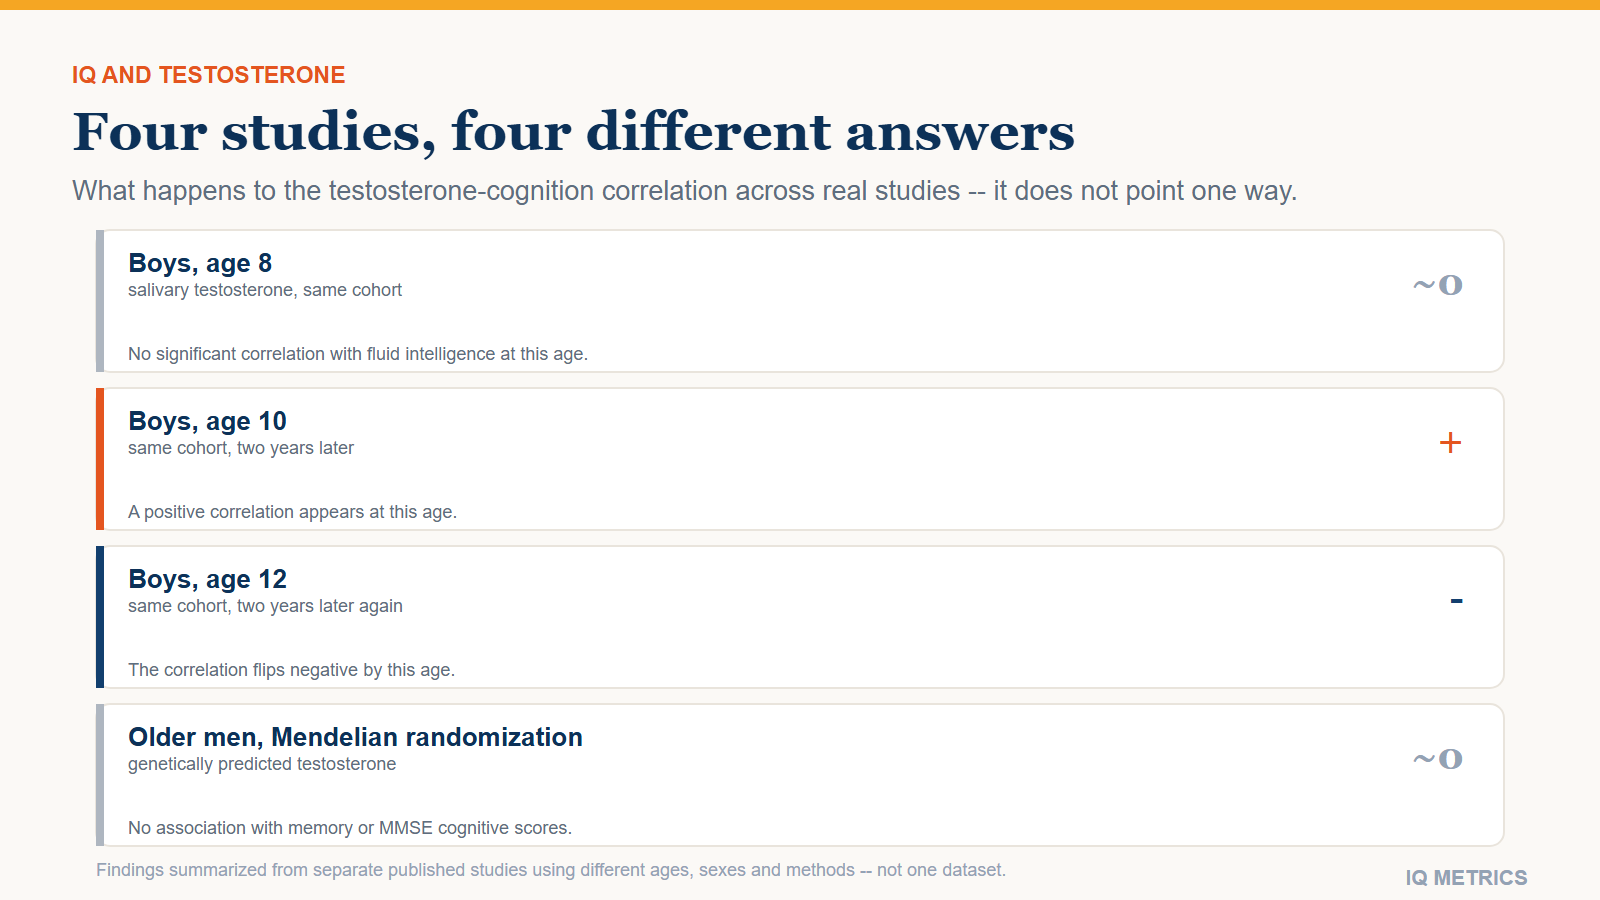
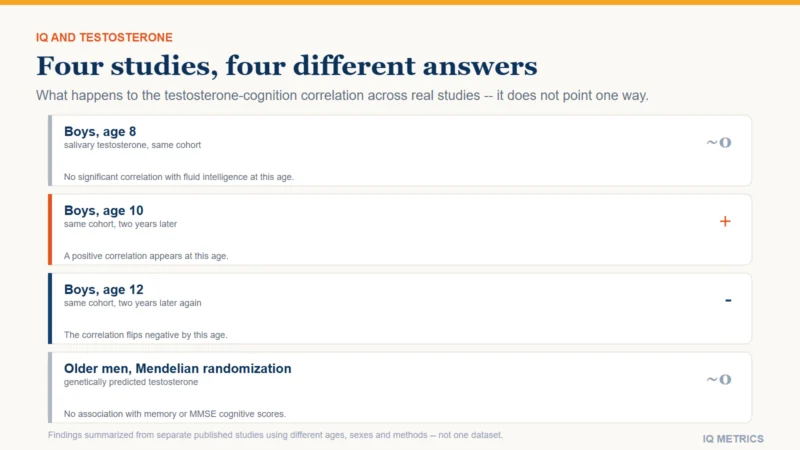
One informative study followed the same group of boys at ages 8, 10 and 12, measuring salivary testosterone and fluid intelligence at each age. At 8, there was no significant correlation at all. By 10, a positive correlation had appeared. By 12, in the same children, the correlation had flipped negative. A relationship that changes sign three times in the same group of people over four years is not a relationship a single chart can honestly summarize with one arrow.

Four cards comparing testosterone and cognition findings across studies: no correlation in 8 year old boys, positive at age 10, negative at age 12, and no association with memory in older men in a Mendelian randomization study.

That kind of instability is itself the finding. If testosterone straightforwardly raised or lowered cognitive ability, the direction should not reverse twice in the same cohort as puberty progresses. What actually seems to be happening is that both testosterone and cognitive development are moving on their own timelines during this period, and any correlation that shows up at one snapshot in time is easy to mistake for a stable underlying relationship that is not really there.

Why anyone expected a link in the first place

The hypothesis is not baseless. Androgen receptors, the proteins testosterone binds to in order to affect cells, are present in brain regions tied to memory and spatial processing, including the hippocampus and areas of the prefrontal cortex, and animal research has linked testosterone to effects on neurogenesis, the growth of new neurons. That gives the idea real biological plausibility — a mechanism worth testing — which is different from evidence that the effect actually shows up reliably, at a meaningful size, in human cognitive test scores. Plenty of biologically plausible mechanisms fail to produce a detectable real-world effect once they are actually measured, and this appears to be one of them — a different outcome than the much better-supported evidence for a genetic contribution to IQ, which rests on a far larger and more consistent body of twin and family research than anything testosterone has produced.

Measurement noise makes the search harder than it looks. Testosterone is not a fixed trait like height; it follows a strong daily rhythm, typically highest in the morning and declining through the day, is released in pulses rather than at a steady level, and can spike temporarily with stress, competition or even a single interaction. A one-time blood or saliva sample is a noisy snapshot of a moving target, and comparing that snapshot against a single test score taken on a different occasion adds a second layer of noise on top of the first. Some of the disagreement between studies is a real biological story; some of it is almost certainly this.

The curvilinear theory

Some research on adults has proposed a curvilinear, inverted-U pattern instead of a straight line: moderate testosterone levels associated with the best fluid-intelligence performance, with both unusually low and unusually high levels associated with somewhat worse scores. Fluid vs. crystallized intelligence explains what fluid intelligence specifically measures — on-the-spot reasoning rather than accumulated knowledge, which is the ability most of these studies actually test. Even the curvilinear pattern is not consistent across every study, and it appears to depend on age, sex and how testosterone is measured, which is a more honest, and much less shareable, story than a single chart.

Your own number

Where would your own score land?

Take the IIF-certified assessment and get your score with the scale it was measured on, the percentile it corresponds to and the confidence range around it — the three figures most online tests leave out.

Find your IQ score now! →

Secure & encryptedInstant results10–20 minutes

The strongest test we have says: nothing

The most methodologically convincing study on this question used Mendelian randomization in older men: rather than simply comparing testosterone levels and cognitive scores at one point in time, which cannot separate cause from effect or rule out some third factor driving both, researchers used genetic variants known to predict testosterone levels, which are assigned effectively at random at conception. That design mimics the logic of a randomized trial and largely removes reverse causation from consideration. The result: genetically predicted testosterone showed no association with delayed word-recall scores or Mini-Mental State Examination scores. When the method best suited to detecting a causal effect finds nothing, that carries more weight than another simple correlation would, in either direction.

Why prenatal exposure is a different question entirely

A separate and more active research area looks at prenatal testosterone exposure, often estimated using the ratio between the length of the second and fourth fingers, and its relationship to spatial ability specifically, not general intelligence. That research strand asks a genuinely different question — what happened during fetal development, not what someone’s hormone level measures today — and conflating the two is a common way this topic gets muddled online. A finding about prenatal exposure and spatial skill is not evidence about whether an adult with higher testosterone right now has a higher IQ.

The best-known version of this separate research strand is Simon Baron-Cohen’s “extreme male brain” theory of autism, which proposes that elevated prenatal testosterone exposure shifts cognitive style toward systemizing over empathizing. It remains a debated theory rather than settled fact within autism research, and it is worth naming here specifically because it sits right next to this topic and gets folded into it constantly online, even though it is about neurodevelopmental style and a specific diagnosis, not about IQ as this article is discussing it.

Sex differences complicate the picture further, in a way the broader research on IQ and sex differences runs into constantly. Circulating testosterone levels differ by roughly an order of magnitude between adult men and women, so a study population that is all-male, all-female, or mixed is effectively asking a different question each time, and the studies summarized above span all three designs. A correlation measured within the male range, where testosterone varies across a comparatively narrow band, is not automatically comparable to one measured across the much wider combined range, which is one more reason a single chart cannot honestly compress this literature into one line.

One counter-intuitive finding worth knowing

A study of prepubertal children found that boys of average intelligence actually had significantly higher testosterone levels than both intellectually gifted boys and boys with intellectual disability — the opposite of a simple “more testosterone, more IQ” pattern, and a useful reminder that a single study can cut against the popular narrative just as easily as it can support one. It should be read with the same caution as every other single study here: one sample, one age group, not a settled fact.

Why the meme persists anyway

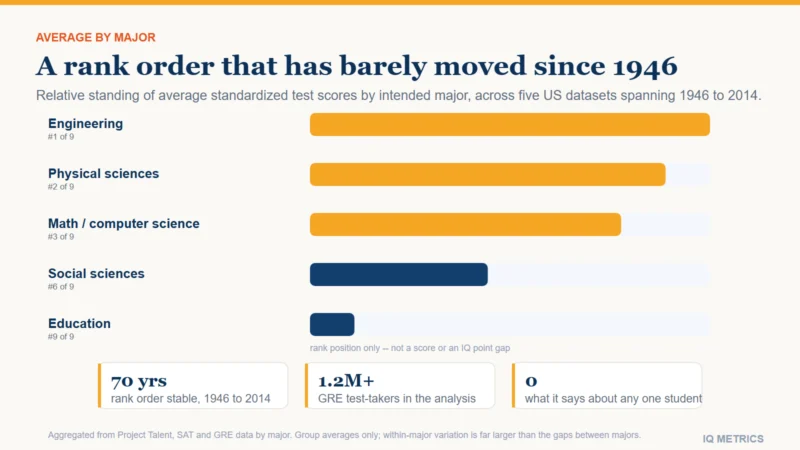
A chart with a clean line is more shareable than a paragraph explaining that the real answer depends on age, sex, measurement method and study design. That gap between what spreads easily and what the evidence actually supports is not unique to this topic; average IQ by college major is a useful contrast — a genuinely stable, replicated finding that happens to be less dramatic than a meme, which may be exactly why it circulates less.

The bottom line

No study reviewed here supports a simple, stable link between testosterone and IQ in either direction. The correlation flips sign across childhood in the same children, adult findings depend heavily on age and sex, and the single most rigorous causal test available found no effect at all. The popular chart is describing a relationship the research does not actually show.

Share this article

Know someone who keeps seeing these numbers quoted without the scale they were measured on? Send it to them.

Tagged biological factors, cognitive ability, correlation vs causation, fluid intelligence, gender differences, hormones, IQ Science, myths and misconceptions, prenatal development, research and evidence, testosterone