IQ Metrics
IIF Certified Assessment Start IQ Test
IIF Certified Assessment

Stereotype Threat and Test Scores

Taking a Test

Stereotype Threat: Does It Really Change Test Scores?

Few findings in psychology have been cited as widely, or held up as poorly, as stereotype threat. The original experiments were elegant and the idea is intuitive. Two decades of replication attempts have left a much smaller and more uncertain effect than the textbook version suggests.
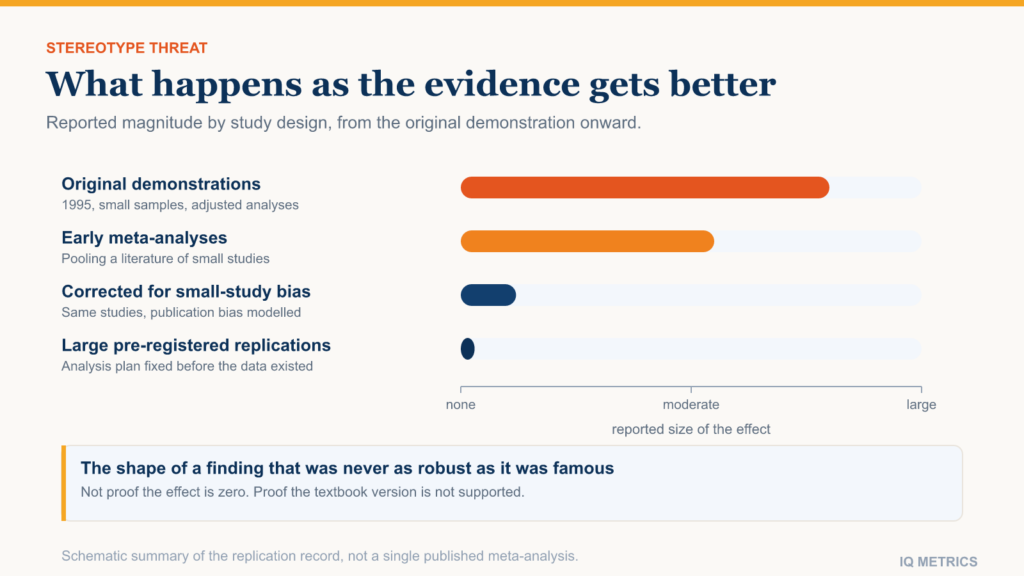
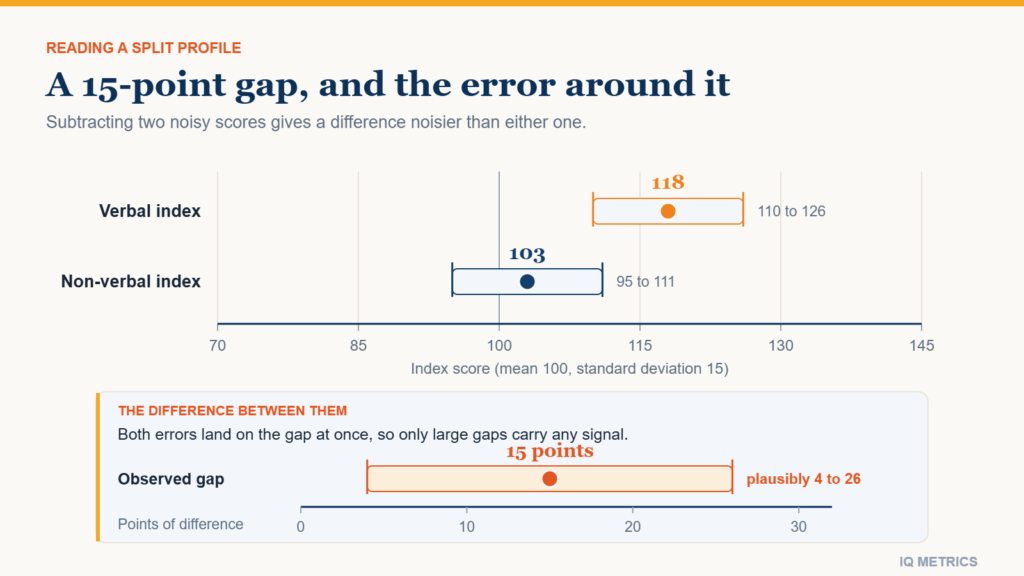
Diagram distinguishing cultural bias in test items, which is a property of the questions, from stereotype threat, which is a property of the testing situation and the instructions given before it

Stereotype threat is the proposal that being reminded of a negative stereotype about a group you belong to, immediately before a test that the stereotype concerns, lowers your performance on it. It is one of the most cited ideas in social psychology, it appears in most undergraduate textbooks, and it has had a rougher time in the replication literature than almost any other finding of comparable fame.

Both halves of that sentence deserve equal weight. This article sets out what the original studies found, why the effect is a different thing from test bias, what happened when large pre-registered replications were run, and what a person about to sit a test should reasonably conclude.

What the original experiments showed

The founding studies, published by Claude Steele and Joshua Aronson in 1995, gave university students a set of difficult verbal questions taken from a graduate admissions test. The manipulation was purely in the framing: one group was told the task was diagnostic of verbal ability, another that it was a laboratory exercise in problem solving. The questions themselves were identical.

The reported result was that performance differed by condition in a way that tracked the stereotype the framing made salient. It was a striking demonstration because nothing about the test had changed. If a sentence of instructions could move scores, then a score was partly a product of the situation in which it was collected, not only of the person producing it.

One methodological detail matters for what came later. The headline analyses adjusted for participants prior admissions-test scores. Whether that adjustment is appropriate has been argued about ever since, because it changes the quantity being estimated from “how did the groups score” to “how did they score relative to expectation”. Reasonable people disagree, and the unadjusted contrasts are weaker.

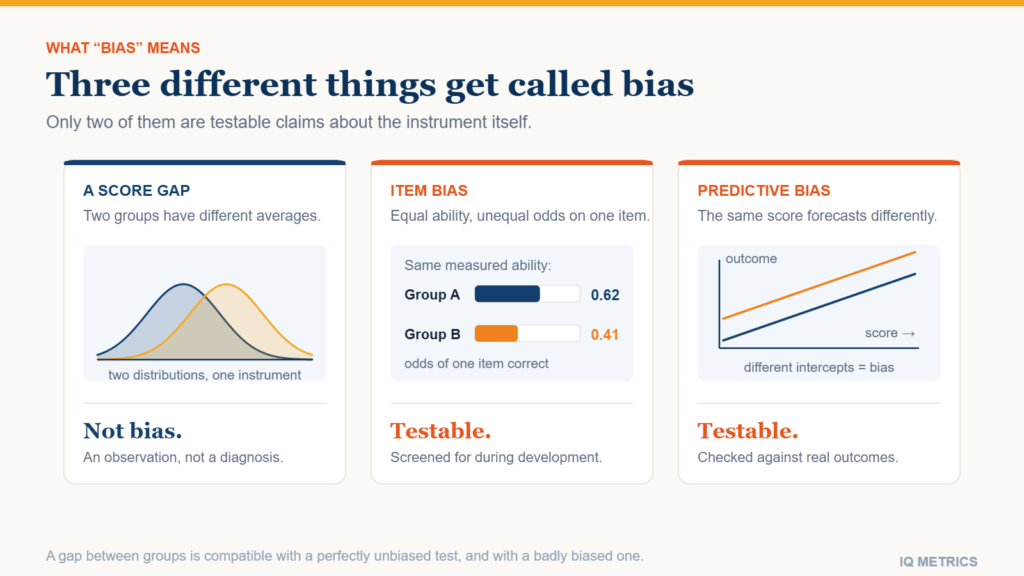
It is not the same thing as a biased test

These two ideas are constantly merged and they make different claims about different objects.

  • Test bias is a property of the questions. An item is biased when it draws on knowledge or conventions unevenly distributed across the groups taking it, so the item measures something other than the ability it is supposed to measure. It is detectable by statistical analysis of item functioning, and it is fixed by rewriting or removing items.
  • Stereotype threat is a property of the situation. The claim is that identical items yield different scores depending on what is said beforehand. Nothing about the instrument is faulty; the context surrounding its administration is doing the work.

The practical consequence is that they call for different remedies and produce different evidence. The item-level question is covered in cultural bias in IQ tests, which is about content. This article is about framing. Conflating them lets a weak result in one area be used as support in the other.
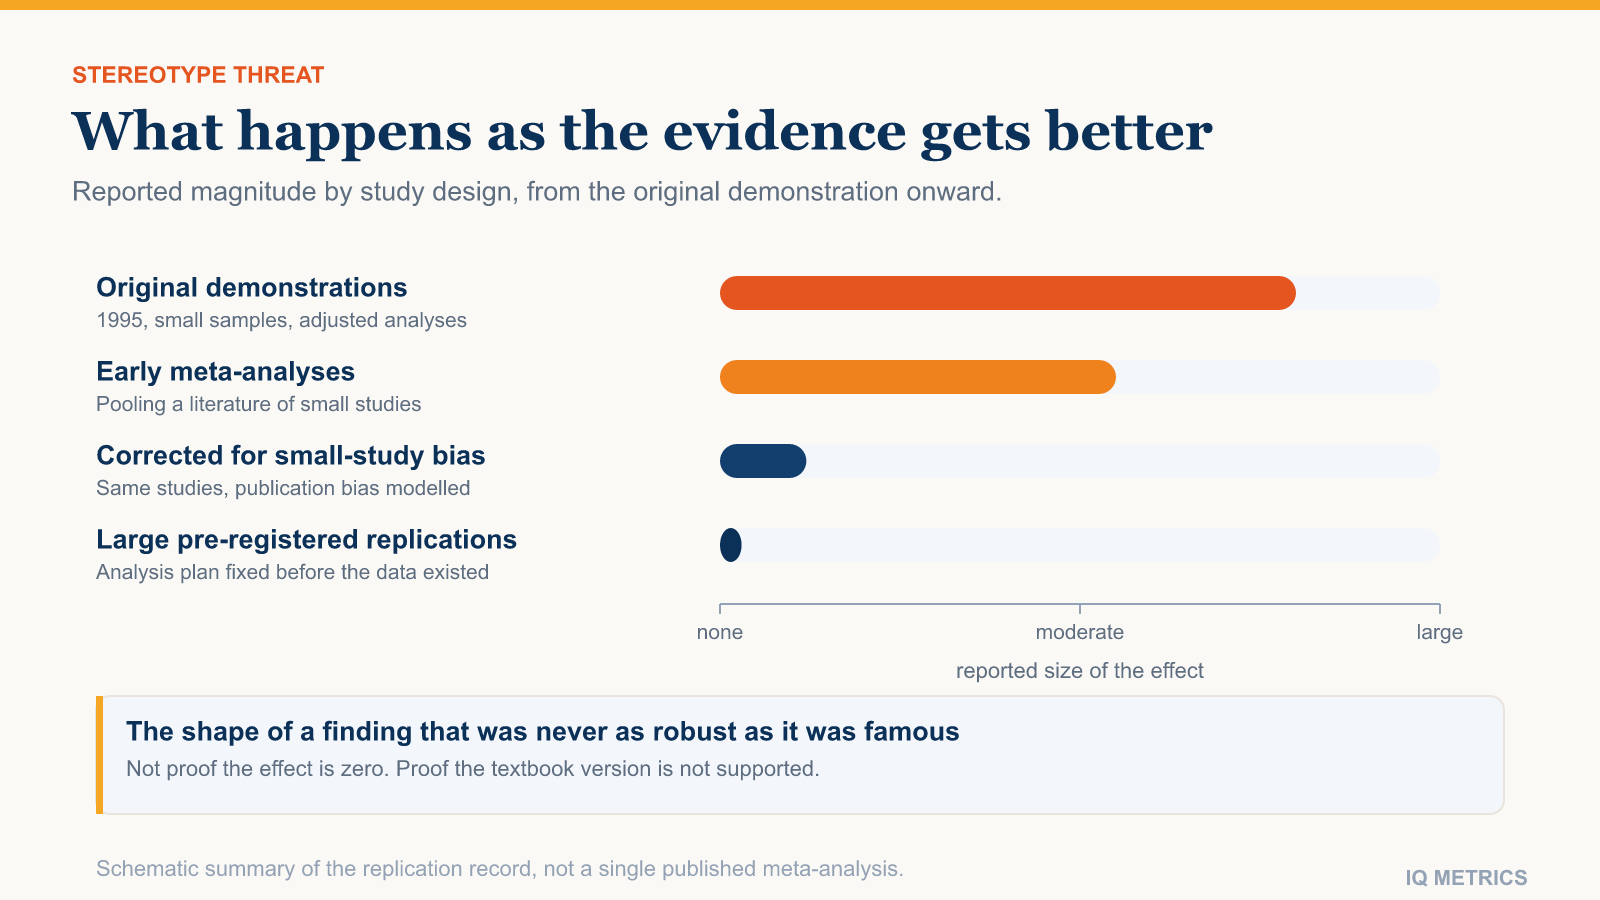
Diagram distinguishing cultural bias in test items, which is a property of the questions, from stereotype threat, which is a property of the testing situation and the instructions given before it

What replication did to the effect

The original result was followed by hundreds of studies, most of them small, and for some years the meta-analytic average looked solid. Then the same scrutiny that reshaped much of social psychology arrived, and it found the usual problems.

  • Small-study effects. Meta-analyses of the stereotype-threat literature on mathematics performance in girls found the classic signature of publication bias: small studies reporting large effects, large studies reporting small ones. Correcting for it moved the adjusted estimate close to zero.
  • Pre-registered replications came back null. Large studies that fixed the analysis plan in advance, across multiple schools and sizeable samples, have repeatedly failed to find the effect.
  • Analytic flexibility was substantial. Whether to covary out prior ability, which subgroups to analyse, and which outcome to treat as primary were all choices made after the data existed in much of the early work.

None of this establishes that the effect is zero. Absence of evidence in a set of replications is not the same as evidence of absence, and it remains possible that the phenomenon is real but requires conditions the replications did not reproduce. What it does establish is that the confident textbook version — a large, robust, easily triggered effect — is not supported.

It is worth noticing what this does and does not change about the underlying questions. Stereotype threat was often invoked to explain observed differences between groups on tests. If the effect is much smaller than claimed, that explanation weakens — but the differences themselves were always a separate empirical matter, with their own large literature and their own unresolved arguments, and nothing about the replication failures settles those. IQ tests and gender differences takes that question on directly. A weak mechanism is not evidence for any particular alternative mechanism.

Your own number

Where would your own score land?

Take the IIF-certified assessment and get your score with the scale it was measured on, the percentile it corresponds to and the confidence range around it — the three figures most online tests leave out.

Find your IQ score now!

Secure & encryptedInstant results10–20 minutes

The laboratory and the examination hall

Almost all of this evidence comes from short experiments on volunteers, usually students, working through a subset of test items in a room they will leave in half an hour. Whether the effect transfers to a real assessment that matters to the person taking it is a separate empirical question, and it has been studied much less.

There are arguments in both directions and it is worth seeing them set against each other rather than picking one. On one side, a real assessment carries far more consequence, and if evaluative pressure is the mechanism then more consequence should mean more pressure. On the other, a real assessment is usually taken by someone who has prepared for it, in a familiar format, without an experimenter saying anything about groups at all — and the manipulation is precisely what the laboratory studies were adding.

The few attempts to test for the effect in operational admissions and certification data have generally not found it. That is not decisive either, because a field setting cannot control what each candidate is thinking. But it does mean the confident extrapolation from a thirty-minute laboratory task to national examination results was never supported by direct evidence.

The mechanism that still looks plausible

The most credible proposed mechanism is that evaluative pressure consumes working memory. Monitoring your own performance, suppressing an intrusive worry and continuing to reason all compete for the same limited resource, so anything that adds to the monitoring load has less capacity left for the task.

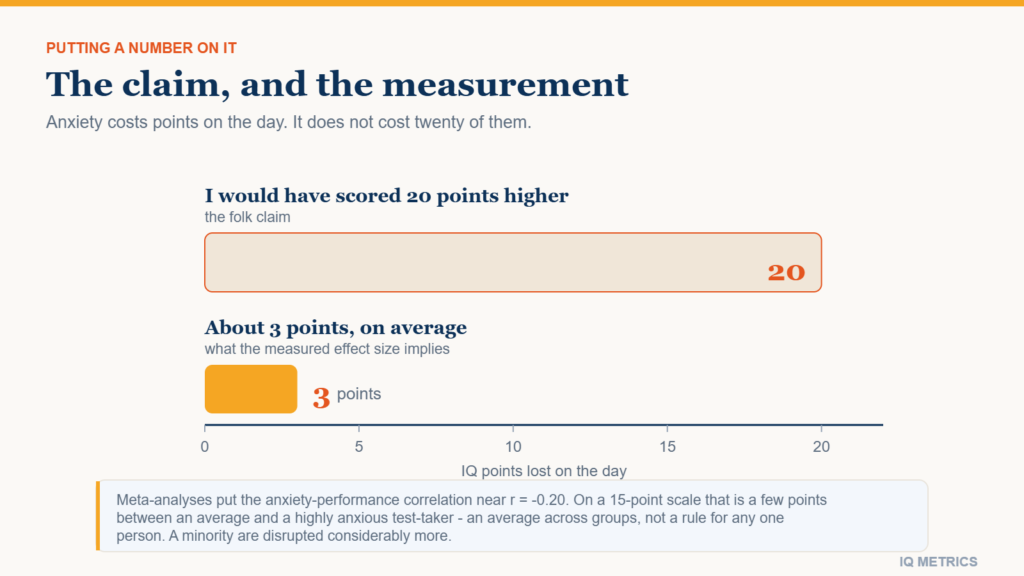
That account is attractive because it does not depend on stereotypes at all. It predicts that any source of evaluative pressure should cost performance, which is a much better-supported claim — and one with a substantial independent literature behind it, covered in test anxiety and IQ scores. On this reading, stereotype threat is a specific and hard-to-reproduce instance of a general effect that is easy to reproduce.

It also explains why the demonstrations were fragile. If the active ingredient is the pressure rather than the stereotype, then the stereotype manipulation only works when it happens to generate enough pressure — which will depend on the sample, the setting, the era and how plausible the framing sounds to the people hearing it.

What this means if you are about to take a test

The practical advice is unchanged by the controversy, because it follows from the well-supported half rather than the contested one.

  • Evaluative pressure costs performance. Whatever reduces it — familiarity with the format, an unhurried setting, treating a practice attempt as practice — is worth having.
  • Test conditions are part of the measurement. A score collected under pressure and one collected calmly are not interchangeable, which is one reason a single administration deserves less weight than people give it.
  • Be sceptical of a single dramatic study, including one you like. The reason this finding was believed for so long is that it was elegant and widely repeated, not that it was robust.

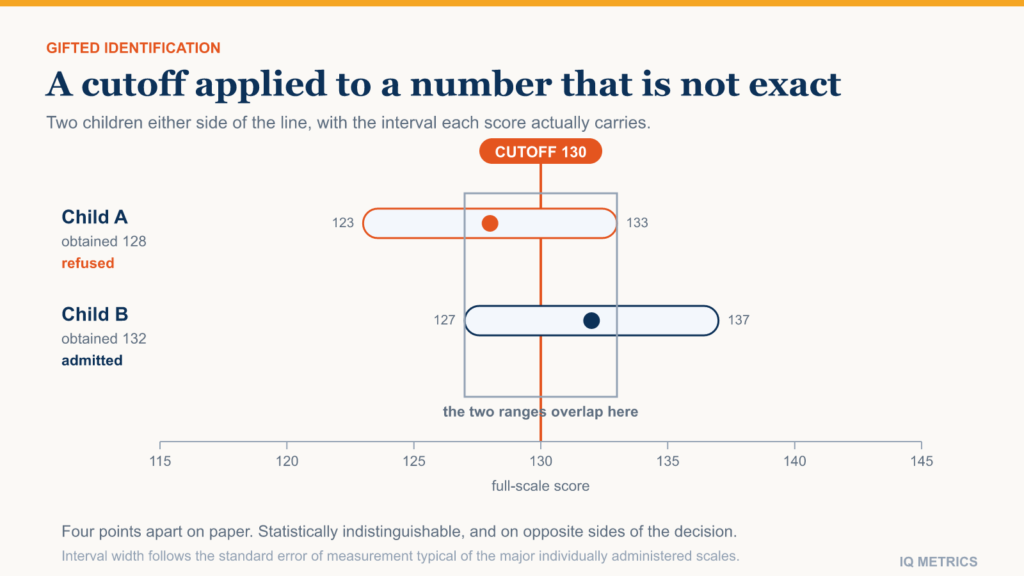
The broader lesson generalises past this one result. A test score is a measurement taken under conditions, and conditions vary. That is also why a threshold applied to a single number does more damage than most people realise, which is the subject of gifted cutoff scores. Where a finding in this field is genuinely contested, this site says so rather than picking the version that reads better.

Share this article

Know someone who keeps seeing these numbers quoted without the scale they were measured on? Send it to them.

Nutrition and IQ

Research & Evidence

Nutrition and IQ: What Diet Can and Cannot Change

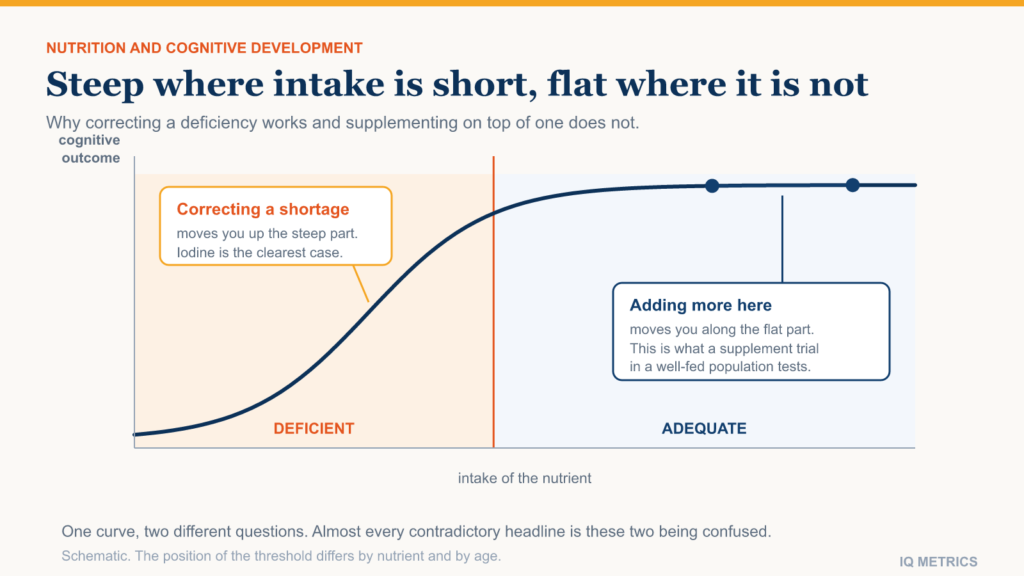
The evidence on diet and intelligence looks contradictory until you separate two questions that get asked as one. Fixing a real deficiency produces some of the largest effects in the field. Adding more of the same nutrient to an already adequate diet produces close to nothing.

Diagram contrasting the steep cognitive gain from correcting a nutritional deficiency with the flat response to supplementing an already adequate diet, shown as a curve that rises sharply and then plateaus

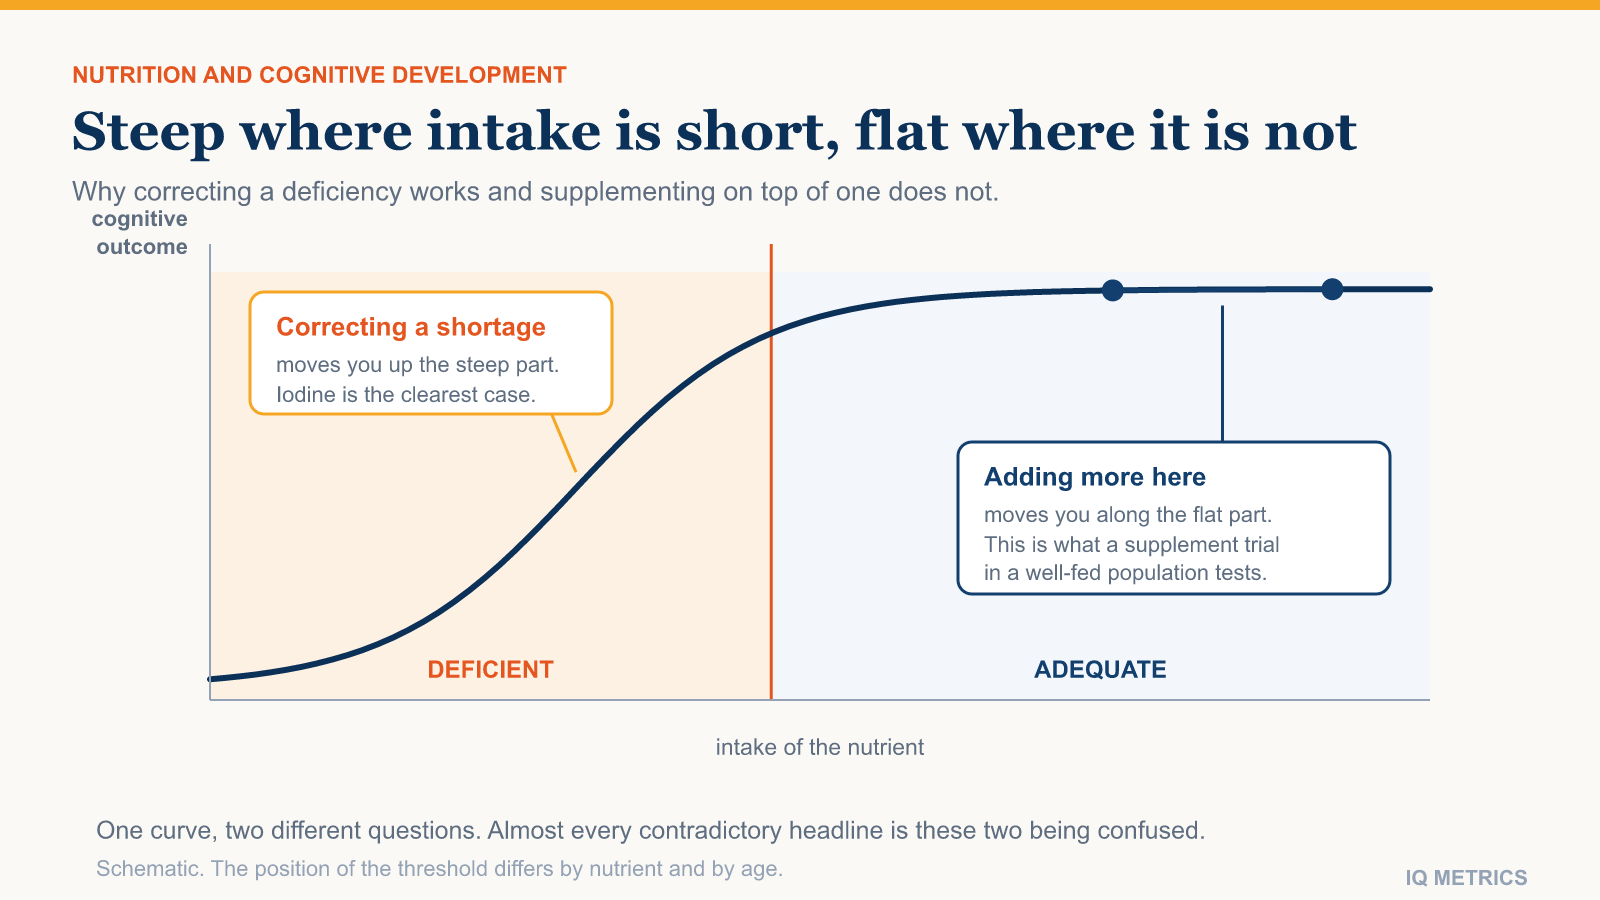
Nutrition affects IQ scores substantially when a real deficiency is present and corrected, and barely at all when it is not. Those two findings are not in tension; they are the same curve read at different points. The relationship between a nutrient and cognitive development is steep where intake is inadequate and close to flat once it is sufficient, which is exactly what you would expect from something the body requires in a fixed amount rather than an unlimited one.

Almost every confusing headline in this area comes from applying a result obtained at one end of that curve to people sitting at the other. This article separates the two, names the deficiencies where the evidence is strong, and explains why the supplement trials in well-fed populations keep coming back empty.

Iodine: the largest nutritional effect on record

Iodine is required to make thyroid hormone, and thyroid hormone governs brain development before and shortly after birth. Severe deficiency during that window produces profound and permanent intellectual disability. What made iodine the standout case is that the milder end of the range turned out to matter too.

Meta-analyses comparing populations in iodine-deficient regions with comparable iodine-sufficient ones have reported differences on the order of thirteen IQ points. That is an enormous figure by the standards of this literature — roughly the gap between the middle of the distribution and the boundary of the bottom sixth. It is also why salt iodisation is routinely described as one of the highest-return public health measures ever implemented.

The caveats are real and worth stating. These are comparisons between regions rather than randomised assignments, and iodine-deficient regions differ from iodine-sufficient ones in other ways. The supplementation trials that have been run give smaller effects than the observational comparisons. But the direction is consistent, the mechanism is understood at the level of a specific hormone, and no serious reviewer disputes that severe deficiency causes cognitive harm.

Iron, and the deficiencies that are common enough to matter

Iron deficiency anaemia in infancy is associated with poorer performance on developmental and cognitive assessments, and the association persists in children who are treated later — which suggests, without proving, that part of the effect is on development rather than on current functioning. General protein and energy malnutrition in early childhood shows the same pattern.

Two features recur across all of these findings and are worth holding on to:

  • Timing dominates dose. The same deficiency matters enormously in the first two years and much less later. The periods when the brain is building structure are the periods when a shortage of building material is expensive.
  • Correction is incomplete. Treating a deficiency after the developmental window has passed improves things without restoring the counterfactual. This is the single most important reason the deficiency findings do not translate into a supplementation strategy for adults.
  • Deficiency travels with everything else. Households where children are iron-deficient differ in many other respects. The better studies adjust for this; adjustment is never complete, and the honest estimates carry wide intervals.

Breastfeeding: the confounding problem in miniature

Observational studies have consistently found that breastfed children score a few points higher on cognitive tests. The problem is that in most countries the mothers who breastfeed for longer differ systematically from those who do not, in education, income and their own test scores — all of which independently predict a child result.

Two study designs have attacked this. Sibling comparisons, which contrast siblings raised in the same household who were fed differently, shrink the association sharply and in several analyses remove it. The PROBIT trial in Belarus did something rarer: it randomised the promotion of breastfeeding across maternity hospitals, producing a genuine experimental contrast. At age six and a half it found a meaningful verbal advantage in the intervention group; by adolescence, much of that had attenuated.

The reasonable position is that there is probably a small effect, that it is far smaller than the raw observational gap, and that anyone quoting the raw gap is quoting mostly the confounding. This is a good general lesson for reading any claim in this area: ask what else differs between the groups being compared, and whether any design in the literature has removed it.

Diagram contrasting the steep cognitive gain from correcting a nutritional deficiency with the flat response to supplementing an already adequate diet, shown as a curve that rises sharply and then plateaus
Your own number

Where would your own score land?

Take the IIF-certified assessment and get your score with the scale it was measured on, the percentile it corresponds to and the confidence range around it — the three figures most online tests leave out.

Find your IQ score now!

Secure & encryptedInstant results10–20 minutes

Why the supplement trials keep coming back empty

Omega-3 fatty acids are the clearest example. The reasoning behind them is sound in outline: long-chain fatty acids are structural components of neural membranes, and infants deprived of them do worse. The inference that adding more to a child who is already getting enough will produce further gains is where it breaks down.

Randomised trials of omega-3 supplementation in adequately nourished children and adults have largely reported null results for general cognitive ability, and systematic reviews of that literature reach the same conclusion. The same pattern holds for most multivitamin trials in well-nourished populations: small, inconsistent, often non-significant, and rarely replicated at the same magnitude.

This is not a claim that supplements are useless. It is a claim about which question they answer. A supplement corrects a deficiency. If there is no deficiency, there is nothing to correct, and the trial measures what happens when you add a nutrient to someone who already has enough of it. The answer, repeatedly, is very little.

How to read a diet-and-intelligence headline

Studies in this area reach the public through a filter that systematically favours the surprising over the reliable. A handful of questions will usually tell you which kind you are looking at, and they can be asked without any technical knowledge of the subject.

  • Was the population deficient to begin with? If the sample was already adequately nourished, a null result is the expected result and a positive one needs replication before it is worth anything.
  • Was anything randomised? Diet is chosen, and people who choose one diet differ from people who choose another in income, education and health behaviour. Where a trial exists, prefer it to a survey, even a very large survey.
  • What was the outcome measure? A change on one reaction-time task is not a change in general ability. Studies often measure several outcomes and report the one that moved.
  • How long was the follow-up? Effects that are present at six months and gone at five years were probably never effects on development. The breastfeeding literature is the clean illustration of this.
  • Who paid for it? Trials of a specific supplement funded by its manufacturer report positive results more often than independently funded trials of the same compound.

Applying that list to the popular claims removes most of them. What survives is a short list dominated by early-life deficiency, which is the opposite of the story the supplement aisle tells.

Breakfast, glucose and the difference between state and trait

Skipping breakfast does measurably affect performance on attention and memory tasks in the following hours, particularly in children who are undernourished to begin with. This is a real effect and it is not the same kind of effect as anything above.

An IQ score is meant to estimate a stable characteristic. Hunger, sleep loss and caffeine change how well you perform on the day without changing the thing the test is trying to estimate — they add noise to the measurement rather than moving the quantity being measured. That distinction is why “eat before the test” is sensible advice for getting an accurate reading and is not a way to become more intelligent. The rest of the same-day list is in what affects IQ test results, and the case of nerves specifically is in test anxiety and IQ scores.

What to take from all of this

The picture that emerges is narrower and more useful than either “diet determines intelligence” or “diet is irrelevant”.

  • Correcting severe deficiency during early development produces some of the largest effects anywhere in this field, and iodine is the clearest case.
  • The effects are developmental, so most of the opportunity lies before school age rather than before a test.
  • Supplementation on top of adequacy has repeatedly failed to produce cognitive gains in randomised trials, and the honest reading of that literature is that it does not work.
  • Same-day factors such as hunger affect the measurement rather than the ability, which is why they matter for accuracy and not for capability.

Nutrition therefore belongs in the same small category as lead exposure: a genuine, well-evidenced influence on population-level cognitive development that operates almost entirely through early childhood, and that has very little to say to an adult wondering about their own result. The wider question of what can and cannot be changed later is covered on can you improve your IQ.

Share this article

Know someone who keeps seeing these numbers quoted without the scale they were measured on? Send it to them.

Lead, Pollution and IQ

Research & Evidence

Lead, Pollution and IQ: The Exposures That Move Scores

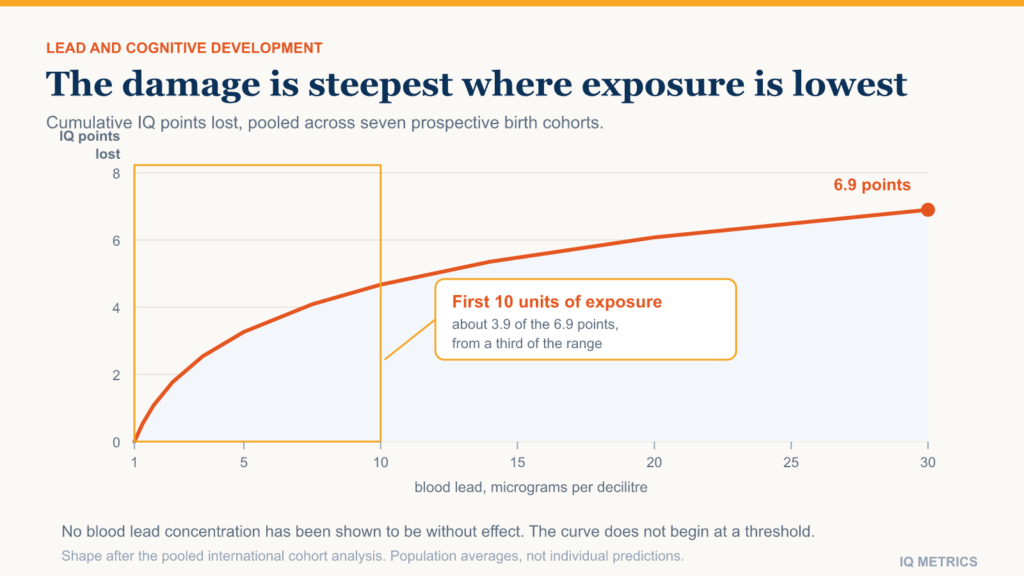
Most things people believe raise or lower intelligence turn out to be small, contested or confounded. Childhood lead exposure is the exception: one of the best-established environmental effects on cognitive test scores anywhere in the literature, with a dose-response curve most people find counterintuitive.

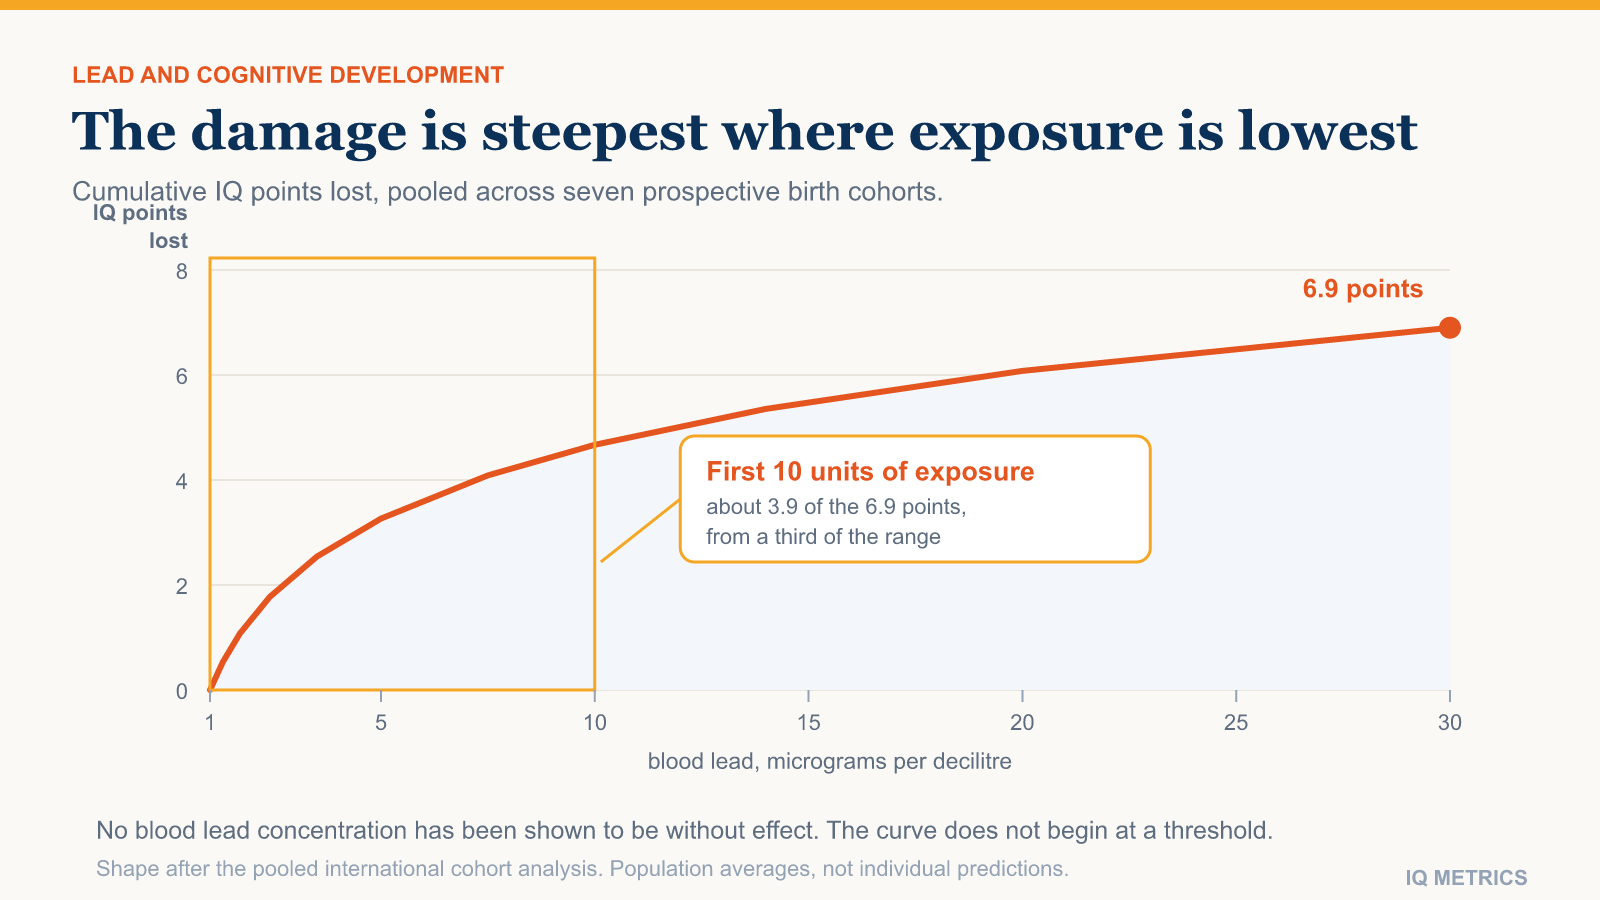
Chart showing the supralinear relationship between childhood blood lead concentration and IQ score, with the steepest loss occurring across the lowest range of exposure rather than the highest

Childhood lead exposure lowers IQ scores, and unlike almost every other environmental claim about intelligence, this one is not seriously disputed. It is supported by prospective cohorts on four continents, by a pooled analysis that combined seven of them, and by a population-scale natural experiment that ran for two decades when leaded petrol was withdrawn. Neither the World Health Organization nor the United States Centers for Disease Control now recognises a blood lead concentration below which no effect is observed.

The part that surprises people is the shape of the curve. The damage is not spread evenly across the range of exposure. Per unit of lead, the steepest loss happens at the lowest concentrations — the ones that were treated as unremarkable for most of the twentieth century. This article sets out what the evidence actually says, how large the effect is in score points, and why none of it tells you anything useful about your own adult test result.

Why a developing brain is the vulnerable target

Lead has no biological function in the human body. It is absorbed because it is chemically similar enough to calcium, iron and zinc to be taken up by the same transport routes, and children absorb a far larger fraction of what they ingest than adults do. Once in circulation it crosses the placenta and the immature blood-brain barrier, and it interferes with processes that are at their most active in early childhood: synapse formation, pruning and the myelination that makes signalling efficient.

That timing is the whole story. The same exposure that produces a measurable cognitive deficit in a two-year-old produces very little in a thirty-year-old, because the thirty-year-old has already built the structures the exposure disrupts. It is one of the clearest cases in the field of a factor that acts on brain development rather than on brain performance, which is also why the effect does not wash out: the deficits found at age five are still there at age ten.

How large is the effect in score points?

The most-cited number comes from a 2005 pooled analysis led by Bruce Lanphear, which combined the raw data from seven prospective cohort studies rather than averaging their published conclusions. Across an increase in blood lead from roughly 2.4 to 30 micrograms per decilitre, it estimated a loss of about 6.9 IQ points, with a confidence interval running from around 4 to 9 points.

Two things about that figure matter more than the figure itself. The first is the shape: the fitted curve is supralinear, meaning the slope is steepest where exposure is lowest. The analysis estimated a loss of roughly 3.9 points across the first stretch — from about 2.4 up to 10 micrograms per decilitre — and less than that across the whole remaining twenty. A child moving from very low to moderately low exposure loses more per unit than a child moving from high to very high.

The second is that this is an average across a population, not a prediction about a person. Four to seven points is a fraction of the ordinary spread of scores, and it sits well inside the measurement error of a single test session. No individual result can be attributed to lead. What the number does describe is what happens to a whole distribution when an entire birth cohort is exposed — and that is a very different quantity, as the next section shows.

The natural experiment nobody designed

Tetraethyl lead was added to petrol from the 1920s and phased out across most of the world between the mid-1970s and the 1990s. In the United States, average blood lead in young children fell from around 15 micrograms per decilitre in the late 1970s to below one today. That is a change of more than ninety per cent, applied to an entire population, over a period short enough to measure.

Applying the pooled dose-response curve to a shift of that size gives an expected gain of several IQ points at the population level, and a much larger proportional change at the tails: shifting a whole distribution upward by even three or four points substantially increases the number of people above any high threshold and reduces the number below any low one. That is the sense in which a small average effect can be a large public health effect.

How much of the twentieth-century rise in raw test scores this explains is genuinely contested. Scores were already climbing before leaded petrol was withdrawn, and the rise is measured across countries with very different exposure histories, so lead is at best one contributor among several — alongside nutrition, schooling and test familiarity. The wider argument about why norms drift is covered in why IQ norms expire. Treat lead as a demonstrated mechanism of the right sign and plausible size, not as the explanation.

Chart showing the supralinear relationship between childhood blood lead concentration and IQ score, with the steepest loss occurring across the lowest range of exposure rather than the highest
Your own number

Where would your own score land?

Take the IIF-certified assessment and get your score with the scale it was measured on, the percentile it corresponds to and the confidence range around it — the three figures most online tests leave out.

Find your IQ score now!

Secure & encryptedInstant results10–20 minutes

Air pollution and the other exposures

Lead is the exposure with the strongest evidence, not the only one ever studied. Fine particulate matter, prenatal exposure to certain organophosphate pesticides, and manganese in drinking water have all been linked to lower scores on cognitive tests in children. The findings are real enough to take seriously and much weaker than the lead literature, for a reason worth understanding.

  • Confounding is severe. Polluted air, older housing and low household income travel together. Separating the exposure from everything else that accompanies it is far harder than for lead, where blood concentration can be measured directly in each child.
  • The designs are mostly observational. Almost none of this evidence comes from anything resembling a randomised comparison, and where quasi-experimental designs exist the estimates usually shrink.
  • Effect sizes are smaller and less consistent. Where lead studies converge on a similar slope across countries and decades, the pollution literature does not yet converge in the same way.

The honest summary is that lead is established, and the rest is suggestive. That distinction gets lost when all of it is reported as “pollution lowers IQ”, and losing it makes the strong finding look as arguable as the weak ones.

What this does not tell you about your own score

If you have just taken a test and are wondering whether an exposure explains your result, the answer is almost certainly no, for three separate reasons.

  • The window has closed. The effect is developmental. Adult exposure at ordinary environmental levels does not produce the same deficits, because the processes it disrupts have finished.
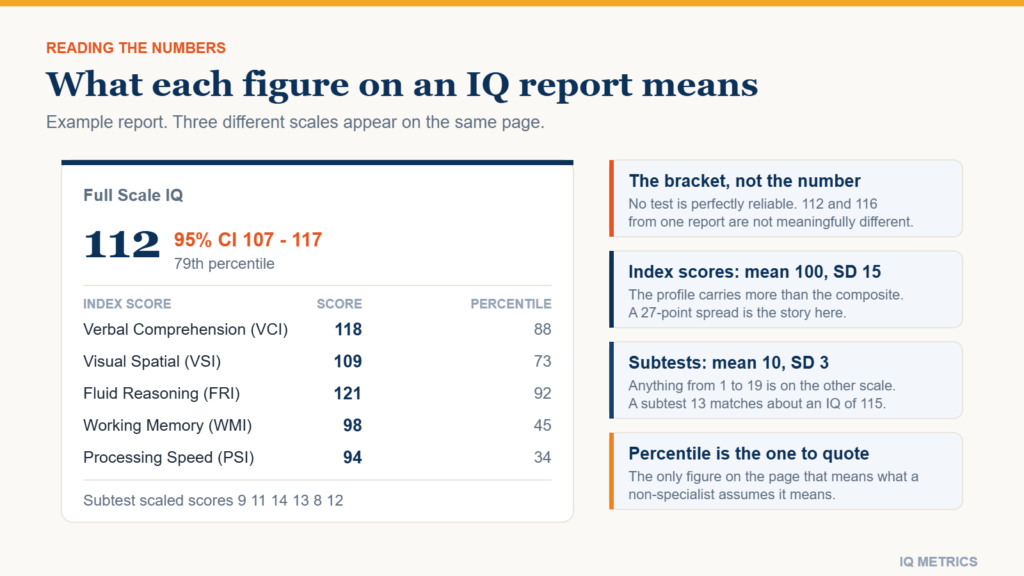
  • The effect is smaller than the noise. A few points sit inside the confidence interval of any single administration. Reading a personal history out of one score is not something the measurement supports — see how to read an IQ test report for what the interval around a score actually means.
  • Nothing on a test detects it. There is no subtest, index or profile shape that identifies an exposure history. A blood test measures lead; a cognitive test does not.

The useful reading runs the other way. This is one of the few places where the research supports a concrete action — not for the person taking the test, but for a child who has not been exposed yet. It also belongs to a small group of factors that genuinely move population-level scores, alongside the nutritional deficiencies covered in nutrition and IQ. Most of what gets sold as a way to raise intelligence does not belong in that group at all.

Where this sits in the wider picture

Debates about intelligence tend to be framed as heredity against environment, as though a finding on one side subtracts from the other. Lead is a clean illustration of why that framing fails. Heritability estimates are computed within a population at a given time, and they say nothing about what a change in conditions would do — a point set out in is IQ genetic. A population can have high heritability for a trait and still shift substantially when a specific environmental insult is removed from everybody. That is roughly what happened.

It also sets a realistic bar for every other environmental claim. Lead has a measurable dose in each individual, a plausible biological mechanism, a consistent slope across countries, a dose-response relationship, and a population-scale removal that went the predicted way. When something else is described as changing intelligence, that is the standard of evidence worth asking for. Most candidates meet almost none of it — and the general list of things that shift a result on the day is covered in what affects IQ test results.

Share this article

Know someone who keeps seeing these numbers quoted without the scale they were measured on? Send it to them.

Processing Speed and IQ

Understanding IQ

Processing Speed and IQ: Does Thinking Fast Mean Thinking Well?

Fast thinkers are assumed to be smart thinkers, and there is a real finding underneath the stereotype: people who score higher on IQ tests do respond faster on tasks with no reasoning content at all. But the link is weaker than the folklore, and on a professional battery the speed index is the least g-loaded.

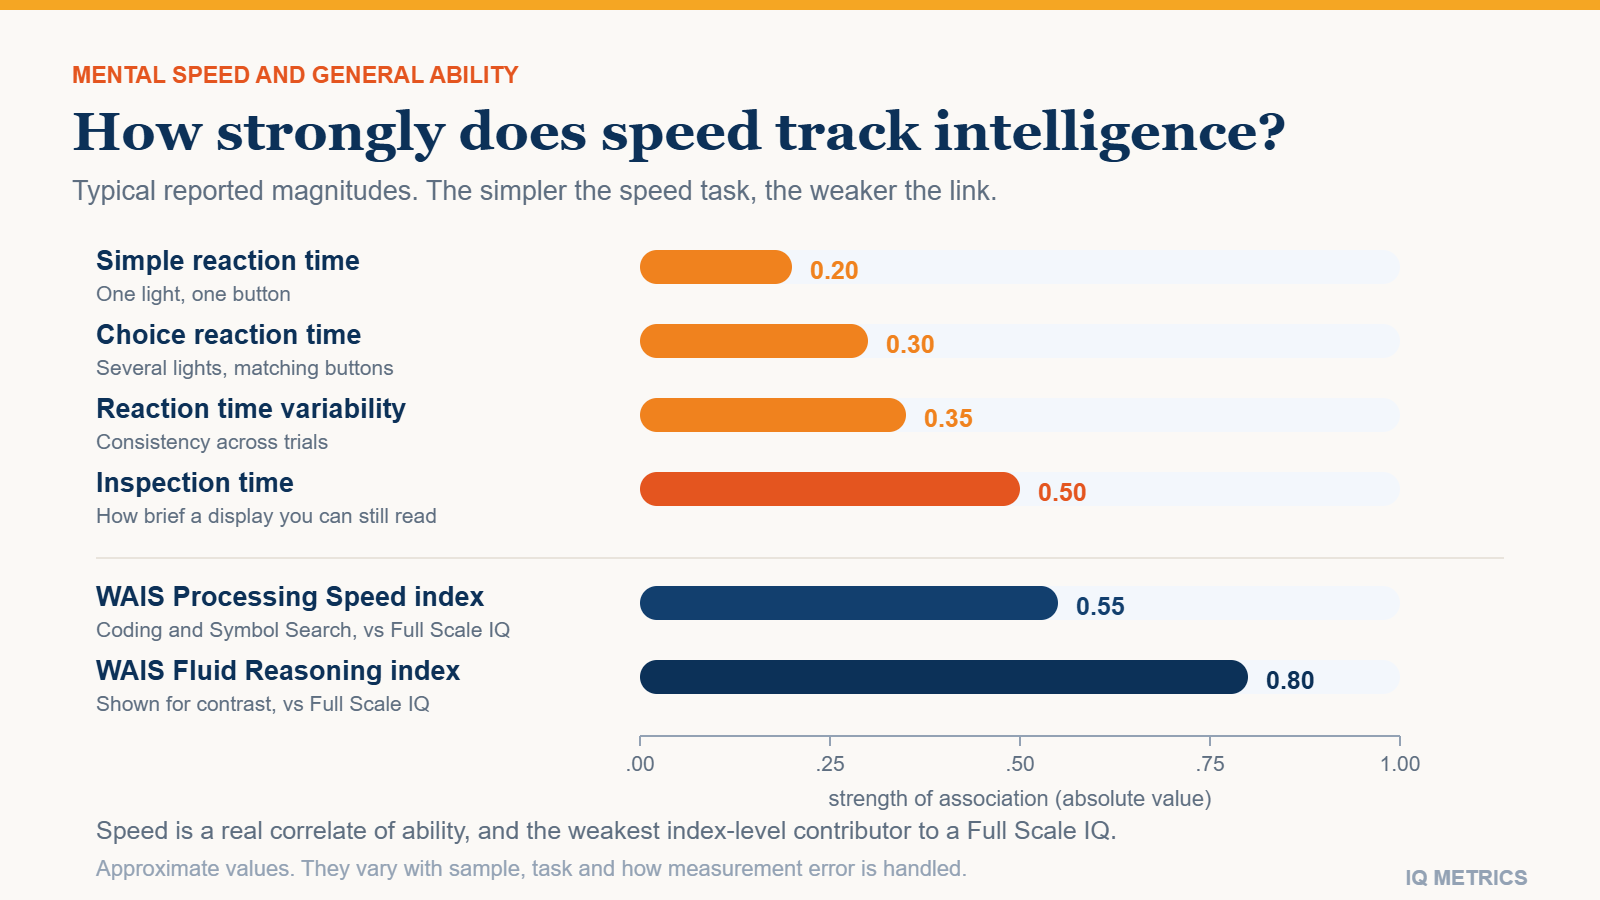
Diagram showing where processing speed sits in the structure of cognitive ability, with simple reaction time, choice reaction time and inspection time on one axis and their differing strength of association with general intelligence shown alongside

Processing speed and IQ are genuinely related, but far less tightly than the stereotype of the quick-witted genius suggests. People with higher IQ scores do respond faster on tasks that contain no reasoning at all — pressing a button when a light comes on — and that finding has held up for over a century. The association is real. It is also modest, and it gets stronger the more complex the speed task becomes, which tells you something important about what is actually going on.

This matters practically, because speed shows up in three different places: as an index on professional batteries, as a time limit on almost every online test, and as the main casualty of cognitive ageing. Those three are often confused with each other.

Reaction time: the oldest finding in the field

The idea that mental speed underlies intelligence goes back to Francis Galton in the 1880s and was revived by Arthur Jensen in the 1970s. The modern version uses a simple apparatus: a light comes on and you press a button. In the simple reaction time version there is one light and one button. In choice reaction time there are several lights and you must press the matching button.

  • Simple reaction time correlates with IQ only weakly — typically around -0.2 (negative because faster means a lower time and a higher score).
  • Choice reaction time correlates more strongly, and the correlation rises as the number of alternatives rises.
  • Variability in reaction time — how inconsistent someone is across trials — often predicts IQ better than their average speed does.

That last point is the interesting one and it is frequently overlooked. Being reliably quick appears to matter more than being occasionally very quick. Reviews of this literature generally place single-task correlations in the low-to-moderate range, with higher values when several speed measures are combined into a composite rather than used one at a time.

Inspection time

A related paradigm removes the motor response entirely. In an inspection time task, two lines of different lengths flash on screen for a very brief interval and you say which was longer. There is no speed of response involved — you can take as long as you like to answer — only how brief a display you can still make sense of. Meta-analyses of this task have reported associations with IQ around -0.5 once corrections for measurement error and restricted range are applied, making it one of the stronger elementary correlates of general ability.

Where speed sits on a professional test

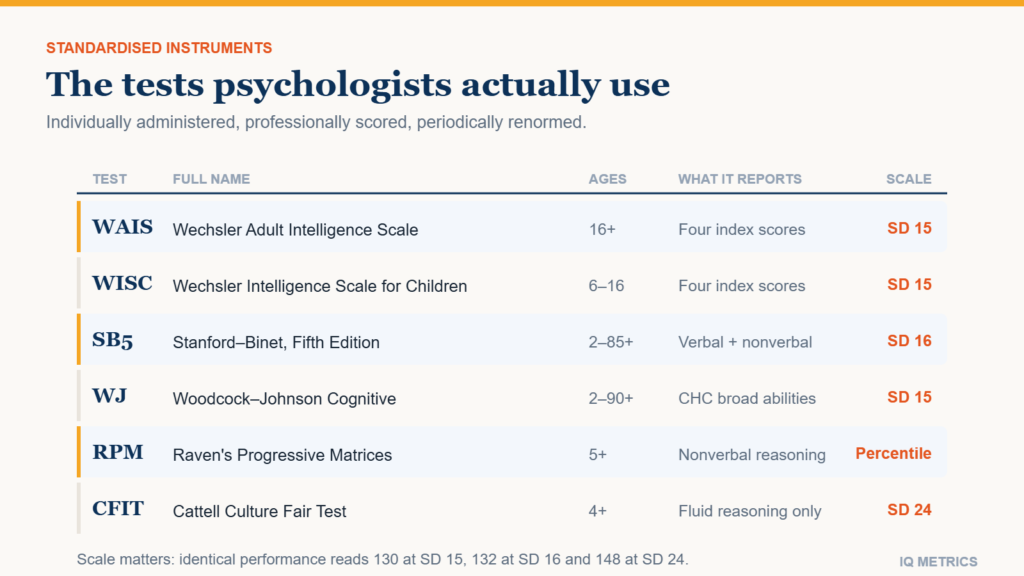
On the Wechsler batteries described in our guide to professional IQ tests, processing speed is one of the four or five index scores that feed the Full Scale IQ. It is measured with tasks like Coding (matching symbols to digits against the clock) and Symbol Search (scanning for a target shape).

Two facts about that index are worth knowing before you read a report:

  • It is usually the least g-loaded of the indices. Verbal comprehension and fluid or perceptual reasoning carry far more of the general factor than speed does.
  • It is the most easily disturbed. Fatigue, anxiety, medication, motor difficulty, vision and simple unfamiliarity with a pencil task all push it down without touching reasoning ability.

That combination is exactly why psychologists sometimes report the General Ability Index alongside the Full Scale IQ — a composite that leaves working memory and processing speed out. If a report in front of you shows one, our guide to reading an IQ test report explains when that substitution is appropriate.

Diagram showing where processing speed sits in the structure of cognitive ability

Why online tests time you

Almost every online test imposes a limit, and the reason is psychometric rather than dramatic. Without one, reasoning items stop discriminating: given unlimited time, a large majority of test-takers eventually solve a mid-difficulty matrix, so the item no longer separates anyone from anyone. A time limit keeps the difficulty spread usable across the whole range.

The cost is that a timed score blends two things — how well you reason and how fast you work — and different people pay that cost differently. Someone accurate but deliberate loses points that someone quick and careless does not. This is why our timed IQ test is presented separately from the untimed formats in the test hub: they are answering slightly different questions about you.

It is also why speed-accuracy tradeoff advice is not a trick. Working slightly faster than feels comfortable usually helps on a timed test, up to the point where errors start climbing. Our guide to preparing for an IQ test covers where that point tends to sit.

Your own number

Where would your own score land?

Take the IIF-certified assessment and get your score with the scale it was measured on, the percentile it corresponds to and the confidence range around it — the three figures most online tests leave out.

Find your IQ score now!

Secure & encryptedInstant results10–20 minutes

Can you train processing speed?

You can improve the score, and that is not the same as improving the ability. Coding-type tasks respond strongly to practice: do one twice and the second attempt is faster, because you have learned the symbol pairings rather than because you now process information more quickly. This is one reason retesting on the same battery too soon inflates a result, as we cover in the practice effect on ability tests.

The best evidence on deliberate speed training comes from large randomised trials in older adults, where speed-of-processing training produced substantial and durable improvement on the trained tasks. What it produced on untrained abilities is far more disputed, and the broader claims made for that work have been challenged repeatedly. The pattern matches the training literature generally — near transfer is well supported, far transfer is not — which is the same conclusion our page on improving your IQ reaches.

A more useful distinction is between things that raise your speed and things that were suppressing it. Sleep debt, illness, anxiety and unfamiliarity with the response format all depress measured speed without touching capacity, which is the mechanism behind test anxiety and IQ scores. Removing them recovers what was already yours; none of them make you faster than your own baseline.

Speed and ageing: the clearest real-world case

Processing speed is the single most age-sensitive part of cognition. It begins declining in early adulthood and continues steadily, and Timothy Salthouse’s influential processing-speed theory argues that much of the apparent age-related decline in reasoning and memory is a downstream consequence of that slowing rather than an independent loss.

Two mechanisms are usually proposed: when operations are slow, early results decay before later ones finish, and fewer operations fit into the available window. Statistically, controlling for speed accounts for a substantial share of the age effect on other abilities — though “accounts for” in a statistical model is not the same as “causes”, and this remains debated.

Because age-normed IQ compares you with people your own age, none of this shows up on a reported score. The number stays flat while the underlying speed changes, which our page on IQ and age charts directly.

Does thinking fast mean thinking well?

Not reliably, no. Speed is one contributor to a score among several, it is the weakest of the index-level contributors, and the deliberate-and-accurate profile is common among high scorers. Worth separating clearly:

  • Speed of elementary processing — reaction and inspection time — is modestly related to general ability and is not something you can train up meaningfully.
  • Speed on a clerical task — the WAIS speed index — is only loosely related to reasoning and is easily depressed by things that have nothing to do with intelligence.
  • Speed of judgement — answering fast in conversation or in a meeting — is barely studied, closer to a personality trait, and is often the opposite of good thinking. That is the theme of why smart people make bad decisions.

If you want to see how the two behave for you specifically, take our free IQ test once under its normal limit and note where you were rushed. The gap between what you answered and what you could have answered is your own speed contribution, and it is usually smaller than people fear.

Share this article

Know someone who keeps seeing these numbers quoted without the scale they were measured on? Send it to them.

Does School Raise IQ?

Research & Evidence

Does School Raise IQ? What Natural Experiments Show

Education is the environmental factor with the strongest evidence for actually raising IQ scores, and the effect is bigger than most people expect. Three independent study designs, pooled across more than 600,000 participants, point the same way. Here is the size of it, and the caveat that gets dropped.

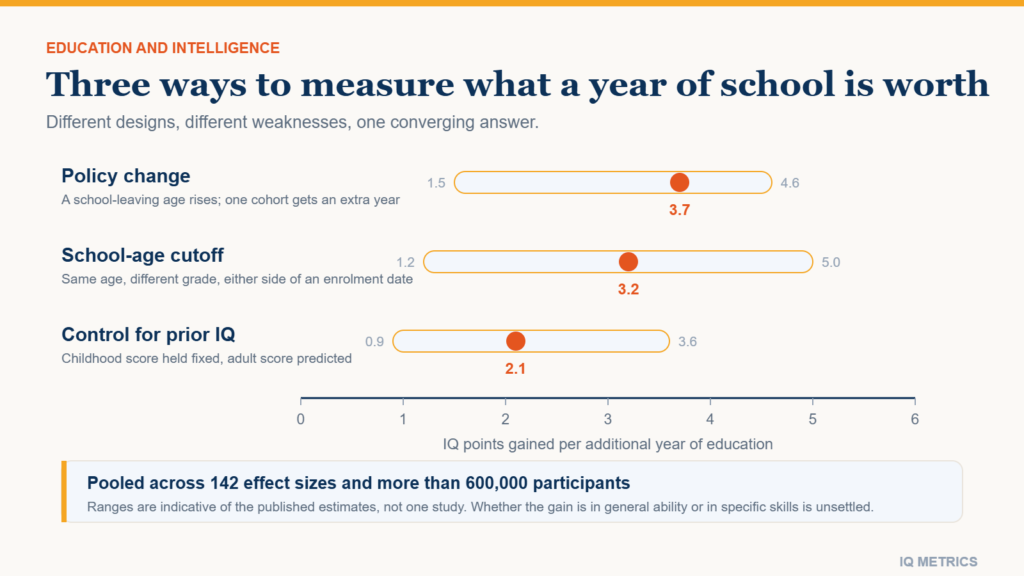
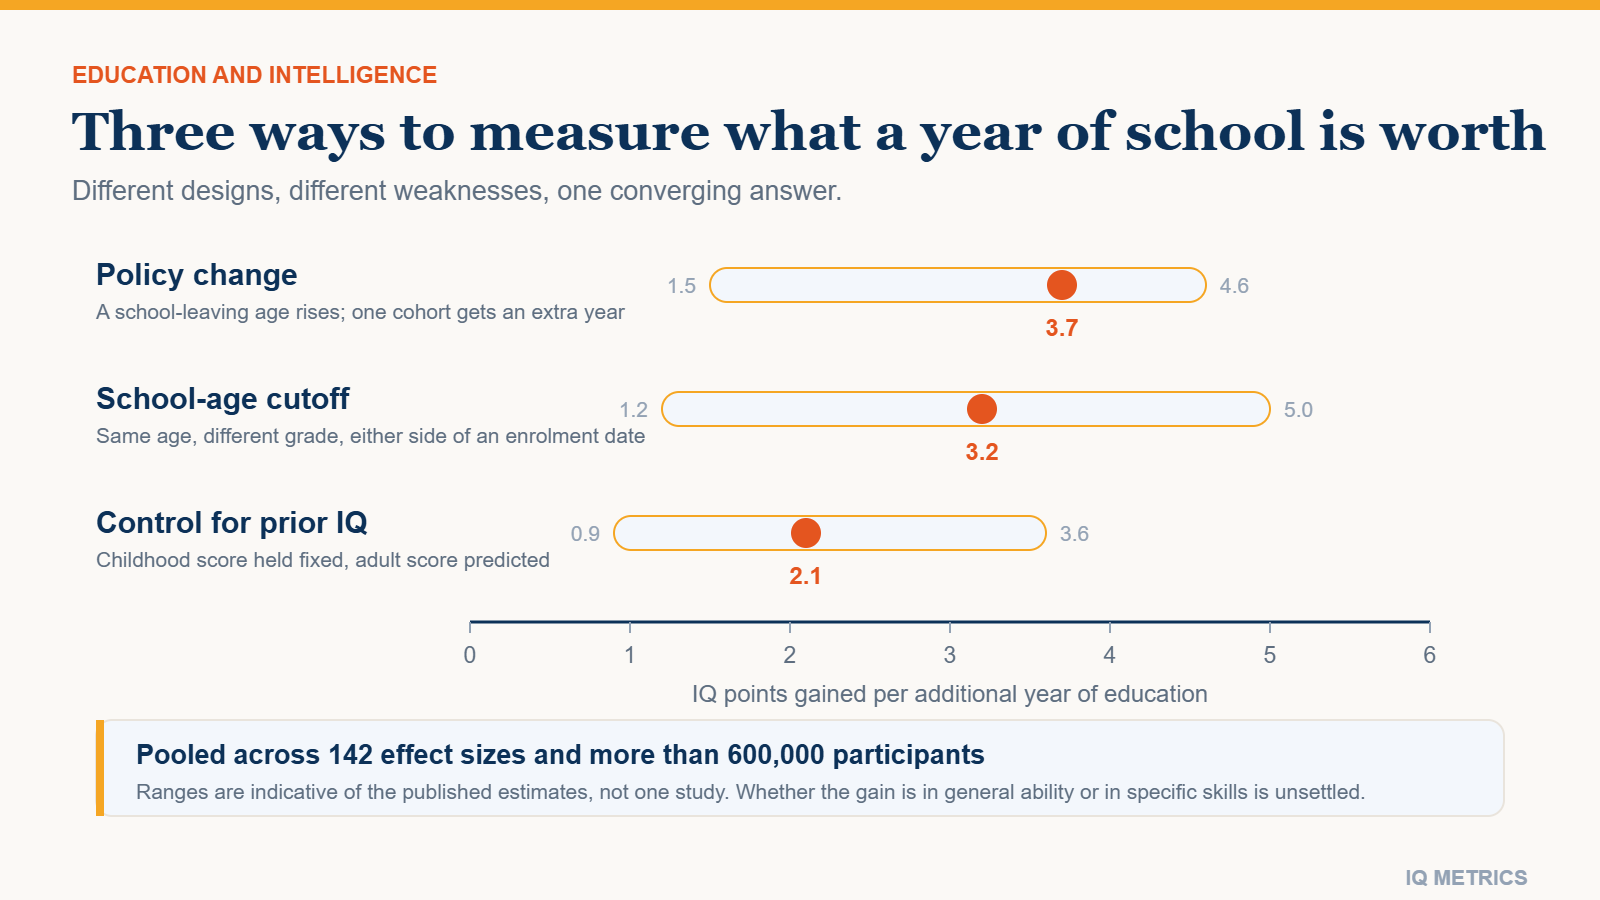
Chart showing the three natural-experiment designs used to estimate the effect of schooling on IQ (policy change, school-age cutoff and control for earlier intelligence), each yielding an estimated gain of roughly one to five IQ points per additional year of education

Yes — school raises IQ scores, and the effect is one of the largest and best-identified in the whole environmental literature. The best current estimate comes from a 2018 meta-analysis by Stuart Ritchie and Elliot Tucker-Drob, which pooled 142 effect sizes from over 600,000 participants and found that each additional year of education is associated with a gain of roughly one to five IQ points, with a central estimate of a little over three.

That is a serious number. It is comparable to the gap between the middle of the average band and its upper edge, and it appears to persist rather than fading out in the years after schooling ends. But there is a real caveat about what is being raised, and it does not get repeated nearly often enough. Both halves are below.

Why this question is hard to answer

The obvious problem is that people who stay in education longer were already scoring higher before they got there. Any raw correlation between years of schooling and adult IQ is therefore uninterpretable on its own: it could be schooling raising ability, ability raising schooling, or a third factor driving both. This is the mirror image of the question we cover in whether IQ predicts school success, and the two run in opposite directions.

What makes the modern evidence credible is that researchers stopped relying on correlations and started using natural experiments — situations where something other than the student decided how much schooling they got. Ritchie and Tucker-Drob organised the literature around three such designs:

  • Policy change. A country raises its school-leaving age, so one birth cohort gets an extra compulsory year and the cohort just before it does not. Nothing about the students themselves differs systematically.
  • School-age cutoff. Children born days either side of an enrolment cutoff are the same age when tested but have had a full extra year of school. Age is held constant while schooling varies.
  • Control for earlier intelligence. Take a measured IQ in childhood, then predict adult IQ from years of education while holding the earlier score fixed.

The three designs have completely different weaknesses. That they converge on a similar answer is the reason the finding is taken seriously.

What the natural experiments found

The compulsory schooling studies are the cleanest. A well-known analysis of a Norwegian reform, which added two years to compulsory education and rolled out across municipalities at different times, estimated a gain of roughly 3.7 IQ points per additional year on the military conscription test taken at around age 19. Because the reform arrived at different times in different places, the comparison is close to a clean experiment.

The cutoff studies attack the problem from the other end. A classic Israeli study by Cahan and Cohen compared children within the same grade who differed in age with children of the same age who differed in grade, and found that a year of schooling contributed substantially more to test performance than a year of simply getting older. Later work using the same logic in other countries reached compatible conclusions.

Chart of the three natural-experiment designs used to estimate the effect of schooling on IQ

The third design is the weakest of the three but the easiest to run at scale: measure intelligence in childhood, measure it again in adulthood, and ask whether years of education in between predict the adult score once the childhood one is held fixed. It cannot rule out every confound — motivation and family circumstances still differ — but it removes the largest one, and it produced estimates in the same broad range as the other two.

Perhaps the most striking part of the meta-analysis is that the gains did not appear to fade with age. Educational interventions in early childhood have a well-documented fadeout problem — initial score gains shrink over the following years. The schooling effect on adult IQ did not show that pattern in this analysis, which is what makes it unusual.

The caveat: raising scores is not the same as raising g

Here is the part that gets dropped in most summaries. There is good evidence that education raises performance on specific cognitive tests without raising the general factor those tests share. Ritchie, Bates and Deary examined this directly using a Scottish sample with childhood and later-life testing, and found education’s effect concentrated on individual test scores rather than on the underlying general ability that all the tests load on.

In practice that means the honest claim is narrower than the headline. More schooling reliably makes you better at the kinds of tasks tests use — vocabulary, arithmetic, structured reasoning, sustained attention under instruction. Whether it increases some deeper general capacity is genuinely unsettled, and anyone who tells you it is settled in either direction is ahead of the data. Our page on how IQ tests work explains why the distinction between a test score and the general factor matters so much here.

It is worth adding that this is not a debunking. For nearly every practical purpose — qualifications, employment, the day-to-day cognitive demands of adult life — being better at the tasks is what people actually want. The distinction matters for the theory, not usually for the decision.

Your own number

Where would your own score land?

Take the IIF-certified assessment and get your score with the scale it was measured on, the percentile it corresponds to and the confidence range around it — the three figures most online tests leave out.

Find your IQ score now!

Secure & encryptedInstant results10–20 minutes

Why early-years gains fade but schooling gains do not

There is an apparent contradiction here worth resolving, because it is the most common objection to the whole finding. Intensive early-childhood programmes — the Perry Preschool and Abecedarian projects are the famous examples — reliably produce large IQ gains that then shrink substantially within a few years of school entry. Fadeout of that kind is one of the most replicated results in the education literature. So why would schooling itself behave differently?

The most persuasive reading, argued in John Protzko’s work on fadeout, is that cognitive gains persist roughly as long as the environmental input producing them persists, and decay once it stops. On that account a two-year preschool programme followed by nothing in particular is expected to fade. A decade of compulsory schooling is not a brief intervention at all — it is a sustained one, and the measurement usually happens while it is still running or shortly after it ends.

  • Short and intense tends to produce a large gain that shrinks — the classic fadeout curve.
  • Long and sustained tends to produce a smaller annual gain that accumulates and holds.
  • The outcome measured matters. Several programmes whose IQ advantage faded still showed durable effects on attainment, employment and earnings decades later.

This is an explanation that fits the data rather than a demonstrated mechanism, and it should be held loosely. But it does mean the two literatures are not in conflict, and it points at something useful: continuity of cognitive demand looks more valuable than intensity in a short burst.

How this fits with the heritability evidence

People often read a large schooling effect as evidence against a genetic contribution to intelligence, or the reverse. Neither follows. Heritability is a statistic about the sources of variation in a particular population at a particular time; it places no ceiling on how much an environmental change can move the average. Our article on whether IQ is genetic works through why a high heritability estimate and a large schooling effect are entirely compatible.

The clearest illustration is historical. Average scores rose substantially across the twentieth century in dozens of countries — far too fast for genetic change to be involved — over exactly the period in which mass secondary education spread. Schooling is not the only candidate explanation for that rise, but it is among the strongest.

What this means for you

  • If you are still studying: the effect is real and the evidence is unusually good. Staying in education longer is one of very few things with credible causal support behind it.
  • If you are past school age: the same logic suggests sustained, structured cognitive demand matters more than brief training. The evidence for short puzzle-app regimes is much weaker, which is what our page on improving your IQ covers.
  • If you are interpreting a score: a test measures you as you are now, education included. That is a feature. See how to read an IQ test report for what each number on a report actually represents.

If you want a current benchmark before drawing any conclusions, our free online IQ test scores against age-adjusted norms and takes about twenty minutes. The result will reflect everything that got you here — genetics, health, and quite a lot of schooling.

Share this article

Know someone who keeps seeing these numbers quoted without the scale they were measured on? Send it to them.