IQ Metrics
IIF Certified Assessment Start IQ Test
IIF Certified Assessment

Breastfeeding and IQ

Research & Evidence

Breastfeeding and IQ: What the Only Randomized Trial Found

The largest randomized trial ever run on breastfeeding found a genuine IQ advantage at age six — about six points on full-scale IQ. By age sixteen, the gap on most measures had shrunk close to zero. Here is what the trial actually measured, and why it still beats every observational study that came before it.

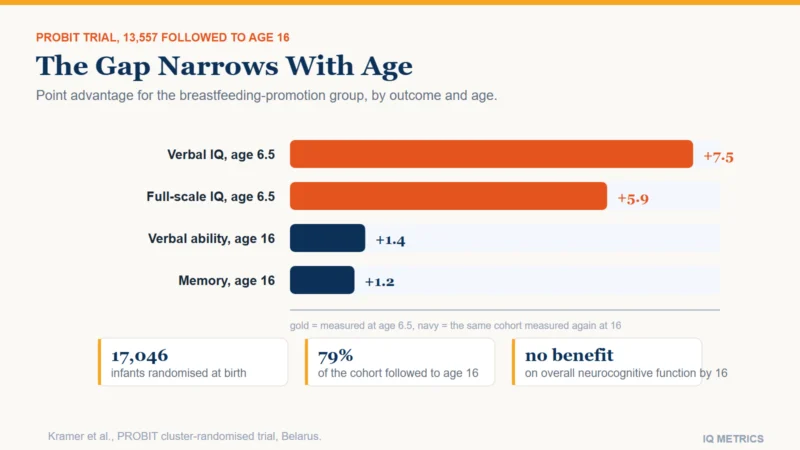
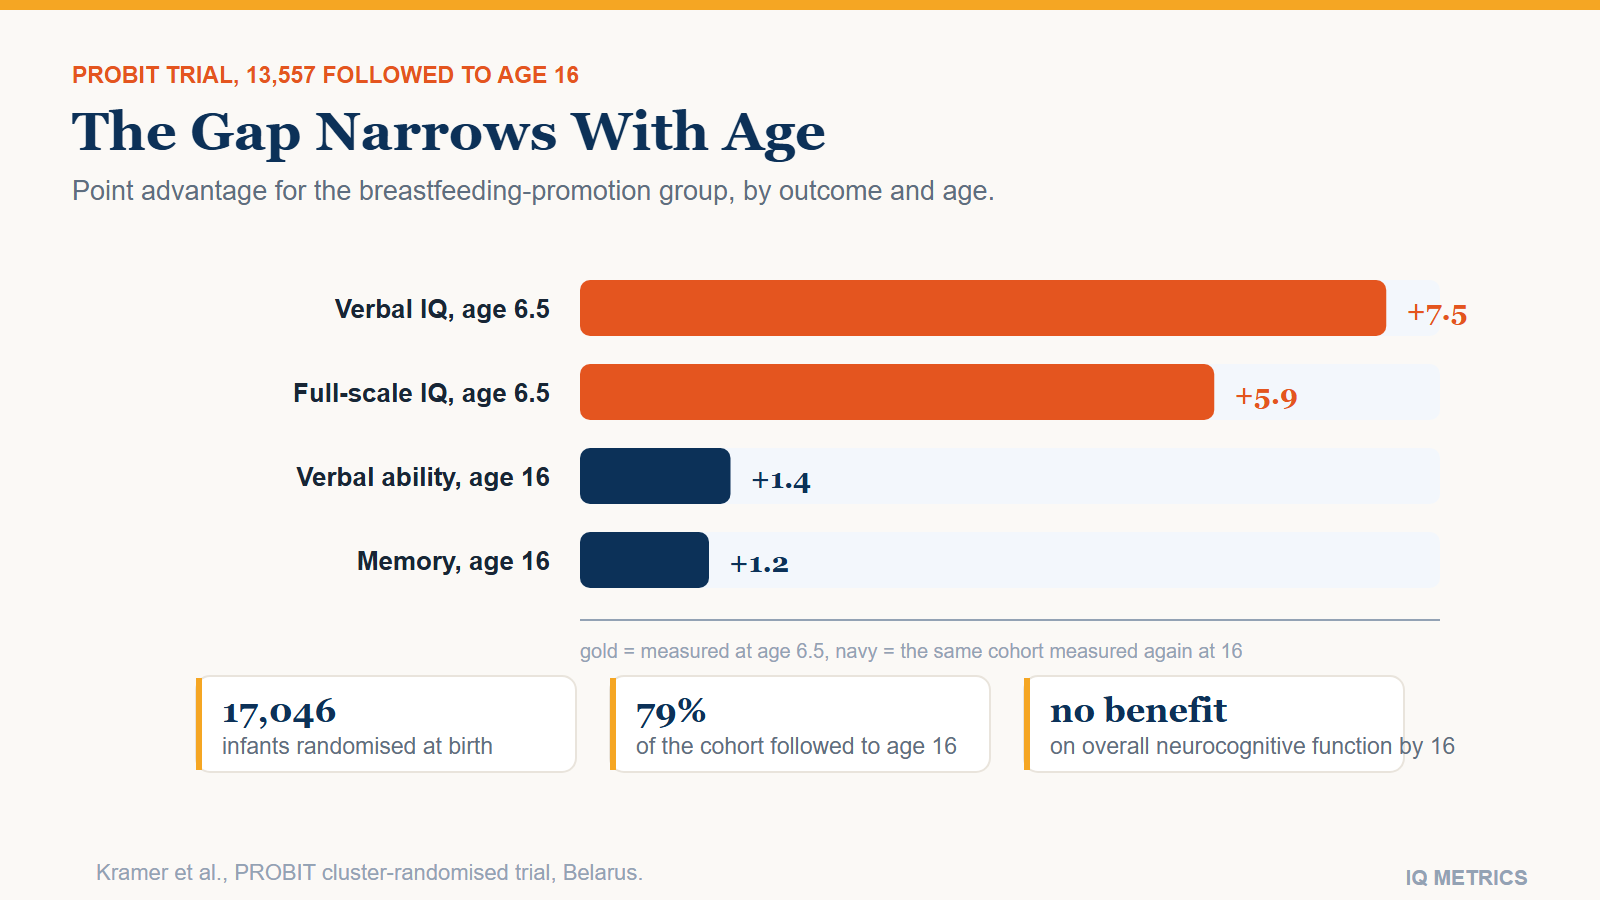
Bar chart showing the breastfeeding-promotion group's IQ advantage shrinking from 7.5 points in verbal IQ and 5.9 points in full-scale IQ at age 6.5 to 1.4 and 1.2 points by age 16, from the PROBIT randomized trial

A little, and mostly early. The best evidence comes from a single randomized trial in Belarus that followed 17,046 infants from birth: at age 6.5 the breastfeeding-promotion group scored about 6 points higher on full-scale IQ and 7.5 points higher on verbal IQ. By age 16, most of that gap had narrowed to somewhere between nothing and a point and a half, depending which measure you look at.

That shrinking pattern is not a flaw in the study. It is the most informative part of it, and it is the reason this article leads with a single randomized trial most people have never heard of, rather than the much larger pile of observational studies on breastfeeding and IQ that came before it and that this trial was specifically designed to improve on.

Why this question needed a randomized trial

You cannot ethically assign babies to be breastfed or formula-fed, so almost every study on this topic before the 1990s was observational: researchers compared children whose mothers happened to breastfeed against children whose mothers happened not to, and measured IQ later. The problem is obvious once you say it plainly — mothers who breastfeed for longer tend, on average, to have more education, higher incomes and higher IQ scores themselves, all of which independently predict a child’s IQ. An observational study cannot cleanly separate "breastfeeding raised this child’s IQ" from "the kind of mother who breastfeeds also tends to have a smarter child regardless."

This is not a small confound to wave away. Maternal education and IQ are among the strongest known predictors of a child’s own IQ, and breastfeeding rates and duration both rise steeply with maternal education across almost every population they have been measured in. An observational study that does not fully strip that relationship back out is, in effect, partly measuring maternal IQ and reporting it as a breastfeeding effect.

The Promotion of Breastfeeding Intervention Trial (PROBIT) solved this the only ethical way available: it randomized the promotion, not the milk. Thirty-one maternity hospitals and clinics across Belarus were randomly assigned to either adopt the WHO/UNICEF Baby-Friendly Hospital practices, which substantially raise breastfeeding rates and duration, or continue standard care. Every mother still chose how she fed her own child. What the randomization controls for is everything else — the assigned hospitals and the control hospitals started with comparable populations, so any later difference in child outcomes is attributable to the intervention rather than to who chooses to breastfeed.

Concretely, the Baby-Friendly practices the intervention hospitals adopted included skin-to-skin contact and starting breastfeeding within an hour of birth, "rooming in" so infants stayed with their mothers rather than in a separate nursery, staff trained to help with common breastfeeding problems, and a shift away from routinely offering formula supplements without a medical reason. None of that is exotic or experimental — it is closer to ordinary good hospital practice today than it was in Belarus in the mid-1990s, which is part of why the trial could move breastfeeding rates by enough to detect an effect at all: infants at the intervention hospitals were breastfed more, and for longer, than infants at the control hospitals, even though no individual mother was assigned anything.

What the trial found at age 6

At the 6.5-year follow-up, children from the breastfeeding-promotion hospitals scored 7.5 points higher on verbal IQ (a real, statistically significant gap) and 5.9 points higher on full-scale IQ. The full-scale figure is worth a caveat the trial’s own authors flagged: its confidence interval technically touched zero, meaning it sits right at the edge of conventional statistical significance rather than comfortably past it. Performance IQ — the non-verbal half of the test — showed a smaller, clearly non-significant 2.9-point difference. Verbal ability carried almost the entire effect.

Bar chart showing the breastfeeding-promotion group's IQ advantage shrinking from 7.5 points in verbal IQ and 5.9 points in full-scale IQ at age 6.5 to 1.4 and 1.2 points by age 16, from the PROBIT randomized trial
Bar chart showing the breastfeeding-promotion group’s IQ advantage shrinking from 7.5 points in verbal IQ and 5.9 points in full-scale IQ at age 6.5 to 1.4 and 1.2 points by age 16, from the PROBIT randomized trial

The gap by adolescence

The same cohort was tracked down again at age 16 — 13,557 of the original 17,046 children, a 79.5 percent retention rate that is unusually high for a 16-year follow-up and a real strength of the trial. The headline result: "no benefit of a breastfeeding promotion intervention on overall neurocognitive function was observed." Two narrower measures still showed a small, statistically real gap — verbal function (+1.4 points) and memory (+1.2 points) — but both were well under a fifth the size of the verbal advantage measured a decade earlier.

A shrinking effect with age is exactly what you would expect if breastfeeding gives verbal development an early nudge that schooling, reading and everyday language exposure gradually swamp for everyone, breastfed or not. It is a considerably less dramatic story than the age-6.5 numbers alone would suggest, and a more honest one.

Your own number

Where would your own score land?

Take the IIF-certified assessment and get your score with the scale it was measured on, the percentile it corresponds to and the confidence range around it — the three figures most online tests leave out.

Find your IQ score now! →

Secure & encryptedInstant results10–20 minutes

Why a trial beats the studies it replaced

Here is the part that is easy to miss: PROBIT’s effect sizes are noticeably smaller than what many older observational studies reported, and that is a feature of the trial, not a weakness. Those larger observational estimates were almost certainly inflated by exactly the confound described above — maternal IQ and socioeconomic status riding along with the decision to breastfeed. When you randomize away that confound, the honest effect is real but modest, concentrated in verbal ability, and fades with age. That is a less exciting headline than "breastfeeding raises IQ by X points," and it is also much more likely to be true.

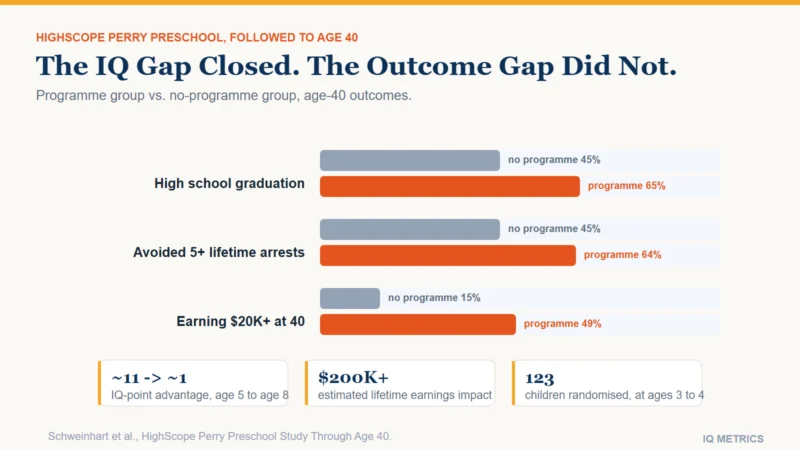
This same pattern — an early, measurable gap that narrows well before adulthood — shows up again in what randomized early-childhood programmes actually do to IQ scores, for a related but not identical reason: there, the IQ gap itself closes almost completely, while other outcomes that have nothing to do with an IQ number keep a real gap open for decades.

What might explain a real, if modest, effect

The leading biological candidate is the long-chain polyunsaturated fatty acids naturally present in breast milk — DHA in particular, which is a structural component of neural tissue and is added to many infant formulas precisely because of this hypothesis. Duration and exclusivity of breastfeeding also appear to matter in the literature more broadly, which is consistent with a dose-response biological mechanism rather than a purely social one. A competing, non-exclusive explanation is simply more one-on-one verbal interaction during feeding — breastfeeding sessions take longer than bottle-feeding on average, and the verbal advantage found in the trial, concentrated as it was rather than spread evenly across every cognitive domain, is at least as consistent with more talking and eye contact in infancy as it is with a nutrient in the milk itself. Neither explanation is settled with the same confidence as the trial’s headline numbers; both are plausible mechanisms behind them, not independently proven ones, and the trial itself was not designed to distinguish between them.

What this does not mean for any individual family

A population-average difference of a few IQ points, most of which narrows by adolescence, says essentially nothing about any single child. Formula-fed children are not destined toward a lower score — genetics, home language environment, broader nutrition and schooling all move the needle by more than this effect does, and countless people who were formula-fed as infants score well above average by any measure. A few IQ points at the population level, most of which narrows within a decade, is the kind of effect that shows up reliably only when you average across thousands of children — it disappears into the ordinary noise of one particular kid’s life, alongside sleep, illness, the specific school they attend and simple test-day variation. Breastfeeding also carries other, better-established maternal and infant health benefits that have nothing to do with IQ and are outside the scope of this article. If you are curious where your own score sits on a standard scale rather than a research statistic, the age-by-age IQ scale is the place to start.

Share this article

Know someone who keeps seeing these numbers quoted without the scale they were measured on? Send it to them.

Tagged breastfeeding, causal evidence, child iq, cognitive development, early childhood development, infant feeding, infant nutrition, intelligence research, IQ Science, longitudinal study, nature versus nurture, PROBIT trial, randomized controlled trial, Verbal IQ

IQ Score Ceiling Effects

Scores & Scales

Why No IQ Test Can Reliably Score You Above 160

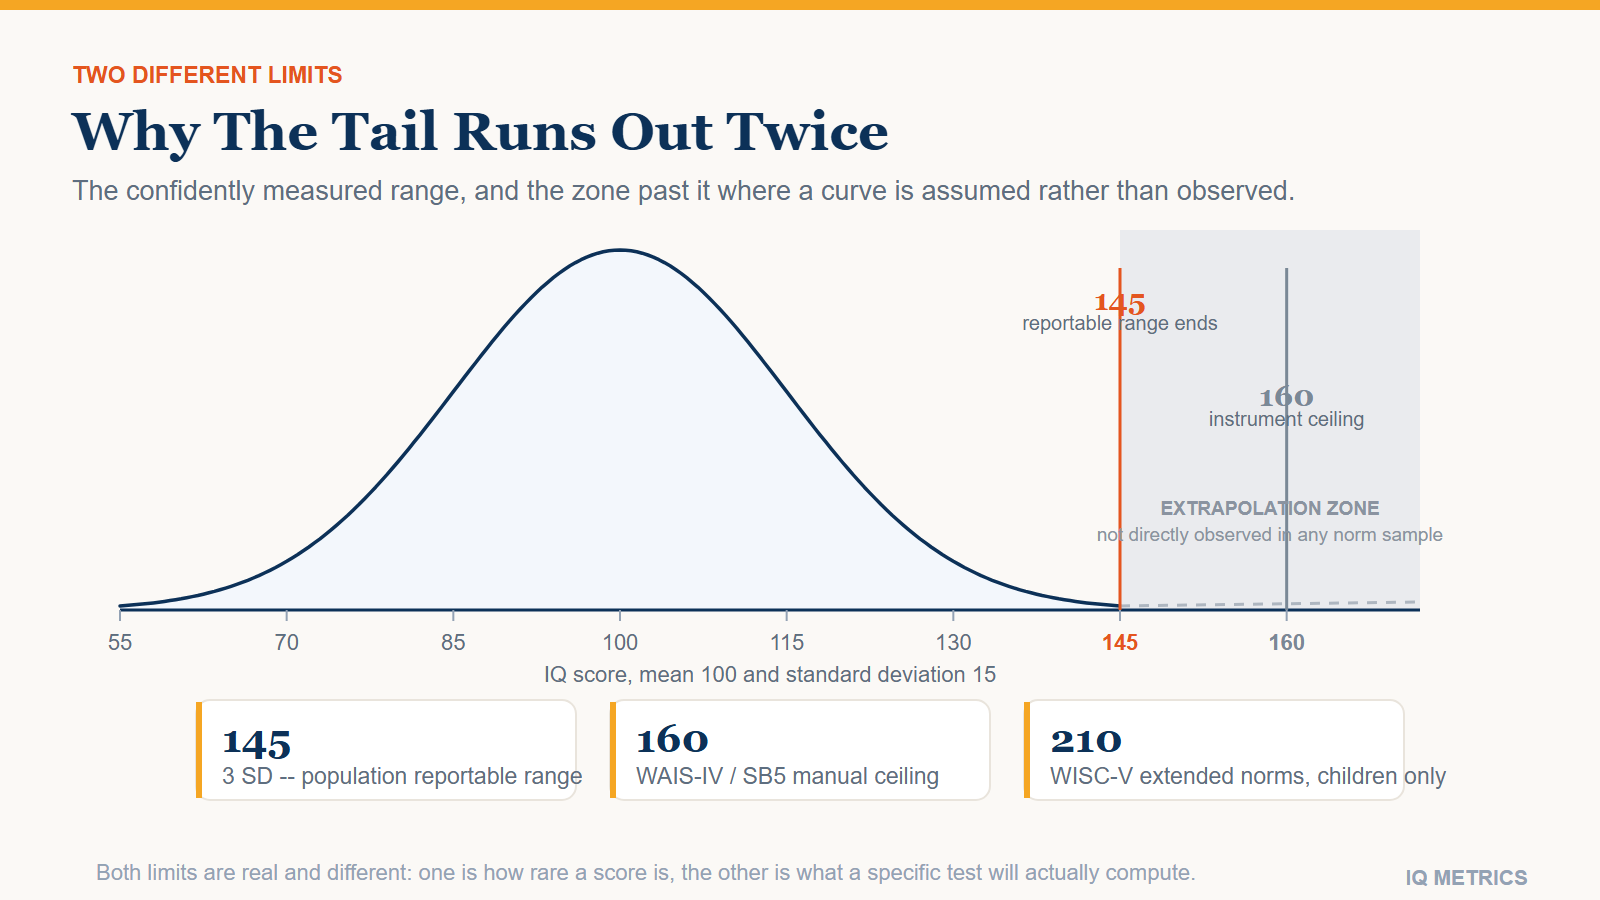
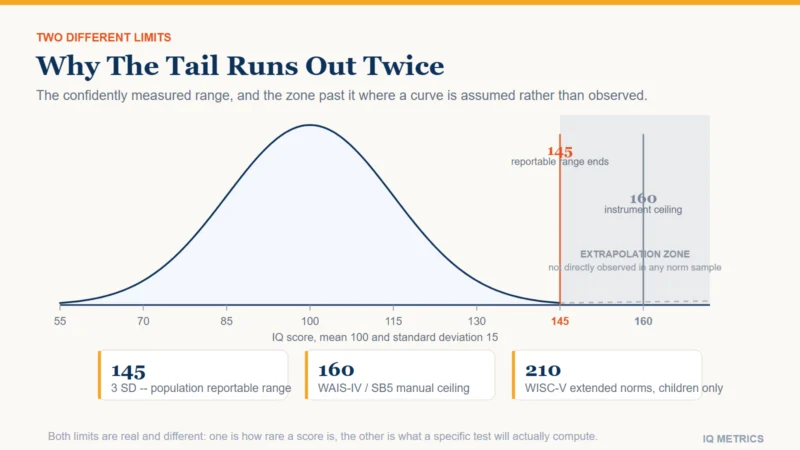
Two different numbers get used as "the top of the scale," 145 and 160, and they come from two different kinds of limit. One is a statement about population statistics; the other is about what a specific test manual will actually compute.

Bell curve chart of IQ scores with the population marked at 145, the three standard deviation boundary, and 160, the typical test ceiling, with the extrapolation zone beyond both shaded

No current IQ test can reliably score you above roughly 160, and the reasons split into two genuinely different limits that get conflated constantly. One is a statistical fact about how rare extreme scores are in any real population; the other is a mechanical fact about what a specific test’s norm tables will actually compute, regardless of population size. Knowing which one you are looking at changes what a very high number on a report should be taken to mean.

This site’s own breakdown of the IQ bell curve already states the first limit plainly: the reportable range runs out around 145, and anything past it is described there as extrapolation. What follows is the mechanism behind that statement, the second, different limit sitting behind the number 160, and how the two relate.

Two different numbers, two different reasons

145 is a population-statistics boundary. On the standard deviation-15 scale, 145 sits three standard deviations above the mean, the point past which roughly 99.7% of the population has already been accounted for. Above it, an individual score corresponds to a rarity — on the order of one person in several hundred to several thousand, and the exact percentile assigned that far out depends heavily on the precise shape assumed for the tail of the distribution, which nobody has ever measured directly because there are not enough extremely rare people in any single standardisation sample to measure it from.

Bell curve chart of IQ scores with the population marked at 145, the three standard deviation boundary, and 160, the typical test ceiling, with the extrapolation zone beyond both shaded

160 is a different kind of limit entirely: an instrument ceiling. The WAIS-IV and the Stanford-Binet Fifth Edition, the two most widely used individually administered tests, both cap their standard Full Scale IQ near 160, and their manuals provide no calculation at all for a raw score above the test’s hardest items. That is not a statement about the population; it is a statement about the test. Even a hypothetical person far more capable than anyone in the norm sample would still top out at the same number, because the test simply runs out of harder questions to ask them.

Why sample size is the real constraint

A standardisation sample for a major test typically runs into the low thousands of people, carefully balanced for age, sex and other demographics so that the middle of the distribution is measured with real precision. That is more than enough people to pin down what “average” looks like, and plenty to characterise the range most test-takers actually fall into. It is nowhere near enough to characterise a score that only one person in several thousand reaches. A norm sample of 2,000 people would be expected to contain zero individuals at the rarity a 160 implies under a normal distribution, which means the test cannot empirically verify what that end of the scale should look like — it can only extrapolate the shape of the curve outward from where it actually has data, and trust that the distribution keeps behaving the way the model assumes.

Why the manual just stops

Every subtest on a modern IQ test has a fixed set of items ordered roughly by difficulty. A test-taker who answers every item correctly, including the hardest ones, has hit what psychometricians call a ceiling effect: the test cannot distinguish that person from someone hypothetically even more capable, because there was nothing harder left to ask. The raw score still converts to a scaled score through the norm tables, but that scaled score is capped at whatever the hardest available item supports — it cannot extrapolate past the edge of what the test actually measured.

This also means the reliability of a score is not constant across the range. The standard error of measurement — the margin of uncertainty around any reported score — is smallest near the middle of the distribution, where the norm sample is largest and the item set is best calibrated, and grows toward both tails. A reported 160 carries a substantially wider confidence interval than a reported 100, even though both are presented as single, clean numbers on a report.

Your own number

Where would your own score land?

Take the IIF-certified assessment and get your score with the scale it was measured on, the percentile it corresponds to and the confidence range around it — the three figures most online tests leave out.

Find your IQ score now! →

Secure & encryptedInstant results10–20 minutes

Extended norms: the workaround, and its limits

Test publishers have addressed the ceiling problem for specific instruments through extended norms — not simply adding harder questions, but statistically remodelling the upper end of the scale using a separately recruited, targeted sample of unusually high-ability test-takers combined with the standard norm group. Pearson’s WISC-V Extended Norms is the clearest example, statistically extending the reportable composite range up to a Full Scale IQ of 210. That extension applies to the WISC-V, a children’s instrument — not to the adult WAIS-IV, which as of today still stops at its standard ceiling in ordinary clinical use.

Extended norms are a real statistical solution, not a workaround in the dismissive sense, but they only exist where a publisher has invested in building them for a specific test. A report from an instrument without an extended-norm supplement will still simply stop at its ordinary ceiling, and a clinician working with a potentially profoundly gifted child needs to know, ahead of time, which instrument actually has the extended tables built for it.

What "off the charts" should make you skeptical of

Outside a clinical setting, a claimed score comfortably above 160 is one of the more reliable signs that a result did not come from a properly normed, ceiling-aware instrument. A short online quiz built for a general audience is normed, if it is normed at all, against a sample built to characterise ordinary scores accurately, not the extreme right tail, so a headline result of “175” or higher from that kind of test is telling you more about the scoring formula than about the test-taker. The same caution applies in reverse to a very low reported score from an untested source: the further either end of the scale you look, the more the specific instrument and its norm sample matter, and the less a bare number can be trusted on its own.

Where the very high numbers in circulation come from

Numbers like “228,” which have circulated in reference books and media coverage of certain public figures for decades, do not come from any test administration capable of producing them — no standardised instrument has ever reported a score in that range, for exactly the ceiling reasons described above. Figures like that originate from retrospective estimation methods applied to historical biographical material — childhood achievements, ages at which milestones were reached — run through a formula, not from a person sitting a test with a documented ceiling anywhere near that high. It is one of a handful of durable public misunderstandings about intelligence testing covered in more detail in our piece on brain myths.

What a high-range report should actually say

In practice, psychologists assessing a potentially profoundly gifted child or adult choose instruments specifically for their documented upper range rather than assuming any test will do, and a competent report will say plainly when a score has hit a ceiling rather than presenting a capped number as a precise measurement. High-IQ societies with unusually demanding thresholds handle this the same way: they specify which tests and which scores they accept, generally requiring supervised administration of an instrument with documented norms at that level, rather than accepting any test’s raw maximum at face value. It is a stricter version of the same principle behind Mensa’s own admission requirements and ordinary gifted-programme cutoffs: the number only means what it claims to mean when the instrument behind it is named.

And because scores this extreme are rare enough that two very high-scoring parents do not straightforwardly produce a child at the same extreme, a single very high number — a child’s, an adult’s, or a historical figure’s — is almost always better read as “very high, with real uncertainty about exactly how high” than as a precise point on an infinite scale. If you want your own number, on an instrument with known, stated limits, a properly normed test is where to start; for how the ordinary part of the scale works, the score converter and the full range breakdown cover everything below the ceiling this article is about.

Share this article

Know someone who keeps seeing these numbers quoted without the scale they were measured on? Send it to them.

Tagged ceiling effect, confidence interval, extended norms, full scale iq, iq ceiling effect, IQ Test Range, Measurement Error, mensa, Norm Group, profoundly gifted, standard deviation iq, wechsler adult intelligence scale

Chess Ratings and IQ

Research & Evidence

What Chess Ratings Actually Say About IQ

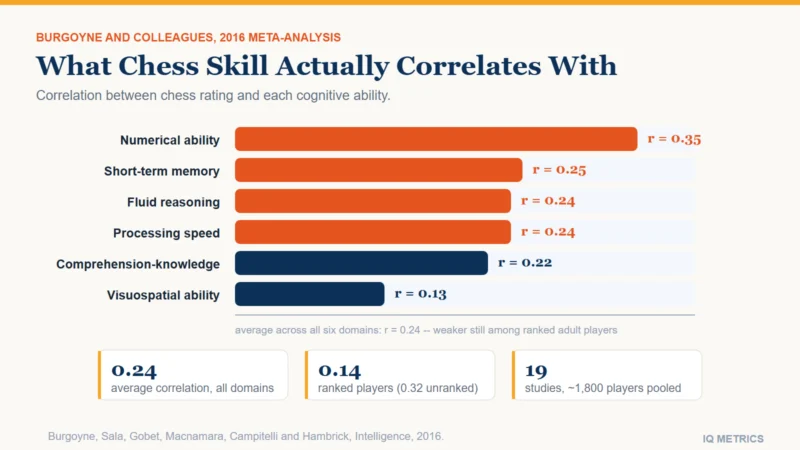
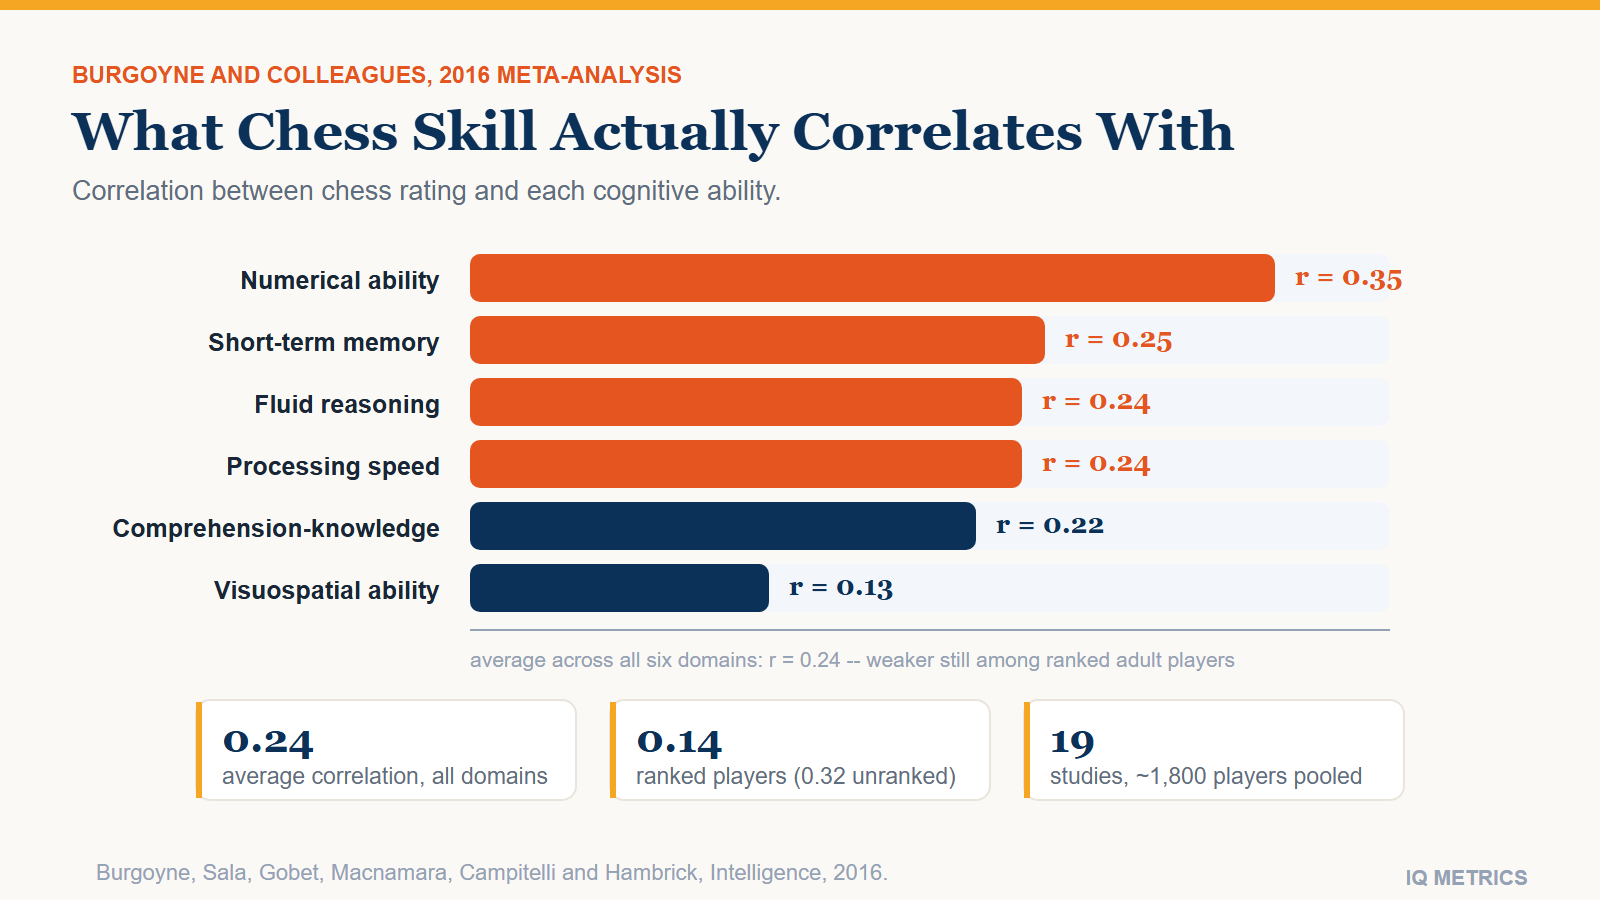
Chess has a reputation as a proxy for raw intelligence. The best available meta-analysis puts the real correlation at a modest 0.24, and it gets noticeably weaker once you look only at ranked, adult tournament players.

Bar chart of correlations between chess skill and six cognitive abilities from a meta-analysis, ranging from 0.35 for numerical ability down to 0.13 for visuospatial ability

Weaker than the reputation suggests, and weaker still among serious players. The most comprehensive meta-analysis on the question, pooling 19 studies and roughly 1,800 participants across multiple countries and age groups, found chess skill correlates with cognitive ability at an average of 0.24 — a real, statistically reliable relationship, but a modest one, and nowhere near strong enough to treat a rating as a stand-in for an IQ score.

The more interesting finding here is not really the headline number at all. It is what happens to that number once you stop looking at chess players in general and start looking only at the players who take rating and ranking seriously.

What the best evidence actually found

The studies pooled into this meta-analysis measured chess skill in different ways — some by official Elo rating, others by tournament title or self-reported experience — and paired that against a range of standard cognitive batteries rather than a single test. Pooling studies that use different measures of both variables is exactly what a meta-analysis is for: a single study might overstate or understate the relationship depending on who it happened to sample, while pooling nineteen of them, across roughly 1,800 people in total, gives a far more stable estimate of the true underlying correlation than any one study could on its own.

Burgoyne and colleagues’ 2016 meta-analysis (Intelligence, corrected in 2018, with the overall estimate holding near 0.22 after correction) broke the 0.24 average down by cognitive domain: fluid reasoning correlated with chess skill at 0.24, comprehension-knowledge at 0.22, short-term memory at 0.25 and processing speed at 0.24. Numerical ability showed the strongest link at 0.35, ahead of verbal ability at 0.19 and visuospatial ability at only 0.13 — a genuine surprise, given how visual the game looks from the outside.

Bar chart of correlations between chess skill and six cognitive abilities from a meta-analysis, ranging from 0.35 for numerical ability down to 0.13 for visuospatial ability

None of these numbers describe a strong relationship. A correlation of 0.24 means cognitive ability, as these tests measure it, accounts for somewhere around 5-6% of the variation in chess skill across the pooled samples — real, worth explaining, and a small fraction of what actually separates a strong player from a weak one.

Why numerical ability and not visuospatial

The domain breakdown holds a genuine surprise. Chess looks like a visuospatial game from the outside — a board, pieces, geometric patterns of attack and defence — yet visuospatial ability produced the weakest correlation of any domain tested, at 0.13, while numerical ability came out strongest at 0.35. The likely explanation is that strong chess play depends less on rotating shapes in your head and more on calculation: tracking forcing sequences, counting material across several moves, holding a chain of if-this-then-that reasoning in mind while checking it against constraints. That is closer to arithmetic reasoning under working-memory load than to the kind of spatial rotation task a visuospatial subtest actually measures, which is exactly the sort of finding that a broad, unexamined assumption — “chess is a spatial game” — gets wrong until someone measures it directly.

Why the reputation outran the evidence

Chess earned its status as a shorthand for raw intelligence long before anyone ran a meta-analysis on the question. Competitive chess is public, scored with a single precise number, and its best-known players — Bobby Fischer winning the world championship as a Cold War news event, Garry Kasparov’s televised matches against IBM’s Deep Blue — were covered in exactly the language used for exceptional intellect. A precise, public rating number attached to a famous “genius” is a much more compelling story than a modest, noisy correlation coefficient, and the story took hold well before the research existed to check it. It is the same gap between a vivid anecdote and a measured effect size that shows up across several other durable myths about intelligence.

Your own number

Where would your own score land?

Take the IIF-certified assessment and get your score with the scale it was measured on, the percentile it corresponds to and the confidence range around it — the three figures most online tests leave out.

Find your IQ score now! →

Secure & encryptedInstant results10–20 minutes

The correlation gets weaker at the top, not stronger

If chess skill were mostly a measure of raw reasoning ability, you would expect the correlation to hold steady, or even strengthen, as players get more serious about the game. The opposite happened. Fluid reasoning correlated with skill at 0.32 in youth samples but only 0.11 in adult samples, and at 0.32 in unranked players but only 0.14 in ranked, competitive ones.

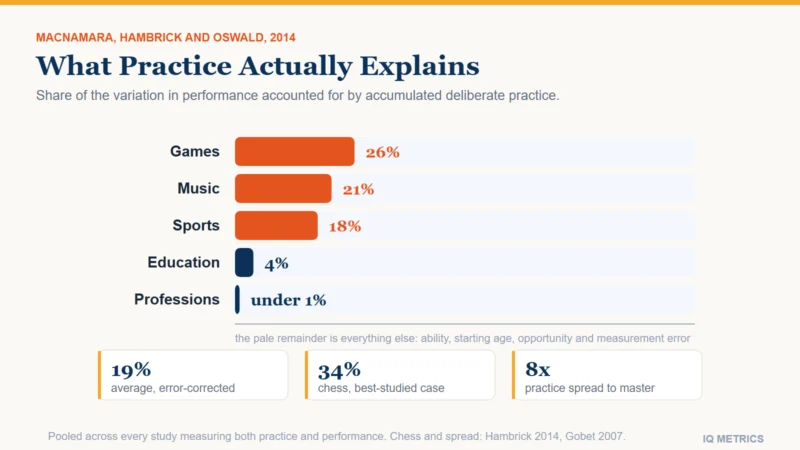
Two things are almost certainly driving that drop. The first is restriction of range: tournament players are already a self-selected group sitting well above the general population on cognitive measures, so there is simply less variation left for a correlation to be measured across. The second is that accumulated deliberate practice does most of the remaining work at the elite end — chess is the single best-documented case where practice explains a large share of skill variance, and that share only grows as players specialise. Raw ability may get you into the pool of serious players; once you are there, thousands of hours of study and opening preparation separate a 2000 rating from a 2700 one far more than a few IQ points would.

So, then, are grandmasters actually smart?

Probably above average, as a group — the selection into serious competitive chess in the first place likely filters on cognitive ability among other things, and the youth-sample correlations are meaningfully higher than the adult ones. But “probably above average as a group” is a much weaker claim than “rating tracks IQ,” and it is the second claim that gets repeated far more often than the evidence supports.

The two claims can both be true at once precisely because group averages and individual prediction answer different questions. Chess players collectively skewing above the general population on cognitive measures is fully consistent with a correlation of 0.24 — and separately, that same 0.24 is far too weak to let you predict one specific player’s IQ from their rating with any real precision. Two players rated 2200 could sit at noticeably different points on a cognitive-ability test and the rating alone would not tell you which was which. A rating measures chess skill extremely precisely; it was simply never built to measure anything else, and the data confirm it does that other job only weakly.

The site’s celebrity pages carry profiles for several well-known players, including Magnus Carlsen, Garry Kasparov, Bobby Fischer and Judit Polgar. None of them have a documented, professionally administered IQ score attached to their chess achievements — the figures that circulate for public figures are almost always estimates rather than test results, for reasons explained in where celebrity IQ numbers actually come from. Their rating is real and precisely measured. Their IQ, as a specific number, generally is not.

A different question than "does chess raise your IQ"

It is worth being explicit that this is a different question from the one covered in our article on whether playing chess raises your IQ. That piece asks about causation and transfer: does taking up chess make you more intelligent. This one asks about correlation among people who already play: does a higher rating indicate a higher IQ. The answers are compatible but distinct — a weak-to-modest correlation between skill and ability is consistent with chess practice producing skill gains that are mostly specific to chess itself, rather than gains that generalise into a broader measure like a full IQ test.

That pattern — skill in a narrow, heavily practiced domain outpacing any change in general cognitive ability — shows up across most “brain game” claims once they are tested rigorously, which is the same caution worth applying to any single activity marketed as a shortcut to a higher score, chess included. Getting better at chess reliably makes you better at chess; the evidence that it reliably makes you better at anything else is much thinner than the reputation implies. If you want to know where you actually stand rather than infer it from a hobby or a rating, a properly normed test is the direct route — though even a properly normed one runs into its own limits at the very top of the scale, which is where the correlation evidence here and the measurement ceiling start to overlap.

Share this article

Know someone who keeps seeing these numbers quoted without the scale they were measured on? Send it to them.

Tagged chess and iq, chess rating, chess ratings and iq, cognitive ability, deliberate practice, Elo rating, fluid reasoning, general intelligence, grandmaster, intelligence research, IQ Science, mensa, Processing Speed, Working Memory

IQ Testing for Children

Taking a Test

IQ Testing for Children: Ages, Norms, and What a Score Means

Children are not tested on the same instrument as adults, and the test itself changes twice before age eighteen. Here is which one applies when, how reliable an early score really is, and what a parent should and should not conclude from a single number.
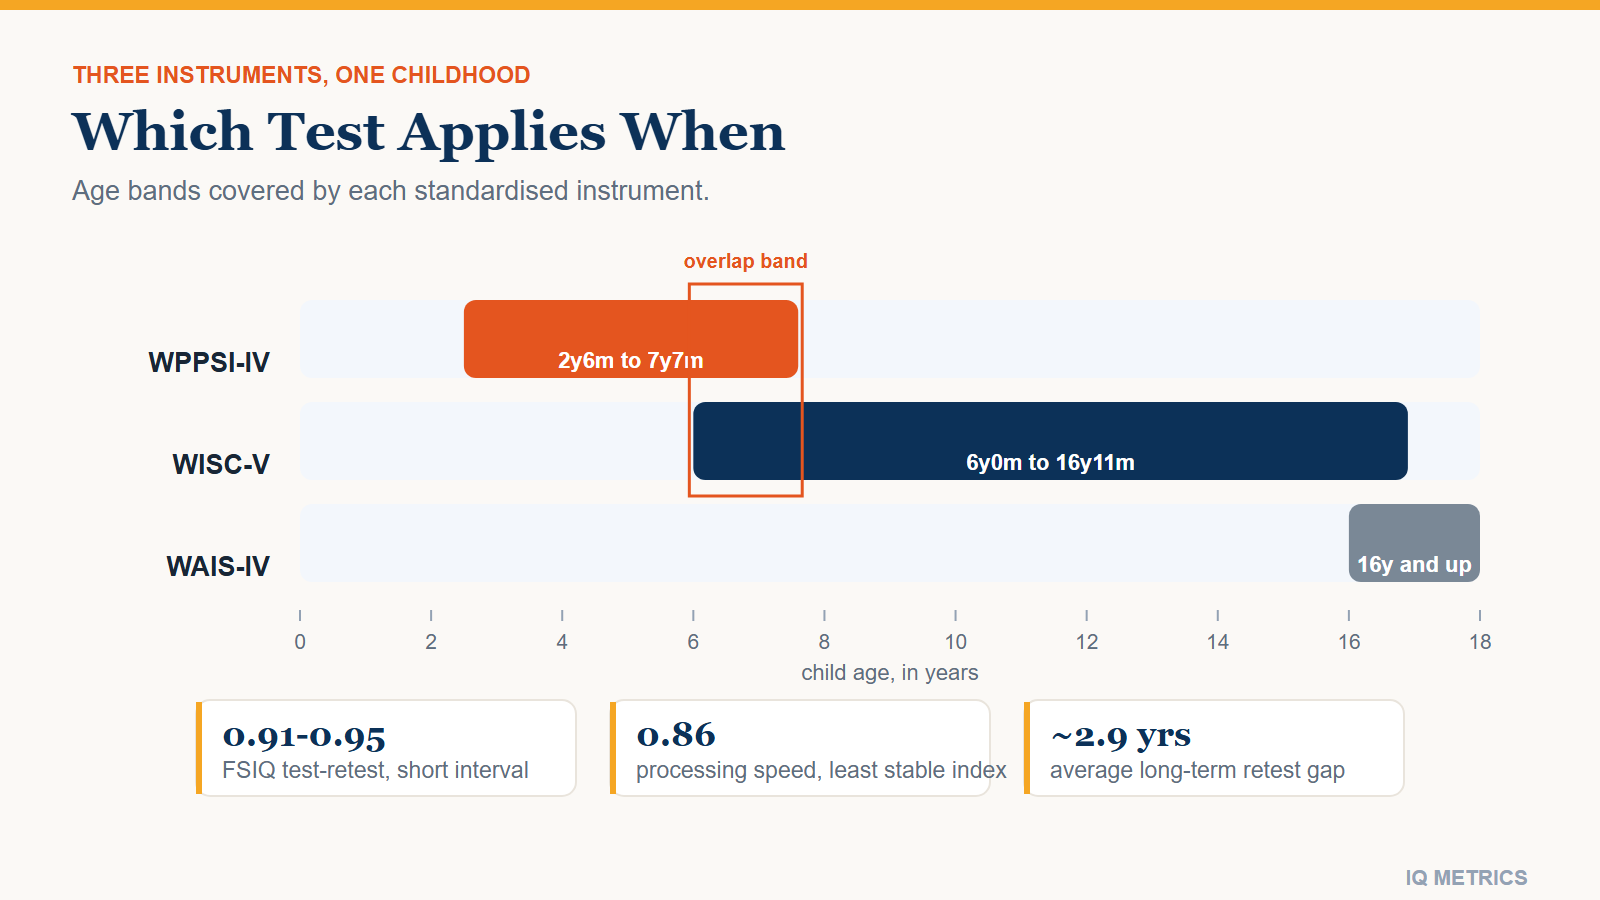
Timeline chart showing which IQ test applies at which childhood age, WPPSI from two and a half to seven, WISC from six to sixteen, and WAIS from sixteen onward, with the six to seven overlap band marked

Children are tested on different instruments than adults, and on more than one instrument across childhood. A five-year-old, a ten-year-old and a sixteen-year-old sitting for a cognitive assessment are not taking scaled-down or scaled-up versions of the same test — they are on entirely different instruments, built and normed separately for their age band, with different weighting between verbal and non-verbal tasks.

Knowing which test applies when, and how much weight to put on an early result, matters more than the score itself. A number produced at age five behaves differently — statistically — from the same number produced at age fourteen, even though both are reported on the identical 100-centred scale.

Which test, at which age

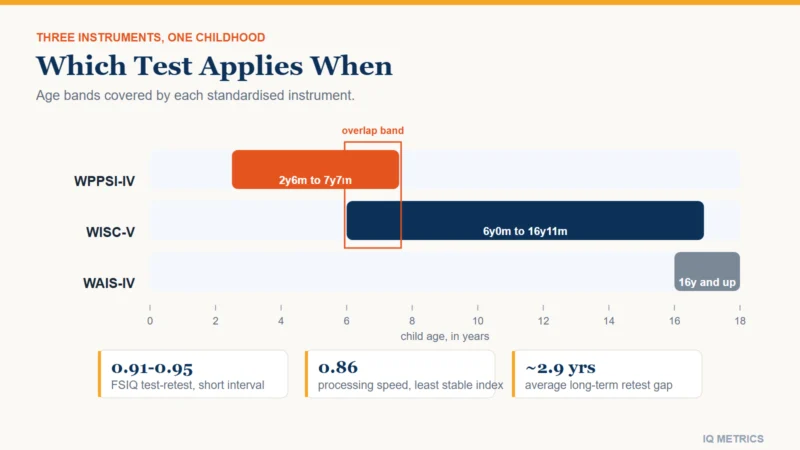
The Wechsler Preschool and Primary Scale of Intelligence (WPPSI) covers ages 2 years 6 months through 7 years 7 months. The Wechsler Intelligence Scale for Children (WISC) covers ages 6 years 0 months through 16 years 11 months, overlapping the WPPSI for roughly eighteen months, during which a clinician can choose either instrument depending on the child. From 16 onward, testing moves to the adult scale, the WAIS.

Timeline chart showing which IQ test applies at which childhood age, WPPSI from two and a half to seven, WISC from six to sixteen, and WAIS from sixteen onward, with the six to seven overlap band marked

The practical difference is not just item difficulty. The youngest WPPSI band leans heavily on non-verbal and receptive tasks — block patterns, picture matching, object assembly — because expressive vocabulary and sustained attention are still developing and are poor proxies for reasoning ability at that age. By the WISC years, verbal comprehension carries much more weight, and by WAIS the index structure (verbal comprehension, visual spatial, fluid reasoning, working memory, processing speed) is what a full adult report is built from. Each transition is also a renorming: a child moving from the WPPSI to the WISC is not just handed harder versions of the same items, but compared against a different standardisation sample entirely, one drawn specifically from children in that older age band.

What the index scores actually measure

A modern child’s report is built from several separate indices, not one number. Verbal comprehension covers vocabulary, reasoning with words and general knowledge. Visual spatial covers reading and reconstructing spatial patterns. Fluid reasoning covers spotting a rule in material the child has never seen before, independent of what they have been taught. Working memory covers holding and manipulating information briefly, such as repeating a sequence backward. Processing speed covers how quickly a child can complete simple visual tasks accurately under mild time pressure. The Full Scale IQ is a composite of all five, which means two children can arrive at the identical overall number by completely different routes — one strong across the board, another with a real strength in one area balancing a real weakness in another.

How stable is a child’s score, really

More stable than most parents expect, and less stable than a single adult retest would be. Short-term test-retest studies (children retested after a few weeks) put Full Scale IQ reliability in the 0.91-0.95 range. Longer-term studies, retesting children after an average gap of nearly three years, still found Full Scale IQ correlating around 0.91 between the two sittings. The weakest link is not the overall score but one specific index: processing speed, which is the least stable of the four main indices across repeat testing, sitting closer to 0.86.

This is a different question from the one answered in our piece on the best age to take an IQ test, which covers how much a result can move between sittings for a given child. This article is about the testing framework itself — which instrument, what it measures, and what a session looks like once you are in the room.

Your own number

Where would your own score land?

Take the IIF-certified assessment and get your score with the scale it was measured on, the percentile it corresponds to and the confidence range around it — the three figures most online tests leave out.

Find your IQ score now! →

Secure & encryptedInstant results10–20 minutes

What a session actually involves

A child’s IQ assessment is individually administered by a trained examiner, not a timed group test and nothing like a rapid online instrument. A full WISC or WPPSI session typically runs one to two hours, often split across a break, and moves between verbal questions, physical manipulatives (blocks, puzzle pieces, picture cards) and timed tasks scored for both speed and accuracy. The examiner is watching for more than the final number: how a child approaches an unfamiliar problem, whether attention holds up across the session, and whether a low score on one subtest reflects ability or something else, such as fatigue or anxiety about the setting. Most examiners spend the first several minutes building rapport rather than presenting test items, precisely because a nervous or unfamiliar child under-performs relative to their real ability, and a thorough report will usually note explicitly whether effort, attention or anxiety appeared to affect any particular score.

The output is not one number but several: an overall Full Scale IQ plus index scores for the separate domains, each with its own percentile. A parent handed only the composite score is missing most of what the assessment actually found; reading the individual indices is usually more informative than the single headline figure.

When a score does not match the classroom

One of the more common reasons a child ends up tested at all is a mismatch: a teacher reporting a struggling student who seems sharp in conversation, or a child who reads well above grade level but cannot finish timed classwork. A full index breakdown is built for exactly this situation. A child can score in the gifted range on verbal comprehension and fluid reasoning while scoring only average on processing speed, and on paper that produces a merely-above-average Full Scale IQ that undersells what is actually a twice-exceptional profile — high ability alongside a specific processing difference. This is also where ADHD, autism and dyslexia intersect with IQ testing: each of those can depress one or two specific indices without touching the others, and a composite score alone will hide exactly the pattern a parent or teacher needs to see.

When, and whether, to retest

Practice effects are real: a child retested soon after an initial assessment will often score somewhat higher on the same instrument simply from familiarity with the item types, not from a genuine change in ability. This is why professionals typically space formal retests at least a year apart, and why a single early result — particularly one from the WPPSI years — should be treated as one data point rather than a permanent label. How much of any later change reflects real development versus test familiarity is exactly the kind of question that made researchers go looking for domains where practice and repetition explain most of what separates high and low performers, which turns out to depend enormously on the domain — chess ratings are a particularly well-studied case.

What parents should actually do with a score

  • Read the percentile, not just the number. A percentile calculator converts any composite score into where it sits against same-age peers, which is what the number is actually for.
  • Do not over-weight one low or high index. A single depressed processing-speed score inside an otherwise average profile is common and is the least stable index for exactly that reason.
  • Treat a WPPSI-era score as provisional. The instrument is good at what it is designed for, but young children’s scores move more between sittings than an older child’s.
  • Use a licensed psychologist for anything with real stakes — a diagnosis, a placement decision, a gifted-programme application. A screening result is a starting point, not a substitute for a full evaluation.
  • Ask for the index breakdown, not just the composite. A flat profile and a spiky one can share the same headline number while calling for completely different next steps.

If you are exploring an assessment rather than pursuing a clinical evaluation, the site’s own children’s assessment, built for ages 4 to 17, gives instant access with no signup. For anything with academic, clinical or legal weight attached to the result, a licensed examiner administering a full WISC or WPPSI battery is the only appropriate route.

Share this article

Know someone who keeps seeing these numbers quoted without the scale they were measured on? Send it to them.

Tagged child development, child iq testing, cognitive ability, cognitive development, developmental testing, gifted children, intelligence research, IQ Science, iq testing for children, kids iq test, percentile rank, test norms, WISC, WPPSI

Assortative Mating and IQ

Research & Evidence

Do Smart People Marry Smart People? What the Research Shows

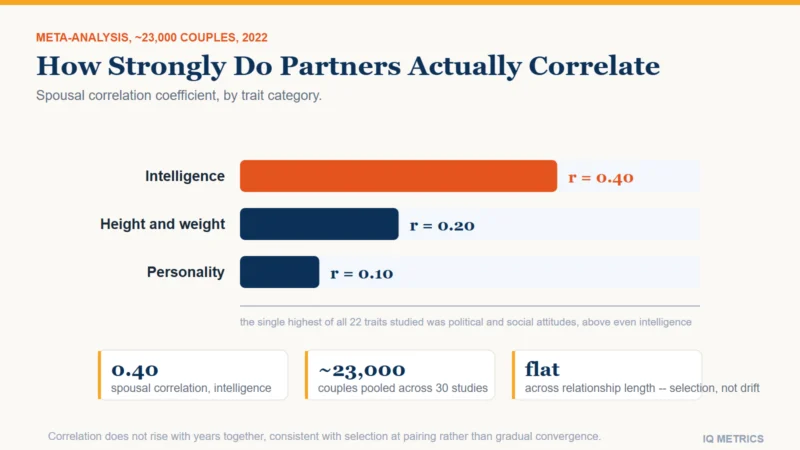
Married and long-term partners score more alike on IQ than on almost any other trait psychologists measure, personality included. The correlation is about 0.40, it shows up before the relationship starts, and it has real downstream effects on how heritability studies get interpreted.

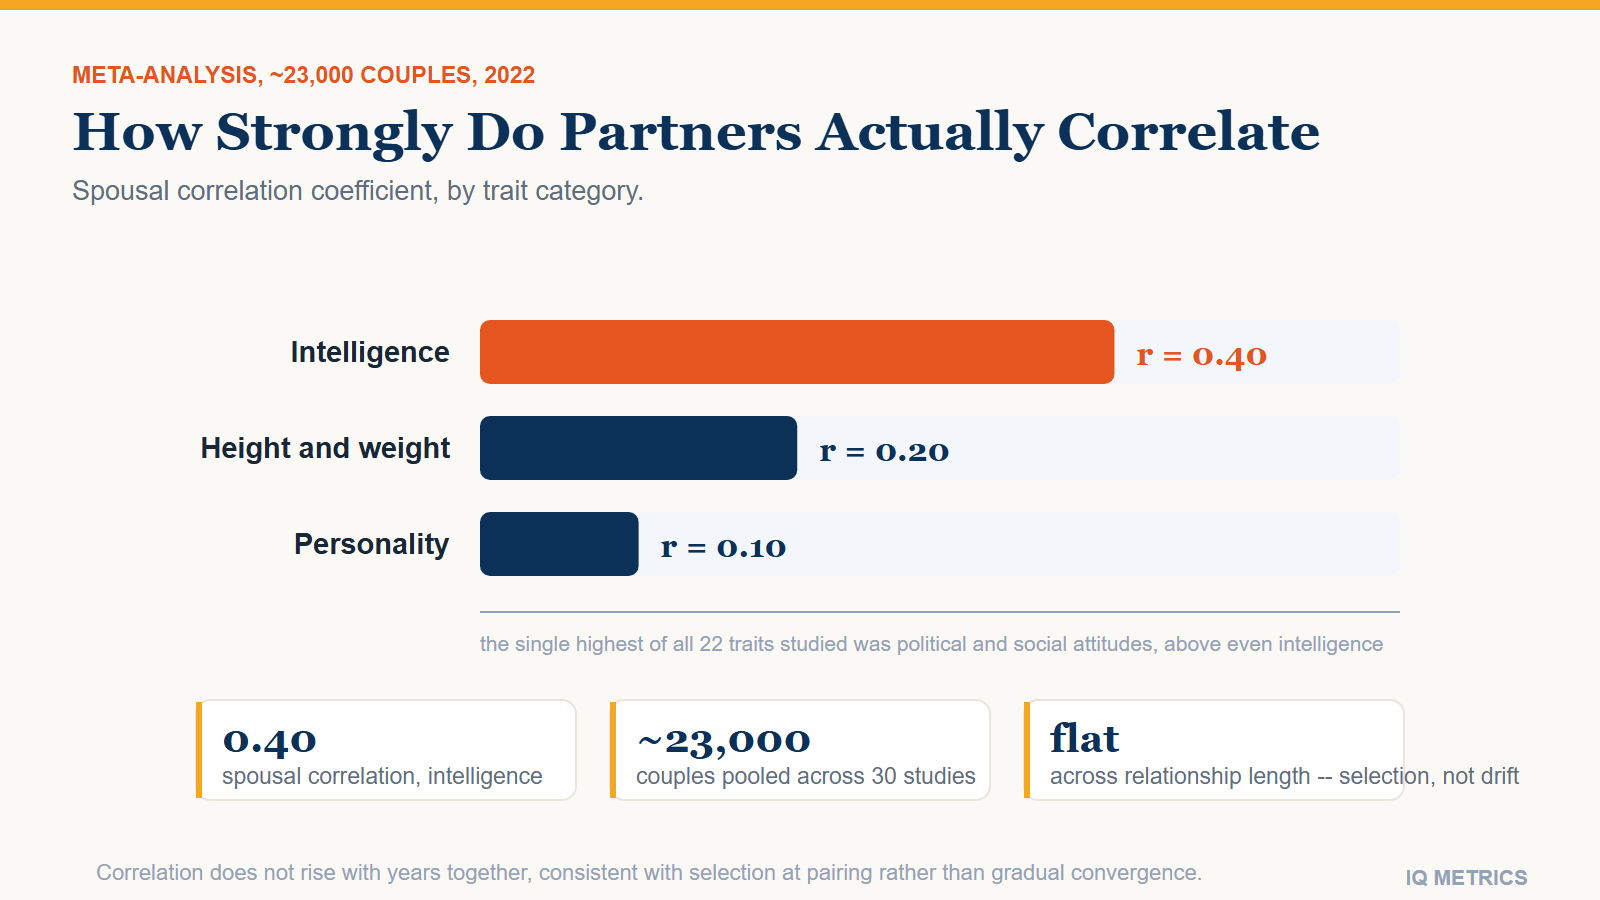
Bar chart comparing spousal correlation coefficients across trait categories, showing intelligence at 0.40, height and weight at 0.20, and personality traits at 0.10

Yes, and more strongly than for most other traits. Long-term partners’ IQ scores correlate at roughly 0.40, well above the correlation for height and weight (about 0.20) and personality (about 0.10). Psychologists call this assortative mating, and for cognitive ability it is one of the largest such effects researchers have measured for any trait.

That number is not just a curiosity about dating. It shows up in how heritability studies are interpreted, it affects how extreme scores are distributed across a population, and it has a specific, well-replicated answer to the obvious follow-up question: are people choosing similar partners, or do partners grow more alike over time?

How strongly do partners actually correlate

A 2022 meta-analysis pooled roughly 30 studies and about 23,000 couples across 22 different traits, from political attitudes to substance use to physical measurements. Correlations across all 22 traits ranged from 0.08 to 0.58, and cognitive ability sat inside the highest cluster alongside social and political attitudes. For intelligence specifically, the pooled spousal correlation landed around 0.40 — roughly double the correlation for height and weight, and about four times the correlation for personality traits such as conscientiousness or extraversion.

Bar chart comparing spousal correlation coefficients across trait categories, showing intelligence at 0.40, height and weight at 0.20, and personality traits at 0.10

Put another way: if you know one partner’s general cognitive ability and nothing else about a couple, you can predict the other partner’s ability better than you could predict their height, their weight, or almost any personality trait you might guess at instead. Political and social attitudes edged even higher in the same analysis, which is its own reminder that people sort into relationships along more than one axis at once.

Selection, not slow convergence

There are two very different stories that could produce a 0.40 correlation. Either people choose partners who already resemble them, or partners spend years together and gradually converge — picking up each other’s vocabulary, reading habits and interests until their scores drift closer. The evidence favours the first story. The correlation does not increase with relationship length in these datasets, which is what you would expect if the similarity were set at the point of selection and simply persisted, rather than something that builds gradually across a marriage.

That matters because it rules out the tidier, more romantic explanation. Couples are not becoming alike; they largely started that way, whether through shared environments that put similar people in the same rooms — university, a profession, a social circle — or through people actively noticing and preferring similarity when they had a choice.

Nobody compares scores on a first date

Almost none of this sorting happens through anyone actually comparing test results. People sort on visible, communicable proxies for ability — years of education, choice of career, vocabulary, the kinds of conversations someone gravitates toward — and those proxies correlate with measured IQ well enough that sorting on them produces the same downstream effect as sorting on the score directly. Educational attainment in particular tends to show spousal correlations at least as high as raw cognitive ability, and often higher, which makes sense once you notice that a degree, a profession and a reading list are all things a prospective partner can actually observe, where a percentile score is not.

Shared environments do a lot of the initial filtering for free. University, competitive workplaces and specific social circles concentrate people who already resemble each other on ability and educational trajectory before anyone makes an active choice, which is part of why the correlation is already sizeable before any deliberate preference gets involved at all — and part of why the earlier finding about overestimating a partner’s intelligence still fits: once the environment has done its filtering, most of the “sorting” left to notice is really just recognising you.

Your own number

Where would your own score land?

Take the IIF-certified assessment and get your score with the scale it was measured on, the percentile it corresponds to and the confidence range around it — the three figures most online tests leave out.

Find your IQ score now! →

Secure & encryptedInstant results10–20 minutes

Why this matters for genetics research

Twin and adoption studies, the backbone of what we know about how heritable IQ is, generally assume mating is close to random with respect to the trait being studied. Assortative mating breaks that assumption. When parents are more similar in cognitive ability than chance would produce, their children end up sharing more genetic variance for that trait than a simple additive model predicts, which is one reason sibling and twin correlations for IQ run slightly higher than a naive heritability calculation alone would account for. Behavioural geneticists build assortative mating into their models explicitly for this reason; ignoring it would quietly inflate certain heritability estimates.

It also interacts with socioeconomic status in a way that is easy to miss. Because people often meet partners through education and work, cognitive assortative mating and socioeconomic assortative mating travel together more often than not — which concentrates both genetic and environmental advantages (or disadvantages) inside the same households rather than spreading them evenly across a population.

There is a more specific technical wrinkle worth knowing if you ever read a twin study closely. Identical twins share essentially all their segregating genes regardless of how their parents paired up, so assortative mating cannot change an identical-twin correlation much. Fraternal twins and ordinary siblings, who share only about half their segregating genes under random mating, end up sharing somewhat more than half when their parents were drawn from an assortatively mated population — because both parents are pulling genetic variants for the trait from the same, narrower part of the distribution instead of independently sampling the whole population. A model that assumes purely random mating and ignores this will misread part of that extra sibling resemblance as shared environment or as additive genetic variance it did not actually measure, which is exactly why modern behavioural-genetic models estimate assortative mating as a term of its own rather than folding it into either category by default.

At the population level, sustained assortative mating on ability also tends to widen the spread of household outcomes over generations rather than narrow it — concentrating high scores, and the education and income that often travel with them, inside the same families instead of distributing them more evenly. Sociologists studying rising household income inequality treat “who marries whom” as one contributing thread among several, not the whole explanation, and untangling how much of it is the pairing itself versus everything that pairing correlates with remains an active, contested area of research rather than a settled number.

People are not great at judging what they are selecting for

One more finding is worth knowing before you assume this is all conscious. Research on how people rate their partners’ intelligence has found that people tend to overestimate a romantic partner’s cognitive ability even more than they overestimate their own — love, or at least attachment, appears to inflate the perception on top of whatever real similarity is already there. So the sorting itself looks fairly precise in aggregate data, even though any individual person asked to explain why they chose their partner is unlikely to describe it in terms of a matched percentile.

What this means if you have, or are raising, children

Two similarly high-scoring parents do not simply average into a guaranteed high-scoring child. Individual scores regress toward the population mean from the midparent value, a pattern Francis Galton first documented with height in the 1880s and which holds for cognitive ability too. Assortative mating does pull the midparent value itself further from the population average than random pairing would, which softens the regression somewhat compared to a scenario where partners paired up by chance — but it does not eliminate it. A child of two very high-scoring parents is likely to score high, and is also likely to score somewhat closer to average than either parent individually.

If that child is eventually tested, the practical questions are less about genetics and more about process — which instrument gets used, how stable an early score actually is, and what a single number should and should not be taken to mean. That side of it is covered in our guide to IQ testing for children.

The short version

Assortative mating for intelligence is real, large by the standards of trait correlations, and set mostly at the point partners choose each other rather than built up afterward. It is one input among many into how ability and opportunity end up distributed across families and generations — alongside heritability and socioeconomic status, not instead of them. If you are curious where your own score sits before speculating about any of this, a properly normed test is the only reliable way to find out.

Share this article

Know someone who keeps seeing these numbers quoted without the scale they were measured on? Send it to them.

Tagged assortative mating, assortative mating and iq, cognitive ability, general intelligence, genetics and iq, heritability of iq, intelligence research, IQ Science, mate selection, nature versus nurture, Regression to the Mean, Socioeconomic Status, spousal correlation, twin studies